34th Annual International Conference of the IEEE EMBS San Diego, California USA, 28 August - 1 September, 2012
Wireless Photoplethysmographic Device for Heart Rate Variability Signal Acquisition and Analysis Ivan Reyes, Homer Nazeran, Mario Franco, Emily Haltiwanger*
Abstract— The photoplethysmographic (PPG) signal has the potential to aid in the acquisition and analysis of heart rate variability (HRV) signal: a non-invasive quantitative marker of the autonomic nervous system that could be used to assess cardiac health and other physiologic conditions. A low-power wireless PPG device was custom-developed to monitor, acquire and analyze the arterial pulse in the finger. The system consisted of an optical sensor to detect arterial pulse as variations in reflected light intensity, signal conditioning circuitry to process the reflected light signal, a microcontroller to control PPG signal acquisition, digitization and wireless transmission, a receiver to collect the transmitted digital data and convert them back to their analog representations. A personal computer was used to further process the captured PPG signals and display them. A MATLAB program was then developed to capture the PPG data, detect the RR peaks, perform spectral analysis of the PPG data, and extract the HRV signal. A user-friendly graphical user interface (GUI) was developed in LabView to display the PPG data and their spectra. The performance of each module (sensing unit, signal conditioning, wireless transmission/reception units, and graphical user interface) was assessed individually and the device was then tested as a whole. Consequently, PPG data were obtained from five healthy individuals to test the utility of the wireless system. The device was able to reliably acquire the PPG signals from the volunteers. To validate the accuracy of the MATLAB codes, RR peak information from each subject was fed into Kubios software as a text file. Kubios was able to generate a report sheet with the time domain and frequency domain parameters of the acquired data. These features were then compared against those calculated by MATLAB. The preliminary results demonstrate that the prototype wireless device could be used to perform HRV signal acquisition and analysis. I. INTRODUCTION Monitoring, diagnostic, and therapeutic devices constitute an array of important assessment tools for clinicians in detecting health disorders and treating people who suffer from a wide variety of diseases. These could range from high blood pressure, diabetes, arrhythmia, among many others. Over the past few decades, communications and information technologies have aided significantly in the improvement and expansion of health care devices. Biomedical signals such as electrocardiograms (ECGs) and M. Franco, H. Nazeran, I. Reyes are with Electrical and Computer Engineering, University of Texas at El Paso, El Paso TX, 79968 USA. (Phone: 915-747-8937; e-mail
[email protected]). E. Haltiwanger is with College of Health Sciences, Rehabilitation Sciences, Occupational Therapy Program, University of Texas at El Paso, El Paso TX, 79968 USA.
978-1-4577-1787-1/12/$26.00 ©2012 IEEE
photoplethysmograms (PPGs) are used routinely in clinical medicine and physiological investigations for assessment of cardiovascular health. Heart rate variability (HRV) signal, a popular non-invasive quantitative marker of the autonomic nervous system, which is widely used to assess cardiac health, could be easily derived by acquisition of ECG or PPG signals. Reliable biomedical sensors (transducers) convert physiological signals into electrical or mechanical signals, which can be captured by diagnostic medical instrumentation found nowadays in hospitals and health care facilities [1]. Such sensors must possess specific characteristics in order to maximize their performance and provide the best signal quality. Currently, a major focus in clinical medicine is to reduce health care costs, increase health care delivery efficiency and offer the best care possible without jeopardizing the wellbeing of the patient [1]. This means that clinical and diagnostic methods are constantly evolving due to technological advancements, which strive to optimize the way physicians diagnose and treat diseases. This trend fuels the need of doctors and patients to be able to have diagnostic tests performed at low cost using the latest technology. One way to achieve this is by using personalized medical devices that would enable patients to collect their own physiological data outside of a clinical facility, for example from the comfort of their homes and using wireless technologies to transmit this information to their clinicians or health care providers. Consequently, state-of-the-art monitoring and diagnostic devices may need to be sensitive, real-time, reliable, accurate, fast, stable, safe, and of course inexpensive. Recent advancements in wireless sensing and technology have facilitated the non-intrusive acquisition of bio-signals from sensors and their transmission to monitoring devices and from these devices to a clinician’s office or hospital. Wireless local area networks, for example, allow for an easier access to patient data directly from the doctor’s office. This enables them to file patient’s information rapidly into their patient recording system. Wireless technology offers a number of advantages for monitoring of vital signs such as the heart rate. Physicians can collect data from their patients by having them wear a small wearable monitoring device and transmit their health data to a personal computer via a local area network. This grants patients more mobility, which reduces their physical and psychological stress [2]. Current Wi-Fi systems including cell phones could aid in wireless communication of medical information as their software can easily manage network connections. Also, they
2092
eliminate the need for an external power source for running additional software or powering additional hardware modules. In this paper we present preliminary results on a wireless PPG system that may be potentially suitable for HRV signal acquisition and analysis in smartphones or portable devices. II. METHODS & MATERIALS A. PPG Signal Acquisition and Conditioning A photoplethysmograph (PPG) circuit includes a standard light emitting diode (LED) and a phototransistor to collect the amount of light that passes through or gets reflected from the finger or other tissues. For example, the light that is emitted can be reflected or absorbed by the finger. In our device, the detecting photodiode and light source are on opposites sides of the finger, thus, the intensity of light reaching the collector can be measured and processed for analysis [3]. A low-power integrated dual operational amplifier chip from Texas Instruments (TI) was used for PPG signal amplification and further filtering. A 3.2 V battery-powered supply was deployed to increase the signal amplitude to 1.0 V peak-to-peak and limit the signal to a bandwidth of around 40 Hz. Signal filtering was achieved by using an active second order band-pass filter, which eliminated unwanted frequencies and provided unity gain. The corner frequencies of this filter were set to 0.5 Hz and 40 Hz, respectively. PPG monitoring devices often operate within this range. The clean waveform was amplified again for an approximate total gain of 1000. A negative feedback loop was added to help stabilize the PPG signal.
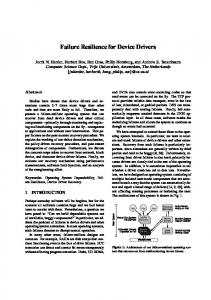
rate data were displayed on the interface. A block diagram of the described PPG system is shown in Fig. 1. LabVIEW has the advantage to customize a graphical user interface to produce visual results at different stages, and perform signal acquisition and processing of several stages [1]. In this device the required stages included the conditioned PPG signal display, estimation and display of the PPG signal spectrum and determination of the heart rate by detecting the rising edge of the PPG signal, power spectral analysis of the HRV signal, and display of the HRV signal spectrum and its features. Figure 1. Block diagram for the developed wireless photoplethysmographic (PPG) device.
B. Wireless Transmission and Reception The next stage of the device consisted of a multi-purpose microcontroller MSP430 eZ430-RF2500 also from TI. The battery-operated system captured the conditioned data into the I/O pin AN0, which was set to low to help stabilize power consumption when it was not getting input data [4]. The ADC channel sampled and converted the PPG signal at the output of the analog front end every 16 milliseconds [4]. The digital values obtained from the previous step were stored in memory and then transferred via UART. Consequently, the UART output was to be read by the PC from the receiver USB connection end. Two microcontrollers were used: one RF board behaved as end point (transmitter) and the other one as access point (receiver) [4]. Data were received through UART by the end point. Whenever data were not present, the RF antenna (embedded on the board) was turned off. For viewing the PPG data, an initial display system was developed in LabVIEW running on a PC. The user-friendly graphical interface accepted the PPG data through the access point of the microcontroller and displayed it on the PC. The PPG waveforms along with their power spectrum and heart
C. LabVIEW Signal Acquisition In order to perform acquisition of the PPG signal certain parameters had to be in plane by the LabVIEW acquisition system. By default the acquisition had to be performed every 3 seconds to achieve a successful digital conversion. In this part the DAQ channels were selected to show the photoplethysmographic waveform from the UART USB EZ430-RF2500 module. Signals from the MSP430 microcontroller from the transmitting end were sent to this module and were acquired via USB by the LabVIEW DAQ. D. Signal Processing A second order Butterworth filter was implemented in LabVIEW to improve the quality of the received PPG signal. Similar to the hardware filtering stage, the lower corner frequency used was of 0.05 Hz while the upper corner frequency was set to 6 Hz. This range was chosen since the human heart rate at rest cannot surpass 6 Hz.
2093
Fourier analysis of the PPG signal was achieved by applying the raw signal to the FFT function in LabVIEW. After the FFT function was computed, the normalized power spectrum density vs. frequency was calculated and displayed in the graphical user interface. By visualizing the frequency content of the PPG signal, it is possible to analyze the PPG signal characteristics under different conditions. Once the PPG signal was completely filtered and ready to be processed, data were recorded and saved as a text file. The recording process took approximately five minutes for each individual. Next, the captured data file was uploaded into a MATLAB program which was able to detect the R-R peak intervals of the PPG waveform and generate an additional file containing all the peaks during the recording time. Finally, HRV was generated by feeding the peaks of the PPG signal into the Kubios software. Otherwise, Kubios would be unable to generate the HRV analysis. The Kubios tool consists of an easy-to-use graphical user interface which generated a report sheet that included heart beat frequency, mean of R-R intervals, low and high frequency components, among other features. E. LabVIEW Signal Display To display the PPG signals and some of their parameters a preliminary LabVIEW graphical user interface (GUI) was created as shown below in Fig. 2a and 2b. With this GUI, it would be possible to adjust the PPG signal acquisition and processing parameters to improve the quality of this physiological signal. Figure 2a. GUI of PPG normalized power spectrum and some other parameters.
overall variability of HR over the time of recording. On the other hand, frequency-domain calculations pertain to HR variability based on specific frequency ranges linked to physiological processes. Figure 2b. GUI of the prototype wireless PPG system showing the filtered PPG signal.
To extract spectral features, frequency domain analysis was performed on the recorded signal. Total Power (TP), Low Frequency (LF), and High Frequency (HF) components were calculated. The LF power spectrum reflects the sympathetic dominance of the ANS, whereas the HF component is indicative of the parasympathetic dominance. The TP represented all possible mechanisms contributing to the overall HRV signal analyzed over a period of 5 minutes. The LF/HF is indicative of the balance between sympathetic and parasympathetic branches of the ANS. A report sheet generated by Kubios can be seen in Figure 3. It summarizes the aforementioned HRV parameters derived from the PPG data acquired from one of the volunteers. The same processing was applied to the PPG data acquired from each volunteer and the following results were obtained (see Table 1). Figure 3. Kubios HRV analysis report for one of the participants.
III. RESULTS HRV signal analysis requires about five minutes of ECG signal recording under normal physical and mental circumstances. Usually HRV data analysis is carried out in time-domain and frequency-domain. From the time-domain analysis parameters such as the mean heart rate are extracted. Basically, time-domain parameters are related mostly with
By performing HRV signal analysis using the PPG signal for each person, we were able to generate their time-domain and frequency-domain features using the widely established
2094
Kubios software. This information would provide a means for comparison of the detailed characteristics of PPG signals against ECG signals, which are customarily used for HRV signal analysis. As such the suitability of PPG signals and the utility and validity of wireless PPG systems such as the one developed in this research could be assessed for this purpose.
planned to emulate the current LabVIEW programs to obtain, process, and display the PPG signal. Moreover, the HRV signals and their spectra will be computed and displayed. The smartphone application will be developed to serve as user-interface with touch screen capabilities, along with fast signal acquisition via wireless Bluetooth protocols.
Table 1. Average HR and LF/HF ratio for five subjects.
VI. REFERENCES
Subject 1 Subject 2 Subject 3 Subject 4 Subject 5
Average HR 63.93 89.56 73.80 98.48 71.90
LF/HF Ratio 0.43 1.35 0.48 0.61 0.82
IV. CONCLUSION Each stage of the system was constructed and tested separately. The entire prototype system as shown in Fig. 1 was then implemented and tested as a whole. The sensing stage detected the transmitted light and converted it into the PPG signal. The PPG signal was then amplified and filtered. The acquired PPG signal was fed to a microcontroller, which converted it from its analog form into digital form for reliable wireless transmission. The access point connected to a personal computer received the data to be displayed. A LabVIEW program was developed to show the complete PPG waveform along with a heart rate count and the PPG signal spectrum. Satisfactory results were obtained at each stage of this prototype device.
[1]
Enderle, John D., Bronzino, Joseph D., and Susan M. Blanchard. Introduction to biomedical engineering. Boston : Elsevier Academic Press, 2005.
[2]
Lonnblad, J., Castaño, J. G., Linden, M., Backlund, Y. (2004). Optimization of wireless bluetooth sensor systems. IEEE EMBS, 24, 2133-2136.
[3]
Stojanovic, R. & Karadaglic, D. (2006). LED-LED-based photoplethysmography sensor. IOP Publishing, 28, 19-27.
[4]
Joshi, A., Ravindran, S., Miller, A. (2010). EKG-based heart-rate monitor implementation on the MSP4302xx launch Pad Value Line Development Kit. TI, 486, 1-14.
[5]
Geltz, B., Berlier, J., McCollum. J. (2010). Using the iPhone and iPod touch for remote sensor control and data acquisition. IEEE SouthEastCon, 9-12.
[6]
Heart Rate Variability Basics. http://www.biocomtech.com/hervscience. 2011. Poulsbo, WA 98370.
The prototype wireless PPG system described here is capable of capturing the pulsations of the flow of blood in the arteries. Nonetheless, it requires further improvements in motion noise reduction as well as HRV signal derivation and analysis capabilities. To demonstrate its functionality, PPG signals from five healthy individuals were acquired and their HR and LF/HF values were calculated. After the system displayed the captured clean and conditioned PPG signals, data were saved in text files and imported into MATLAB. The RR peaks were then extracted and calculated so that they could be imported into the Kubios software. Comprehensive HRV signal analysis was carried out using Kubios. This software package generated the time-domain and frequency-domain characteristics of the recorded PPG signals. The LF/HF was used to demonstrate the level of relaxation in 5 volunteer subjects. These preliminary results demonstrate that the prototype wireless device could be used to perform basic HRV signal acquisition and analysis. V. FUTURE DEVELOPMENT In its future realization, the system would deploy an iOSbased mobile device like most smartphones to replace the laptop computer. An iOS application under development is
2095