WISE-Cluster: Clustering E-Commerce Search Engines Automatically Qian Peng, Weiyi Meng, Hai He
Clement Yu
Department of Computer Science SUNY at Binghamton Binghamton, NY 13902, USA 1-607-777-4311
Department of Computer Science University of Illinois at Chicago Chicago, IL 60607, USA 1-312-996-2318
[email protected]
[email protected]
ABSTRACT In this paper, we propose a new approach to automatically clustering e-commerce search engines (ESEs) on the Web such that ESEs in the same cluster sell similar products. This allows an ecommerce metasearch engine (comparison shopping system) to be built over the ESEs for each cluster. Our approach performs the clustering based on the features available on the interface page (i.e. the Web page containing the search form or interface) of each ESE. Special features that are utilized include the number of links, the number of images, terms appearing in the search form and normalized price terms. Our experimental results based on nearly 300 ESEs indicate that this approach can achieve good results.
Categories and Subject Descriptors H.3.3 [Information Storage and Retrieval]: Information Search and Retrieval – Clustering; H.3.5: Online Information Services – Commercial Services, Web-based Services.
General Terms Algorithms, Performance, Design, Experimentation.
Keywords Search engine categorization, document clustering
1. INTRODUCTION A large number of databases are Web accessible through formbased search interfaces and many of these Web sources are Ecommerce Search Engines (ESEs). Providing a unified access to multiple ESEs selling similar products is of great importance in allowing users to search and compare products from multiple sites with ease. A system that supports such a unified access to multiple ESEs may be called as an E-commerce metasearch engine (EMSE for short). A number of EMSEs have been created for some application areas on the Web. For example, addall.com searches books from multiple book sites. To be able to provide users with a unified access to multiple ESEs, the first task is to collect ESEs from the Web and classify them into different groups such that the ESEs in the same group sell the same type of products (i.e., these ESEs are in the same domain). Next, the search interfaces of the ESEs in the same group are integrated into a unified search
Permission to make digital or hard copies of all or part of this work for personal or classroom use is granted without fee provided that copies are not made or distributed for profit or commercial advantage and that copies bear this notice and the full citation on the first page. To copy otherwise, or republish, to post on servers or to redistribute to lists, requires prior specific permission and/or a fee. WIDM’04, November 12-13, 2004, Washington, DC, USA. Copyright 2004 ACM 1-58113-978-0/04/0011…$5.00.
interface, which becomes the search interface of the EMSE for this group. When a user query is submitted to the EMSE, it will be mapped to the underlying ESEs for evaluation. In general, building and maintaining EMSEs that involve a large number of ESEs is a labor-intensive and time-consuming undertaking due to the autonomous nature of the Web environment. Our E-Metabase project aims to develop techniques that can significantly enhance the automation of the process of building and maintaining largescale EMSEs. In [6], we reported WISE-Integrator – a prototype system for automatically integrating multiple ESE search interfaces in the same domain into a unified search interface. WISE-Integrator and other search interface integration techniques (e.g., [4, 15]) require that all the input search interfaces be from ESEs in the same domain. In this paper, we report the design of WISE-Cluster – a tool that automatically clusters ESEs into different groups according to their domains. (In this paper, WISE stands for Web Interface of Search Engine.) ESE clustering has not received much attention despite its emerging importance. The work in [5] is the only published work on this topic that we are aware of. In [5], a model-based clustering technique is applied to the schema (i.e., the attribute labels) associated with the search form of each input ESE. This approach has the following weaknesses: (1) the schema information is manually obtained; (2) much useful information on the interface (see Section 3) is not utilized; (3) the issue of handling different types of search interface pages (see Section 2) is not addressed. Our approach is designed to address these issues while employing a different clustering method. ESE clustering is related to search engine categorization [8, 12]. The search engines considered in these two papers are document search engines (which search documents/Web pages) not ESEs (which search structured product data). Both techniques are query submission based, i.e., queries are submitted and the returned results are analyzed. They suffer from the difficulties of forming good probing queries and connecting to search engines automatically. In contrast, the method proposed in this paper uses only the Web pages that contain the search forms of the considered ESEs to perform clustering, and requires no probing queries to be submitted. The reason that we do not need a query submission based approach for ESEs is that the interface pages of ESEs usually contain a substantial amount of information about the searchable contents (products) while the interfaces of document search engines contain little information about the indexed documents. ESE clustering is also related to document clustering (e.g., [9, 10, 17, 18]) and Web page clustering (e.g., [1, 19]). However, there are fundamental differences between existing approaches for clustering documents/Web pages and our approach for clustering ESEs. Traditional document clustering uses only terms in each document while Web page clustering uses both terms in Web pages and links connecting the Web pages. In contrast, our approach places more
emphasis on terms that appear in the search form of each ESE search interface. In addition, we also utilize the number of images/links and normalized price terms in each ESE interface page. Furthermore, an ESE interface page is not equivalent to a Web page/document because multiple ESEs may appear on a single interface page (see Section 2 for more detail). The need of separating multiple ESEs from a single page and extracting the feature information for each ESE automatically is unique in ESE clustering. This paper has the following contributions. First, a new approach for clustering ESEs is proposed. It is based on the interface pages of ESEs and utilizes the unique features of ESEs. Second, it provides a detailed analysis of different types of ESE interface pages. Six different types are identified and different treatments of these types are provided. The differentiation of different types of ESE interface pages is an important preprocessing step to enable the clustering of ESEs. Third, it provides a method to utilize price values that appear in ESE interface pages. We also provide extensive experimental results to measure the effectiveness of the proposed clustering approach and to find out the impact of different features on the effectiveness of our approach. We should point out that an existing document clustering algorithm is extended and utilized in this paper. The main contribution of this paper, therefore, is not a new clustering algorithm but rather, as pointed out above, is the identification of some new features useful for ESE clustering and their impact on ESE clustering.
3.
Figure 1. Airfare.com search forms 4.
The rest of the paper is organized as follows. Section 2 discusses six types of ESE interfaces and their preprocessing. Section 3 discusses the features that are utilized for ESE clustering in our approach and how the features can be automatically extracted. Section 4 presents the ESE clustering algorithm. Section 5 discusses the assignment of each cluster to appropriate concepts in a concept hierarchy. Section 6 provides the experimental results. Section 7 presents the implementation of the WISE-Cluster prototype system. Finally, Section 8 concludes the paper.
2. DIFFERENT TYPES OF ESE INTERFACES While most ESEs are dedicated to one category of products or services, a significant number of ESEs cover multiple categories of products. For examples, Barnes & Noble focuses mostly on book sale, but it also sells music CDs, DVDs and online courses. Based on our analysis of 270 ESE sites, we identify the following 6 types of ESE interfaces. 1.
Devoted Type. In such an interface, only one ESE search form exists and it can search only one category of products. About 83% of the ESE sites we studied belong to this type (see Table 1).
2.
Divided Type. Such an interface can search multiple categories of products but it also has separate child ESE search interfaces for different categories of products. For example, Amazon.com has a simple parent interface that can search different categories of products, but it also has different child search engines such as Book Search Engine, Music Search Engine, etc. In this paper, the child ESEs of the same site are treated as separate ESE interfaces for clustering purpose. The relationships between child ESEs and the parent ESE can be discovered by a Web crawler when these pages are crawled.
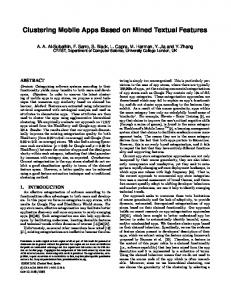
Co-existing Type. In this case, multiple ESEs coexist on a single Web page. For example, the airfare.com interface page (Figure 1) has 4 search forms that can search flight, car reservation, travel package and hotels separately. In our approach, search forms on the same interface page are first separated and then treated as separate ESE interfaces during clustering.
Merged Type. In this case, a single search form can search multiple categories of products and the search fields of different types of products co-exist in the search form. Moreover, only one submission button is available. For example, In Figure 2 alldirect.com sells books, music and movies, and its search form contains book attributes (e.g., book ISBN), music attributes (e.g., music artist) and movie attribute (e.g., movie title). This type of interface is rare as only one such interface is found among our 270 samples. In our approach, such attributes are separated into different logical interfaces such that each logical interface covers only one category of products. A simple method is applied to achieve this. First, attributes of the search form are grouped based on their leading words. For example, in Figure 2 attributes like book author and book ISBN will be grouped together while attributes like music artist and music album title will form another group. Next, a logical interface is formed based on the rest of the page (the non-form portion) and the terms in one group. The relationship between the real ESE interface and its logical interfaces is kept. During ESE clustering, each logical interface is treated as an independent ESE. After clustering is done, logical interfaces are replaced by their corresponding real ESEs for creating EMSEs. As a result, a real ESE may appear in multiple clusters.
Figure 2. Alldirect.com search interface 5.
Shared Type. In this case, the ESE site has multiple child pages for different types of products but these pages share the same search form (i.e., the same search form is available on all child interface pages). Usually the search form in this case contains
only one text input field but it can search multiple categories of products. For example, in the HalfPriceBooks.com site, there are child pages for books, music, software, etc., but they all contain the same search form. Note that each child page contains more information about a specific category of products. In our approach, we treat each such child page as a separate ESE for clustering purpose. Since these ESEs all correspond to the same real search engine, our approach here leads to the same real search engine to be assigned to multiple clusters. 6.
Multi-page Type. An ESE of this type spans multiple pages and it requires multiple interactions with the user to complete a search query. For example, the insurance company AAMI in Australia has separate search engines to quote car, home and caravan insurance policies. A query for an insurance quote requires a sequence of pages to complete and each page requires a submission. Only after all pages are submitted, the query is considered completed and the result will be displayed. As we do not employ query-submission based approaches in this paper, for an ESE of the multi-page type, only the first page of the ESE is used for clustering (note that the second page can be obtained only after the first page is filled and submitted). To compensate for not using all the query submission pages, we use some child pages of this type of ESEs. Most company Web pages have child pages that provide more information about the company as well as its products/services. These pages can typically be found by following links labeled by “About Us”, “About Me”, ”Company Information”, “Who We Are” or “Introduction”. In this case, the information in such relevant child pages will be added to the parent page to represent the ESE during clustering.
1.
The number of links/images. Our observation and analysis of the 270 ESE sites indicate that this feature is very useful for differentiating ESEs that sell tangible products from those selling intangible products. Tangible products are those that have a physical presence such as books and music CDs while intangible products have no physical presence such as insurance policy. The interfaces of ESEs that sell tangible products usually have more images/links than those that sell intangible products. The reason is that ESEs selling tangible products tend to display their products to attract customers (as the saying goes: “A picture is worth a thousand words”) but ESEs selling intangible products have no physical product to display. In this paper, images that we consider exclude junk images such as decoration labels, buttons or icons. Junk images can largely be detected by their sizes (can be obtained from the width and height attributes of images) and the ratio of width to height of the images.
2.
Price values. For online shopping customers, price information is very important for their purchase decisions. Therefore, to attract consumers, bargaining products or top-selling products are frequently advertised with prices on the interface pages of ESEs that sell tangible products. Products of the same category usually have similar prices. As such, the range of price values can be useful to differentiate different types of products. For example, the typical price range of a book is between $5 and $25 in 1bookstreet.com and usually does not exceed the price of a digital camcorder, whose price typically ranges from $200 to $1700 in cameraworld.com. It is easy to identify prices on ESE interfaces as they usually have prefix of currency symbols, such as Dollar “$”, Yuan “¥” and Pound “£”. Price values cannot be compared directly for clustering purpose. For example, values 19.95 and 19.99 are very close even though they are different. To facilitate meaningful comparison, we convert each actual price to a representative price that will then be used for comparison. Each representative price represents all prices within a certain price range. For larger prices, the range should also be larger. This is because a $10 difference is much more significant for low-price items than for high-price items. In our method, we use the following function to map an original price P to a representative price P':
Table 1 shows the numbers of ESE interfaces of different types among the 270 ESE sites we studied. The last column indicates the number of ESEs after child interfaces and logical interfaces have been separated. Table 1. The distribution of different types of ESEs Type
Counts Before Processing
Percentage
Counts After Processing
Devoted
224
82.96%
224
Divided
5
1.85%
14
Co-existing
3
1.11%
9
Merged
1
0.37%
3
Shared
6
2.22%
13
Multi-page
31
11.48%
31
Total
270
100.00%
294
if 5, P' = log P if P / m − 0.5 ∗ m, m = 10
P>5
As an example, given a DVD with price $16.99, we have m = 10 and P'= 20. In fact, all prices in (15, 25] will be mapped to the same representative price 20. The range grows larger for higher prices, reflecting the fact that the prices of more expensive items fluctuate more in absolute values. As another example, all prices in (1500, 2500] will be mapped to 2000 using the above formula. Representative prices are also called price terms in this paper. The price information in an ESE interface can be represented as a vector of price terms with weights. The weight of a price term can be computed using the standard tf*idf formula [14], which is an increasing function of the term’s frequency on a page (i.e., the number of times the price term appears on the interface) and a decreasing function of the term’s document frequency (i.e., the number of ESE interfaces that have the price term).
3. ESE INTERFACE FEATURES AND FEATURE EXTRACTION 3.1 Features of ESE Interfaces Our proposed ESE clustering method is based on the features available on ESE interfaces. As a result, it is critical to identify important features on ESE interfaces. The following features are utilized in our method.
P≤5
3.
Form terms. A typical ESE search form has an interface schema, which contains some attribute labels and a number of form control elements, such as text boxes, selection lists (i.e.,
pull-down menus), radio buttons or checkboxes, to allow users to specify more precise queries than using just keywords. Attribute labels specify the real meanings of their associated elements. For example, in the book search form of amazon.com, the label “Format” is followed by a selection list which has values like “hardcover”, “paperback” and so on. Often, these labels and elements together represent the inherent logical attributes of the products in the back-end databases. The labels and values of the attributes can strongly indicate the contents of the ESE, and are, therefore, very useful for ESE clustering. For example, a book search engine may have labels such as “title”, “author”, “ISBN” and “category”; the “category” also may have such values as “art”, “history”, “novel” and “business”. In our approach, form terms include both labels and values associated with form elements. In contrast, only attribute labels are used in the approach in [5]. The form terms in an ESE interface can also be represented as a vector of terms with weights. Again, the weights are computed using the tf*idf formula in our current implementation. 4.
Regular terms. All content terms in an ESE interface page, other than price and form terms, are called regular terms. Regular terms may also reflect the contents of ESE databases. For example, in the Web pages of digital camera stores, there usually are some terms specific to cameras, such as “Kodak”, “Olympus”, “Resolution pixel” and “LCD” while the Web pages selling cars may have regular terms like “Honda”, “Ford”, “Model”, “Make”, “Engine”. The regular terms in an ESE interface page can also be represented as a vector of regular terms with weights. Note that form terms and regular terms may overlap.
To simplify notations in the following sections, for a given ESE interface, we use N to represent the total number of images and hyperlinks, P to represent the vector of price terms with weights, FT to represent the vector of weighted form terms and RT to represent the vector of weighted regular terms. Based on these notations, an ESE interface E can be represented as E = (N, P, FT, RT).
3.2 Extracting Features from ESE Interfaces In order to make WISE-Cluster an automated tool for ESE clustering, it needs to have a component that is capable of automatically extracting the desired features from each ESE interface as described in Section 3.1 when the URL of an interface page containing the ESE is provided. There are primarily three tasks in extracting desired features from ESE interfaces. The first is to extract all potential forms from the interface page. The second is to identify appropriate search forms from the extracted forms. The third is to extract regular terms, prices, links and images from the non-search form portion of the interface page. These three tasks are briefly discussed below. 1.
2.
Extract forms. An ESE interface page may contain more than one form and each form could be a potential search form. To extract all forms and the contents of each form, we employ a simplified version of WISE-iExtractor [7]. WISE-iExtractor is a prototype system in our E-Metabase project that can automatically extract labels, element values and other useful information from ESE search forms for ESE interface integration and query mapping. Identify search forms. A vast majority of the search forms of search engines are implemented using the HTML form tag
( and ). However, form tags are also used to implement non-search applications such as online survey and fact listing (e.g., using a pull-down menu to list all states). Therefore, it is necessary to differentiate search forms from non-search forms. A machine learning method for automatically discovering search engines is reported in [2]. However, it is not designed to discover only ESEs. The approaches in [3, 13] first use some simple heuristics to identify and eliminate some non-search forms and then they submit queries against the remaining forms. Based on the query response, additional non-search forms can be identified and eliminated. Since query submission is not considered in this paper, we only apply some heuristics to identify search forms. In our current implementation, the following heuristics are employed: 1) the form has an action attribute for interacting with the search engine server; 2) the form has a submission button with special associated keywords such as “find”, “search”, “query” and “quote”; 3) the form should at least have an textbox or a selection list; 4) forms that only contain checkboxes are not search forms; 5) forms that have only one element which is a selection list are discarded; and 6) if multiple forms on the same page have the same action value, only one form is randomly selected because in this case, all these forms invoke the same search server. After these heuristics are applied, the remaining forms are assumed to be the candidate search forms. If there are multiple candidate search forms on the same page, each form is combined with the non-search form information on the page to form a separate ESE (see Section 2). 3.
Extract non-search form information. Extracting regular terms is straightforward. To obtain the number of links on an interface page, we only need to identify the special HTML tag for links and count its occurrences. Each link has an anchor tag with href attribute (
and ). To obtain the number of images, we first identify HTML image tags with src attribute (i.e.,
). After each image is fetched, its area and its height/width ratio are computed. If the area is below a threshold (images of buttons, icons and labels are usually very small in size) or the ratio is above a threshold (many decoration images have very large ratios), the image is eliminated. Then we count the number of remaining images. Prices are identified by numbers prefixed with special symbols such as $ and ¥, and thus can be easily obtained.
4. CLUSTERING ALGORITHM Our clustering algorithm consists of two phases. In the first phase, all ESEs are clustered into two groups, one for selling tangible products and the other for selling intangible products. This is carried out by comparing the number of images/links (N) in an ESE with a threshold T1 to be determined by experiment. If N ≥ T1, the ESE is placed into the first group (tangible group); otherwise, it is placed into the second group (intangible group). In the second phase, ESEs in each group are further clustered using other features (i.e., P, FT and RT for the tangible group, and FT and RT for the intangible group). There is no fundamental difference between clustering the ESEs in the tangible group and those in the intangible group except that the latter does not have the price vector P. In both cases, the basic idea is to use features to cluster similar ESEs together based on their feature similarity. The similarity between two ESEs is defined to be the weighted sum of the similarities between the price vectors (for the tangible group only),
the form term vectors and the regular term vectors of the two ESEs. More specifically, for two ESEs E1 and E2, let simRT(E1, E2), simFT(E1, E2) and simP(E1, E2) be the similarities between E1 and E2 based on their regular term vectors, form term vectors and price term vectors respectively, and let similarity(E1, E2) be the overall similarity between E1 and E2. The following formula is used to compute similarity(E1, E2): similarity(E1, E2) = W1*simRT(E1, E2) + W2*simFT(E1, E2) + W3*simP(E1, E2),
(1)
where weight coefficients W1, W2 and W3 will be determined by experiments. For ESEs in the intangible group, W3 = 0. In our current implementation, the similarity between two vectors is computed using the Cosine similarity function [14]. In the following, we describe the second phase of the clustering algorithm. This phase itself consists of two steps. Preliminary Clustering step: In this step, a simple single-pass clustering algorithm [14, 18] is applied to obtain a preliminary clustering of the ESEs in each group. The basic idea of this algorithm is as follows. First, starting from an arbitrary order of all the input ESEs, take the first ESE from the list and use it to form a cluster. Next, for each of the remaining ESEs, say A, compute its similarity with each existing cluster. Let C be the cluster that has the maximum similarity with A. If sim(A, C) > T2 for some threshold T2, which is to be determined experimentally, then add A to C; otherwise, form a new cluster based on A. Function sim(A, C) is defined to be the average of the similarities between A and all ESEs in C computed using Formula (1). This step of the algorithm has the advantage of being efficient. However, it is sensitive to the order in which the ESEs are considered. It is possible that an ESE may not be included in the most suitable cluster due to the order it is considered. Refining step: This step tries to remedy the weakness of the previous step. The idea is to move potentially unfitting ESEs from their current clusters to more suitable ones (The idea of reallocating objects to more fitting clusters after an initial clustering was first proposed in [11]). This is carried out as follows in our implementation. (1) We compute the average similarity AS of each cluster C, which is the average of the similarities between all ESE pairs in cluster C (there is no need to re-compute these similarity values as they were already computed in the Preliminary Clustering step). (2) Identify every ESE A in C whose similarity(A, C) is less than AS. These ESEs are considered to be potentially unfitting as their similarities with the cluster are below the average similarity of the cluster. (3) for each ESE A obtained in Step (2), we compute its similarities with all current clusters (including the cluster that contains A) and then move it to the cluster with the highest similarity. Note that if A has the highest similarity with the cluster that contains A in the first place, then A will not be moved. The above refining process is repeated until there is no improvement (increase) on the sum of the similarities of all clusters. Based on our experiment, both precision and recall improve by at least 10% by this refining step.
5. CLUSTER ASSIGNMENT In this section we discuss how to assign each cluster to an appropriate concept in a product hierarchy. There are two motivations for performing this step. First, by assigning a cluster to
an appropriate concept, we can use the concept to name the cluster. This can be useful for summarizing the result of the clustering. Second, cluster assignment can serve as a mechanism to adjust the initial clusters based on the concepts preferred by an application. Clusters formed using the algorithm described in Section 4 are natural clusters independent of any specific applications. A particular application may sometimes require the merge of some basic clusters into a single cluster. For example, suppose by using the clustering algorithm described in Section 4, a cluster for “insurance” and a cluster for “investment” have been generated. But a particular application is interested in clusters corresponding to higher-level concepts such as “financial service” (e.g., the concept hierarchy for the application does not have concepts “insurance” and “investment” but only “financial service” and other high-level concepts). Through the process of assigning basic clusters to appropriate concepts in a given concept hierarchy and merging the clusters assigned to the same concept, application dependent clusters may be generated from application independent clusters. To assign clusters to the concepts of a given product hierarchy, we first automatically generate a description for each cluster and a description for each concept in the hierarchy, and then match the descriptions. The details are presented below. The description of a cluster consists of the form terms and the regular terms that appear in the ESEs of the cluster. The weight of a term t in the description is computed as follows. Let cf be the cluster frequency of t (the number of clusters that contain t), sf be the search engine frequency (the number of ESEs in the cluster that contain t) and tf be the term frequency (the number of occurrences that t appears in the ESEs of the cluster). Intuitively, the weight of the term representing a cluster should be an increasing function of sf and tf, and a decreasing function of cf. The weighting formula used in our implementation is (0.5 + 0.5 * tf / max_tf) * (0.5 + 0.5 * sf / max_sf) * log (N/cf), where max_tf and max_sf are the maximum tf and the maximum sf for all terms in the cluster respectively, and N is the number of clusters. In summary, the description of a cluster is a vector of terms with weights. The description of a concept in the hierarchy is also a vector of terms with weights and it is generated automatically using the method described in [12]. It contains all terms that appear in the concept as well as in its immediate child concepts. The weight of a term representing a concept is computed by the standard tf*idf formula with tf being the number of occurrences that the term appears in the concept and its child concepts, and idf being the inverse of the number of concept descriptions that contain the term. During the assignment of an ESE cluster, the similarity between the description of the cluster and the description of each concept is computed using the Cosine function, and the cluster is assigned to the concept with the maximum similarity.
6. EXPERIMENTS 6.1 Testing Samples The testing samples used in our experiments are selected from Yahoo directory. Yahoo has collected many homepages and classified them into different categories. To concentrate on ecommerce applications, we chose the category “Business and Economy-> Shopping and services” which has about 70
subcategories. We examined the 11 largest subcategories among the 70 subcategories and selected 8 that contain most ESE interface pages (many of those classified homepages do not contain search engines). The 8 subcategories are listed in Table 2. Among the 8 groups of ESEs, there are 7 tangible groups and they are: automotive, book, food and drink, consumer electronics, travel and transportation, music, health and pharmacy, and an intangible group (financial service). The group Travel and Transportation is considered to be tangible because of its various products with physical appearance such as hotel rooms and tour facilities. All together, 270 ESE interface pages are obtained from these groups. After child/logical ESE interfaces are identified (see Section 2), 294 ESEs are obtained.
generated by the algorithm, then the precision is 4/5 or 80% as ESE c is incorrectly assigned. 2)
r=
Table 2. Sample selection (as of 03/09/2002) Yahoo Category Name Travel & Transportation Health& Pharmacy Financial Services Food & Drink Automotive Consumer Electronics Books Music Total
# of pages collected by Yahoo 94725
Rank of popularity 1
# of Samples (Before processing)
# of Samples (After processing)
51
58
47531
3
34
34
45825
4
40
40
26821 26190
5 6
23 14
23 18
10073
8
31
32
8390 7205
9 11
41 36 270
45 44 294
In order to test the stability and scalability of our clustering algorithm, the 294 ESE interfaces are first randomly divided into 3 groups of sizes 108, 95 and 91, respectively. Based on these groups we created three test sample sets of various sizes (108, 203 and 294). The first sample set is based on the first group of ESEs and each subsequent sample set is created by adding the ESEs in the next group to the previous sample set. For example, the second sample set with 203 ESEs contains the 108 ESEs in the first sample set and the 95 ESEs in the second group. The concept hierarchy used in this paper for cluster assignment is a portion of the Yahoo hierarchy rooted at “Shopping and Services”. 8 categories under the root are used and they are Automotive, Books, Consumer Electronics, Financial Services, Food and Drink, Health, Music, Travel and Transportation (same as those described in Table 2). These categories/concepts have 31, 11, 20, 15, 41, 46, 20 and 42 child categories/concepts, respectively, and these child concepts are used to help obtaining the description of each parent concept.
6.2 Evaluation Criteria Before evaluation, all ESEs are manually grouped based on what products they sell. Clusters obtained by the manual clustering are deemed correct and are used as the basis to evaluate our clustering algorithm. The following three criteria are used to measure the performance of clustering. 1)
Precision p: It is the ratio of the number of ESEs that are correctly clustered over the number of all ESEs. Suppose there are 5 ESEs (a, b, c, d, e) and the correct clusters are {a, b} and {c, d, e}, but clusters {a, b, c} and {d, e} are
Recall r: For a given cluster, recall is the ratio of the number of ESEs that are correctly clustered over the number of ESEs that should have been clustered. For example, if a cluster should have 5 ESEs but the clustering algorithm actually group only 3 of them to this cluster, then the recall for this cluster is 3/5 or 60%. The overall recall for all clusters is the average of the recalls for all clusters weighted by the size of each cluster. Specifically, the formula for computing the overall recall is n
∑ (r * N / N), i
i
i=1
where ri is the recall of the i-th cluster, Ni is the number of ESEs in the i-th cluster, N is the total number of ESEs and n is the total number of clusters. 3)
F1 Measure: F1 Measure is to normalize the precision and recall because higher precision is generally sacrificed by lower recall and vice versa. The F1 measure is frequently used in document clustering research [16, 17]. The formula for computing the F1 measure is: F1 = 2*p*r / (p + r), which is high only when both precision and recall are high.
The performance of assigning clusters to concepts is measured by the ratio of the number of correctly assigned clusters over the number of all clusters.
6.3 Result Analysis As discussed in Section 4, our clustering algorithm has two phases. In the first phase, ESEs are clustered into two big groups, the tangible group and the intangible group, based on the number of images/links on each ESE interface. The accuracy of the Phase 1 clustering when the threshold T1 is 30 is shown in Figure 3. The precision, recall and F1 are all above 95%, and keep fairly stable when different sample sets are used. For the largest sample set containing all 294 ESEs, the precision is 97.3% with 4 ESEs misclassified in each group. For the Phase 2 clustering, experiments were carried out first to determine some parameter values. One parameter is the similarity threshold T2 used in the preliminary clustering step and the others are the weights for combining the similarities based on different types of terms (price terms, form terms and regular terms, see Formula (1)). The largest sample set (i.e., the set with 294 ESEs) is employed for finding out the best parameter values using a simple hill-climbing method. For the tangible group, the best weights are W1=2 for regular terms, W2=7 for form terms and W3=1 for price terms. Since the intangible group does not use price terms, we simply set W3=0 for this group and keep W1=2 and W2=7. In addition, the best value for parameter T2 is 0.8. Based on these parameter values, the experimental results on the sample set with 294 ESEs are: precision 94%, recall 93% and F1 measure 93%. Note that the above weight values used for different types of terms confirm our belief that form terms are critically important for accurately clustering ESEs.
Phase1 Clustering Performance
Value 1.00
0.90
Pre ci si on Re cal l F1
0.80
0.70
S am pl e S i z e
0.60 108
203
294
Figure 3. Clustering performance of phase 1 Based on the best parameter values obtained above, the clustering algorithm is applied to all sample sets. The performance ranges from 86% to 94% for precision, 88% to 93% for recall, and 87% to 94% for F1 measure (see Figure 4).
We also compared the performance of our ESE clustering method with that of a normal document clustering method. The normal method still uses all terms like our method does except that it treats all types of terms (price terms, form terms and regular terms) the same, i.e., the same weight is assigned to price terms, form terms and regular terms. The result is shown in Figure 5. As can be seen from the figure, our ESE clustering algorithm performs much better than the normal clustering method. Specifically, our ESE clustering algorithm performed 25% better for precision and 26% better for recall, and 24% better for the F1 measure. This once again indicates the importance of form terms in ESE clustering. Moreover, we carried out experiments to evaluate the impact of various features on the performance of our clustering algorithm. To find out the impact of a particular feature, we compare the performance when the feature is used with that when the feature is not used. The results are summarized below. 1.
Images/links. When Phase 1 of our clustering algorithm is not performed (i.e., only Phase 2 is applied to all ESEs), the precision of the algorithm decreases by 9%, the recall decreases by 10% and the F1 measurement decreases by 10%. This clearly indicates the effectiveness of using the number of images/links on an ESE interface to divide the ESEs into the tangible group and the intangible group.
2.
Different types of terms. The results are reported in Table 3. It can be seen that form terms are the most important in achieving good clustering performance. Also, regular terms appear to be slightly more important than price terms. This may not completely reflect the real significance of price terms for the following two reasons. One is that there are usually more regular terms than price terms so collectively regular terms play a larger role than price terms. The second reason is that price terms are not used for the intangible group.
We also evaluated the performance of the algorithm for assigning clusters to concepts in the concept hierarchy. Assignment correctness is above 90% and keeps reasonably stable (see Figure 4). Clustering and Assignment Performance
Value 1.00
Pre cision
0.90
Re call 0.80
F1
0.70
Assigne me nt C orre ctne ss
Sample Siz e
0.60 108
203
294
Figure 4. Clustering and assignment performance Value
Comparison With Normal Document Clustering
1
ESEs Clustering
0.9
Normal Document Clustering
0.8 0.7 0.6 0.5
Precision
Recall
F1 Measure
Criteria
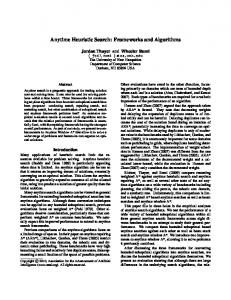
Figure 6(a). The GUI of WISE-Cluster
Figure 5. Comparison with normal document clustering
Table 3. Effectiveness of content-based features Tests Optimal No Price Term No Regular Term No Form Term
Weight Values W1=2, W2=7,W3=1 W1=2, W2=7,W3=0 W1=0, W2=7,W3=1 W1=2,W2=0,W3=1
Precision
Change
Recall
Change
F1 Measure
Change
0.94 0.89 0.86 0.61
-5.07% -8.27% -34.94%
0.93 0.89 0.85 0.61
-4.50% -8.80% -34.55%
0.93 0.89 0.86 0.61
-4.79% -8.00% -34.74%
10. REFERENCES
Figure 6(b). The GUI of WISE-Cluster
7. IMPLEMENTATION We have implemented the WISE-Cluster in Java and the GUIs are shown in Figures 6(a) and 6(b). Users can feed in the ESE interface pages to WISE-Cluster. Each ESE interface page may contain one or more search forms. The tool automatically extracts all forms contained in each interface page, links/images, prices and regular terms as we mentioned in Section 3.2. For each form, it extracts labels and form elements and then uses some heuristics to select the appropriate search forms. If two or more search forms are selected from an ESE interface page, each selected search form is considered as a separate ESE. Then WISE-Cluster constructs the four feature vectors for each ESE. Based on these four features, WISE-Cluster begins to group ESEs into different clusters. Once the clustering is done, WISE-Cluster generates the cluster description for each cluster. Then it assigns each cluster to the corresponding concept in the given product concept hierarchy through comparing the similarity between the cluster description and the given product concept description. The cluster assignment is shown in Figure 6(b).
8. CONCLUSIONS In this paper, we studied the problem of clustering e-commerce search engines. The proposed clustering method has several special features. First, unlike existing search engine categorization approaches, it does not require queries to be submitted to search engines. Second, unlike existing document and Web page clustering techniques, it emphasizes features unique to e-commerce search engines such as form terms and price terms in additional to regular terms and the number of images/links. Different types of ecommerce search engines were analyzed and experiments were carried out based on close to 300 real e-commerce search engines. Experimental results indicate that the proposed method is effective but has room to improve. One possible improvement is to have a finer-grained representation model of ESE interfaces. For example, the form terms may be further divided into two subsets with one for attribute labels/names and the other for attribute values. Intuitively, attribute labels are more important than attribute values.
9. ACKNOWLEDGEMENTS This work is supported in part by the grants IIS-0208574 and IIS0208434 from the National Science Foundation.
[1] A. Broder, S. Glassman, M. Manasse. Syntactic Clustering of the Web. Sixth Int'l. World Wide Web Conference, World Wide Web Consortium, Cambridge, 391-404, 1997. [2] J. Cope, N. Craswell, and D. Hawking. Automated Discovery of Search Interfaces on the Web. Fourteenth Australasian Database Conference, Adelaide, Australia, 2003, pp.181-189. [3] R. B. Doorenbos, O. Etzioni and D. S. Weld. A Scalable Comparsion-shopping Agent for the World-wide Web. In Proc. of the First International Conference on Autonomous Agents, pp.l39-48, 1997. [4] B. He and K. Chang. Statistical Schema Matching across Web Query Interfaces. ACM SIGMOD Conference, 2003. [5] B. He, T. Tao, and K. Chang. Clustering Structured Web Sources: a Schema-based, Model-Differentiation Approach. International Workshop on Clustering Information over the Web, Crete, Greece, March 2004. [6] H. He, W. Meng, C. Yu, and Z. Wu. WISE-Integrator: An Automatic Integrator of Web Search Interfaces for ECommerce. VLDB Conference, 2003. [7] H. He, W. Meng, C. Yu, and Z. Wu. Automatic Extraction of Web Search Interfaces for Interface Schema Integration. WWW Conference, poster paper, pp.414-415, May 2004. [8] P. Ipeirotis, L. Gravano, M. Sahami. Probe, Count and Classify: Categorizing Hidden-web Databases. ACM SIGMOD Conference, May 2001. [9] T. Joachines. Text Categorization with support vector machines: Learning with many relevant features. ECML-98, 137-142, Springer, 1998. [10] D. Koller and M. Sahami. Hierarchically classifying documents using very few words. 14th International Conference on Machine Learning, 1997. [11] J. MacQueen. Some Methods for Classification and Analysis of Multivariate Observations. Pro. of the Fifth Berkeley Symposium on Mathematical Statistics and Probability, vol. I, University of Califorula, 1967, pp. 281-297. [12] W. Meng, W. Wang, H. Sun, C. Yu. Concept Hierarchy Based Text Database Categorization. Journal of Knowledge and Information Systems, 4(2), 2002, 132-150. [13] M. Perkowitz, R. B. Doorenbos, O. Etzioni and D. S. Weld. Learning to Understand Information on the Internet: An Example-Based Approach. Journal of Intelligent Information Systems, 8(2):133-153, 1997. [14] G. Salton and M. McGill. Introduction to Modern Information Retrieval. McGraw-Hill, 1983. [15] W. Wu, C. Yu, A. Doan, and W. Meng. An Interactive Clustering-based Approach to Integrating Source Query interfaces on the Deep Web. ACM SIGMOD Conf., 2004. [16] Y. Yang, S. Slattery and R. Ghani. A study of approaches to hypertext categorization. Journal of Intelligent Information Systems, 18(2), March 2002. [17] Y. Yang. A Study on Thresholding Strategies for Text Categorization. ACM SIGIR Conference, September 2001, New Orleans, Louisiana. [18] C. Yu and W. Meng. Principles of Database Query Processing for Advanced Applications. 1998, Morgan Kaufmann. [19] O. Zamir and O. Etzioni. Web Document Clustering: A Feasibility Demonstration. ACM SIGIR Conference, 1998.