Technical Report TR02-030 Department of Computer Science Univ of North Carolina at Chapel Hill
3D Sliders: Programming Uses for 3D Object Warping in Collaborative Virtual Environments
David Stotts
Dept of Computer Science Univ. of North Carolina at Chapel Hill Chapel Hill, NC 27599-3175
[email protected]
June 1, 2002
1
3D Sliders: Programming Uses for 3D Object Warping in Collaborative Virtual Environments David Stotts Dept. of Computer Science Univ. of North Carolina at Chapel Hill Chapel Hill, NC 27599-3175 USA 1-919-962-1833
[email protected]
We have been experimenting with one method for presenting this subtle information to the users of a CVE. We have also gone beyond the CVE and are developing these warping methods as generic 3D UI technology, applicable in many different programming situations.
Abstract We present extensions to research done at UNC in 3D object warping for collaborative virtual environments (CVEs). 3D objects are dynamically distorted in various ways to give visual cues to the users of a CVE about the actions that are being applied to the objects. Some warps occur with single-user actions; others happen when several users interact with one object collaboratively. We generalize the object warping methods to define 3D user interface techniques we generically call 3D sliders, meaning 3D objects that can be used to inject control information into programs. Unlike sliders in 1D, where the graphical image presents an analog to a physical control, we generalized the notion in both dimensions and in format/style. We do 3D sliders by warping the original object shapes, allowing their forms to retain their original representational value as well. The result is more than 3 degrees of control freedom in 3-space.
In the remainder of this paper, we first present a summary of the various visual cues we have developed for 3D object warping, and a discussion of their use in the collaborative environment MUVEE (Multi-User Virtual Environment Editor). We then present applications of these ideas in program control. We conclude with a section of related work.
1. Introduction Collaborative virtual environments (CVEs) are multi-user distributed systems in which several users share a 3D virtual space. The interactions among users can cause conflicts, and it may be difficult to convey to the users involved exactly what the conflicts are. For example, in a 3D environment where users can grasp and move objects, if two users grasp the same object simultaneously the system must decide what should happen visually to cue the users. Should one user be given the object and the other denied? Should both be denied and the object frozen until one lets go? If the object is frozen in place, how will the users know that the system has not simply suffered a software failure? This kind of information arises from subtle user interactions, so does not have to be communicated in a single user system.1 Consequently, techniques for conveying these subtle interface cues are largely absent from current UI technology.
1
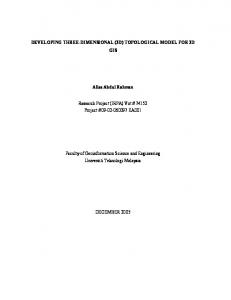
Figure 1. 3D space rendered in MUVEE
2. Summary of Object Warping Visual Cues Our current approach to conveying subtle user interaction cues is to visibly animate the 3D objects in different ways as the users affect them. The animation method we are currently studying is a 3D adaptation of real-time shape warping for drawing interfaces [1]. We have built a prototype system called MUVEE (Multi-User Virtual Environment Editor) to embody these warping operations for experimentation. MUVEE is a multi-user distributed system that allows several different people to create
We should note that these problems arise whether or not the VE users have avatars (visible representations; in most current VEs, avatars are very simple, unarticulated forms, so a user may see in a gross way the presence of another user near an object, but may not see a moving or pinching hand to indicate grasping.
2
and modify 3D objects in a shared virtual space. The objects are warped as users grasp, move, scale, and rotate them. MUVEE was originally built with the Inventor graphics toolkit and has been moved to OpenGL; it is functionally quite simple. Users are able to instantiate several basic shapes (sphere, cone, square), move them around in 3-space, scale and rotate objects, and delete objects. The space is shared, meaning several users are able to do this concurrently. Two users are able to simultaneously grasp an object, leading to the need for communicating information about conflicting interactions. We approach this and other problems by warping the 3D objects in different ways.
Objects can be either pulled or pushed (as in Figures 3 and 4); when mouse movement stops, the lagging portions of the moving object "catch up" with the grasped point and the object "snaps back" to its un-warped shape.
Figure 1 shows the MUVEE viewing screen, with 4 cubes displayed. This is the view one user would have. Other users would have different views of the space, depending on eye point and direction of view. Figure 3. Pushed in center
We next explain four direct manipulation operations for objects in MUVEE: translation, scaling, rotation, and pinning. We also describe the tug of war effect, used to supply additional information for users interacting simultaneously with the same object.
2.1 Translation Figure 2 shows a 3D direct manipulation move operation on a cube2. The figure shows the move operation with animation, where the one vertex of the cube stays attached to the mouse point while the bulk of the object lags slightly behind. This animation gives the effect of manipulating a heavy ``rubbery'' object that distorts as it is pushed and pulled. Although the effect does not correspond exactly to a physical model, this simple algorithm gives the impression that the shape is made of elastic material, with weights attached to the vertices, causing them to lag behind the movement.
Figure 4. Pulled out center
2.2 Scaling and Rotating The animation effects described above for translation are also effective when used in conjunction with other common direct manipulation operations. For example, Figure 6 illustrates a 3D operation to make an object smaller by scaling. As in the translation example, during the animated version of the scale operation, the part of the object ``grasped'' is controlled by the user, while the bulk of the object lags behind. An animation effect pulls out the un-grasped vertices of the cube (or, really, pulls in the sides while the vertices lag). A complementary animation effect is used in 3D scaling to make an object larger.
Figure 2. Animating a move operation on 3D graphics object
The grasped point, however, need not be a vertex, but in fact may be any point on the surface of the object.
2 Many of the figures used in this paper for depicting the 3D animation effects have a wire frame drawing of the effect in their left diagram and a solid rendered drawing in their right diagram. The two diagrams in the figures are identical graphical models; they have just been rendered with two different techniques.
Figure 5. Animating a 3D Rotate effect
3
provides extra information: it makes it clear that the user is attempting to move the object, but that the attempt is not succeeding. When the grasped point is released, the object springs back to its original shape.
Figure 5 shows a 3D operation to rotate an object about its center. Once again the animation effect is to have the object lag behind so as to give the illusion that the object has inertia.
Figure 7. Extreme 3D Pin effect
2.4 Tug of War Collaborative systems are required to provide visual cues when multiple users are simultaneously manipulating a particular data object. The tug-of-war effect shown in Figure 8 depicts a form of visual feedback when two users are attempting to move an object simultaneously. A user first grasps an object. Once a second user grasps the same object it stops moving. While the two users attempt to move the object, the grasped corners of the object are stretched out demonstrating that neither user has full control of the object.
Figure 6. Animated Scale-down effect
2.3 Pinning The pinning animation is used to supply simple visual constraining effects that can convey extra information for direct manipulation operations. Consider an attempt to move an object that is fixed in place -- i.e. pinned. One response to this attempt might simply be to prevent the object from following the mouse. However, this lack of visible feedback might be misinterpreted as the result of a failure to ``grasp'' the object correctly. A user might make several attempts at the operation before realizing the true cause of the lack of response.
Figure 8. Two users… Tug of war effect
We have a snap-copy mode in MUVEE that can come into play in tug-of-war. If one of the users is persistent and warps the object extremely it will "snap in two", essentially causing an object copy. The motion that causes this split can be a fast, snapping mouse motion, or a long stretch past a virtual "breaking point." Our system allows this feature to be turned on or off, according to the needs of the modeling situation. It can be a bit annoying to have object copies pop up in situations were copies make no sense.
Another strategy might be to allow the object to follow the mouse, but then to snap it back to its original place when released. This approach avoids the problem with lack of feedback, but can lead to surprises when a carefully placed object suddenly jumps back to a previous position. A single frame of a 3D pinning animation effect is shown in Figure 7. This figure shows an animation effect that avoids both problems. As the user attempts to drag the pinned object, the grasped point stays attached to the mouse but the bulk of the object stays fixed. The effect is as if the user is pulling on a corner of an object that is anchored in place. The feedback
4
execution progresses shows if the strain is increasing or decreasing.
3. 3D Sliders for System Visualization In this section we present the concepts and design of an experimental system for dynamically reconfiguring distributed systems using 3D virtual environments and warping 3D sliders. The work merges our previous research in collaborative VEs with previous work in language-based tools for automated generation and reconfiguration of distributed systems (Polylith [3]).
As the process network executes, as traffic patterns change, as the processes become "loaded", performance will change. As a process is loaded to the point where it is "falling behind" its collaborators, MUVEE starts to warp its corresponding object in the shared VE space. The more warped an object becomes, the more extreme is its execution status with respect to "normal." This loading might come from a slow host being unable to flush a message buffer as fast as the senders fill it, for example.
There are several ways in which MUVEE can be used in the general context of configuring and reconfiguring distributed systems. First, it can provide a unique and especially rich visualization for a system's current configuration and performance characteristics. A 3D world for MUVEE is generated along with the system, and execution measurements made constantly so MUVEE reflects the system's performance in the visual appearance of the VE. Objects change their shape, color, size, relative spacing, etc. to indicate changes in the absolute and relative relationships among the processes.
The 3D interactive VE gives users a quick, holistic picture of the entire system. A nicely behaving system will look mostly unwarped. Temporary performance variability will be expressed by minor warping that appears and disappears over time. When a system develops more serious trouble the warping will become more pronounced, more long-lived, perhaps even more widespread, affecting more objects as trouble in some processes begin to create chain-reaction problems in other processes. This approach assumes we are specifying initial configurations in some MIL notation and that the MUVEE world is generated along with the system. Another way to exploit MUVEE-based visualization is to generate initial configurations from a manually constructed virtual world. MUVEE can be used to layout the components of a distributed system and the relationships among the components; then the appropriate MIL specs can be generated from the virtual world. We are exploring both approaches.
Secondly, it provides a means for a user to feed control information back into an executing system. The performance of a system can be "tweaked" by generated it with internal instrumentation, or hooks, that communicate with MUVEE. A user manually and directly manipulates objects in the MUVEE world and has related execution characteristics of the processes change as a result of the object warps. Finally, it provides a means of dynamically restructuring the configuration of the processes and hosts in a distributed system. Users directly manipulate objects in the MUVEE world and have the supporting Polylith toolbus alter the number, interconnections, and host placements of the processes comprising the system. This restructuring is termed “dynamic reconfiguration.”
3.3 System control feedback We use our same warping techniques to inject configuration and performance control information back into a system. Rather than simply viewing the objects in the MUVEE world, we allow the user to manipulate them as well. Consider an object in the MUVEE world that is warped; the warped shape will be pointing in the direction of the process that is generating the traffic. One object may even be warped in several directions (like in the tug-of-war operation above), indicating that it is receiving surplus traffic from several different processes. Let's call the warped object (representing the slow process) S, and call the traffic-generating object T.
3.1 Configuration visualization via warping MUVEE can be used to present a snapshot to a user of the configuration and performance of executing software. When a distributed system is generated from our modified Polylith system, we create a MUVEE world (CVE) representing several physical aspects of the system configuration. The objects in the VE have different shapes and colors to indicate different process properties, and they are arranged spatially to show the network connections set up among the processes.
The user can grasp the T object and drag it back towards the S object. This will visually warp T somewhat, and it will also send a message to the T process to slow down. The resulting drop in traffic to the S process will cause the S object to lose some warp as it catches up. The more the user warps T, the more it will slow down. Releasing the T object will cause the T process to resume normal performance.
There are numerous ways to map warp operations onto system/program properties, enabling visualization and control feedback. One source of system loading, for example, is a shortage of resources on the host platform for a process. A shortage of CPU cycles, memory, or disk space could all be possible sources of performance degradation. The users on the other systems in a distributed configuration do not care why there is a slowdown, but only that there is a slowdown. A warping visual effect via scaling or rotation can be employed to highlight this fact. The previous Figure 5 and Figure 6 show examples of how an object representing a system component can be visualized as they move off ideal values for their resource needs. In each case, the inertia and the “rubbery” appearance of the object convey to the viewers the impression that the process in under some strain, and continued warping (slowly perhaps) as
One observes this interesting visual phenomenon: In a certain configuration, the performance of a system of processes causes a rather distorted overall picture, with several warped objects. By further warping some of the normal objects manually, the warped ones will "settle down" and return to a less stressed form. Different warping operations are used for different performance adjustments to the processes. We have already indicated that the pinned warp is used to selectively cut the message transmission rate to one specific process (the one in the direction of the
5
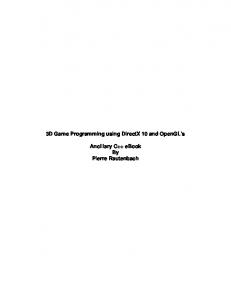
The system controller decides to try to balance the system by slowing down the rate at which C sends messages to A for processing. This is done my back warping C at point X, accomplished by grasping the C object and pulling back the warped corner. Figure 10 shows the effects of the back warp. Since C slows down, A has more time to process messages from B, and the queue from B to A shortens. The queue from C to A shortens (by direct controller intervention). Process A has more idle processor time as well, causing the scaling warp to relax and returning A’s representation back to its normal shape.
warp). The scaling is more general; it will speed up or slow down a process uniformly (i.e., cut the message transmission rate to all other processes).
An Illustration Figures 9 and 10 show an example of this sort of performance visualization and control feedback. Remember that MUVEE is used to build collaborative VEs. In this example, the “collaboration” is between the controller (a human user) and the system under control. Each agent performs warping operations on the 3D representations of system components.
3.4 Dynamic reconfiguration ``Dynamic reconfiguration'' refers to one's implementing changes to a running application. Demand for reliable ways to reconfigure is increasing, as the community seeks to perform maintenance on highly available applications; to tune network applications for best performance; and of course the ubiquity of the Internet means we will increasingly need to interconnect sophisticated resources on the fly in order to solve problems.
Qbc B
C
We now have mechanisms that allow us to reliably change a program in ways unanticipated by the original programmer, but as yet these techniques are not yet fully exploited in the community. The Polylith toolbus allows dynamic reconfiguration, stopping, re-hosting, and re-starting processes according to execution parameters and performance constraints.
Qba X
Qca
A
One barrier to effective reconfiguration has been the difficulty of users being able to adequately see a system's dynamic state. Users cannot apply unprecedented changes to their running application if they are unable to grasp the configuration's current state to know what they're starting with. Similarly, the many types of constraints that affect reconfiguration are typically encoded in a rule base that the user must be familiar with ahead of time.
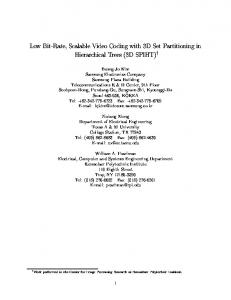
Figure 9. Back warp applied to object C
Qbc B
With MUVEE world, and 3D sliders, users can directly interact with the configuration and state of their running applications. Using virtual haptic responses (the visual warping can actually cause users to sense feedback in their hands), users can gain direct feedback on the suitability of various reconfiguration options. Instead of having to remember constraints and state in one's head, a user can explore options and effect dynamic reconfigurations directly.
C
Qba
X Qca
There are many constraints among the processes and communication paths in a distributed system that can be visualized in this way. Providing visible cues (via object warping) to a user trying to relocate a process, or reallocate resources among processes, can be an effective indicator of the difficulty of doing what is requested; it could also be used to indicate the relative costs of alternative solutions a user develops for a configuration problem.
A
Figure 10. Back warp shortens Qbc and Qba
In Figure 9, a system of 3 processes is represented. B is sending messages to C and A; C is sending messages to A. We represent queue lengths with pinned warps from the nearest corners, so the warping from C towards A represents a lengthening message queue. This suggests that A cannot keep up with processing the traffic C is sending; A’s load is further indicated by the length of the queue from B to A. We represent the amount of idle processor by the scaling warp. Here we see A scaling down, indicating increasing time gone by without idle processor time.
These previously described snap-copy warps are appropriate as a manual way to signal system reconfigurations of different kinds. Pulling an object into two could be a signal for process replication. Manual movement of the new object copy could be used to designate the new host. A host that is already overloaded can signal the inappropriateness of a suggested migration by "pushing back" on the object, visually warping it as the user moved it close.
6
The snap-copy warp is useful in this context. If a user grasps an object and moves it with a “snap”, meaning very rapid short mouse motion, then it initially stretches, but then “breaks” into a copy of the original object. This is useful in modeling because, for example, a river flow model that covers hundreds of miles may have to be connected to dozens of sediment model processes, one for each few thousand yards of river length. Setting this up can be tedious without good interaction features.
4. Federations of Environmental Models Another area in which we are applying 3D sliders is in creation and execution of federations of environmental models. Scientists who study the environment create mathematical models of portions of it, and solve these models to get information that will help with weather forecasting, resource allocation and use, urban/rural planning, and other functions important to society. Currently, environmental science is highly stratified. There are atmosphere modelers, soil modelers, hydrologists, groundwater modelers, marine biologists, and numerous other sub-disciplines under the abstract umbrella of “the environment.” Models in each area often need data from other models in other areas; for example, to get proper results about surface water runoff for a particular region, you need rainfall data that comes from an atmosphere model. Environmental models do not interoperate well; if they do at all, it is with considerable manual programming effort to "knit" them together.
Once the federated model is composed, the MUVEE system allows control of its execution as mentioned in the previous section. Execution visualization causes warping of system components according to the information a user has requested to monitor. These degrees of freedom include queue lengths (or amount of remaining input to be consumed), iteration count (environmental models are solved iteratively), process idle time, and process status.
5. Design pattern matching
With support from the EPA we are developing a software framework [4] for allowing environmental modelers to more easily interconnect several models of different portions of the environment to make a hybrid, federated model. The federated model will give results no individual model component can. In EPA terms, this is "multi-media modeling," where media are soil, air, water, sediment, rock, etc. This is part of a larger EPA effort called MIMS [5].
While we have not begun to implement a 3D slider application for this idea, we are currently doing research in design pattern detection for software architectures [6]. In this project we are developing elemental design patterns – object structures that are fundamental to the manner in which computation is done in OO languages, and from which the larger design patterns of GOF [7] can be composed, as well as other patterns from the software engineering literature. The elemental patterns are expressed in an extension to sigma-calculus, and we are developing tools that use this formalism to make inferences about program structure to find the patterns used in their architecture.
Our current system consists of an interconnection layer and runtime controller written in Haskell; a metadata specification component in XML; and component environmental models for system testing, including river sediment models, watershed models of the Neuse river basin, hydrology models for the Neuse, and urban storm water runoff models.
The output of the pattern-finding tools in not expressed as certainty. Rather, they report percentage estimated of how close various program structures are to matching design patterns. We think this is a good application for 3D sliders. A MUVEE representation of the system architecture, in terms of patterns, can be built, with the pattern shapes warped in different ways to represent • how far off the ideal is the code itself • what aspects of the code are failing to match the pattern ideals
We are currently constructing an interface that will allow environmental scientists to construct federated models without having to be Haskell or XML programmers. One component of this interface is based on MUVEE and 3D sliders. We represent each model that can participate in a federation as a shape in a 3D collaborative environment – ovoid for atmosphere, cube for hydrological and water models, rectangle for land use and terrestrial models, etc.
This is still early work and we will not have this MUVEE application for experimentation for another 6 months we expect.
Information about each model component (its name, source language, source code, parameters required, information produced, documentation) is available hypertextually by clicking on its representation. When a user tries to attach two components together, their affinity for each other (are the source languages compatible, are the input/output streams compatible, are the modeling domains compatible) is shown by the input and output ports warping towards each other when they are in proximity. Full compatibility will cause touching. If incompatible input and output streams are to be joined, the user must manually warp one object towards another; this causes the system to invoke a template for creation of a Haskell data filter function; the user can select an appropriate one from a palate of existing filters, or can write a new one for the occasion and add it to the palate.
6. Related Work Projects directly related to our work are scare, in that we have combined Virtual Environment graphics with distributed system toolkits to create collaborative VEs. Some work has been done on visualization of process networks, but our 3D VE approach is unique as far as we can determine. In addition to Polylith [3], on which we have built MUVEE, there are numerous other projects that have investigated specification languages and support systems for constructing distributed networks of processes [8,9,10,11,12,13]. Several projects have explored distributed (and collaborative) virtual environments in general [14,15,16,17,18,19], but none have applied VE modeling to and manipulation to the configuration of distributed systems themselves. These projects are mostly 7
stand-alone systems that have explored basic DVE concepts of object model interchange, networking performance, and underlying application-level protocols.
[8] Barbacci, M., D. Doubleday, C. Weinstock, and J. Wing, “Developing applications for heterogeneous machine networks: The Durra environment,” Computing Systems, 2, 1989, pp. 7-35.
In the area of user interfaces, use of graphical objects as program control is limited mainly to 1D (sliders, wheels, buttons, etc.) and 2D (2D sliders, joysticks, touch screens, etc.). Our work on 3D sliders seems novel in this respect.
[9] Wilden, J., et al., “Specification-level interoperability,” Communications of the ACM, 34, May 1991, pp. 72-87. [10] Habermann, N, and D. Notkin, “Gandalf: Software development environments,” IEEE Trans. on Software Engineering, 12(12), Dec. 1986, pp. 1117-1127.
The warping work on which we build was first developed jointly with B. Thomas [20] in a project that extended his earlier work on animations in 2D user interfaces for drawing tools [1,21]. That work has been further extended into collaborative windows application in general [22].
[11] Hayes, R., S. Manweiler, and R. Schlicnting, “A simple system fr constructing distributed, mixed-language programs,” Software – Practice and Experience, 18, Jul. 1988, pp. 600-641. [12] Magee, J., J. Kramer, M. Sloman, “Constructing distributed systems in Conic,” IEEE Trans. on Software Engineering, 15, Jun. 1989, pp. 663-675.
The use of 3D in user interfaces is well established, especially to visualize data structures. Cone trees use 3D cones to show trees in a form that can be manipulated for different viewpoints [23]. Fisheye views [24] distort, or enlarge, areas of a complex object so that regions of focus or interest are enlarged, and other regions de-emphasized; this has been applied in many areas, including groupware [25] and the Web/hypermedia [26,2]. Haptic feedback is a well-established technique in VE use for physical processes [27,28]; warping as we present it here provides some similar feedback but without the need for forcegenerating devices.
[13] Notkin, D., A. Black, and E. Lazowska, “Interconnecting heterogeneous computer systems,” Communications of the ACM, 31, 1988, pp. 258-273. [14] Carlsson, C., and O. Hagsand, “DIVE – A platform for multi-user virtual environments,” Computers and Graphics, 1993, pp. 663-669. [15] Funkhouser, T.A., “Ring: A client-server system for multiuser virtual environments,” Computer Graphics: Proc. of SIGGRAPH ’95, April 1995, pp. 85-92.
Acknowledgements
[16] Funkhouser, T.A., “Network topologies for scalable multiuser virtual environments,” Proc. of IEEE VRAIS ’96, April 1996.
This research is supported in part by the United States Environmental Protection Agency under grant #R82-795901-3, and by the National Science Foundation under grant #9732577.
References
[17] Macedonia, M.R., M.J. Zyda, D.R. Pratt, D.P. Brutzman, and P.T. Barham, “Exploiting reality with multicast groups: A network architecture for large-scale virtual environments,” Proc. of IEEE VRAIS ’95, 1995, pp. 2-10.
[1] Thomas, B.H., and P.R. Calder, “Animating direct manipulation interfaces,” Proc. of UIST ’95, ACM, Nov. 1995, pp. 3-12.
[18] Singh, G., L. Serra, W. Png, A. Wong, and H. Ng, “Sharing object behaviors on the net,” Proc. of IEEE VRAIS ’95, 1995, pp. 19-25.
[2] Muchaluat, D.C., R.F. Rodrigues and L.F.G. Soares, “WWW Fisheye-View Graphical Browser,” Proc. of the 1998 MultiMedia Modeling, Lausanne, Oct. 1998, IEEE.
[19] Wang, Q., M. Green, and C. Shaw, “EM: An environment manager for building networked virtual environments,” Proc. of IEEE VRAIS ’95, pp. 11-18.
[3] Purtilo, J., “The Polylith software bus,” ACM Trans. on Programming Languages and Systems, Jan. 1994, pp. 151-174.
[20] Thomas, B.H., D. Stotts, and L. Kumar, “Warping Distributed Systems Configurations,” Proc. of 4th International Conference on Configurable Distributed Systems, Annapolis, Maryland, USA, May 1998, pp. 136-144.
[4] Alperin, M., J. Bowen, D. Herington, and D. Stotts, “A Coupled Water Column-Sediment Biogeochemistry and Hydrodynamic Model for the Neuse River Estuary," 2001 Annual North Carolina Water Resources Research Conference, Mar. 2001, Raleigh NC.
[21] Thomas, B.H., P. Calder, and V. Demczuk, “Experiments with animating direct manipulation in a drawing editor,” ACSC'98 - The 21st Australasian Computer Science Conference, Perth, Australia, Feb. 1998, pp. 157-168.
[5] US Environmental Protection Agency, “MIMS: Multimedia Integrated Modeling System,” web site http://www.epa.gov/asmdnerl/mims/
[22] Davies, M.L., and B.H. Thomas, “An animated 3D manipulator for distributed collaborative window-based applications,” Australasian User Interface Conference 2001 Australian Computer Science Communication, vol. 23, IEEE, 2001, pp. 116-123.
[6] Smith, J.M., and D. Stotts, “Elemental Design Patterns: A Link Between Architecture and Object Semantics,” Tech. Rep. #TR02-011, Dept. of Computer Science, Univ. of North Carolina, Chapel Hill, March 2002, http://rockfish-
[23] Robertson, G., J. Mackinlay, and S. Card, “Cone trees: Animated 3D visualization of hierarchical information,” Proc. of Computer-Human Interaction '91, pp. 189-194, 1991.
cs.cs.unc.edu/pubs/TR02-011.pdf [7] Gamma, E., R. Helm, R. Johnson, J. Vlissides, “Design Patterns: Elements of Reusable Object-Oriented Software,” Addison Wesley, 1995.
[24] Furnas, G., “Generalised Fisheye Views,” Proc. CHI 86, ACM, 1986, pp. 16-23.
8
visualization,” Computer Graphics: Proc. of SIGGRAPH ’90, vol. 24, Aug. 1990, pp. 177-185.
[25] Greenberg S., C. Gutwin, and A. Cockburn, “Sharing fisheye views in relaxed-WYSIWIS groupware applications,” Proc. of Graphics Interface, Toronto, May 1995, pp. 28-38.
[28] Mark, W., S. Randolph, M. Finch, J. Van Verth and R.M. Taylor II, “Adding force feedback to graphics systems: Issues and solutions,” Computer Graphics: Proceedings of SIGGRAPH '96, Aug. 1996, pp. 447-452.
[26] Tochtermann, K., and G. Dittrich, “Fishing for clarity in hyperdocuments with enhanced fisheye-views,” Proc. of ACM Conference on Hypertext, Milano, Italy, 1992, pp. 212-221. [27] Brooks, F.P., M. Ouh-Yound, J.J. Batter, and P.J. Kilpatrick, “Project Grope: Haptic displays for scientific
9