Hindawi Publishing Corporation Mathematical Problems in Engineering Volume 2014, Article ID 953476, 8 pages http://dx.doi.org/10.1155/2014/953476
Research Article A Block-Based Regularized Approach for Image Interpolation Li Chen,1,2 Xiaotong Huang,1,2 and Jing Tian1,2 1 2
School of Computer Science and Technology, Wuhan University of Science and Technology, Wuhan 430081, China Hubei Province Key Laboratory of Intelligent Information Processing and Real-Time Industrial System, Wuhan University of Science and Technology, Wuhan 430081, China
Correspondence should be addressed to Li Chen;
[email protected] Received 1 November 2013; Accepted 27 December 2013; Published 11 February 2014 Academic Editor: Yi-Hung Liu Copyright © 2014 Li Chen et al. This is an open access article distributed under the Creative Commons Attribution License, which permits unrestricted use, distribution, and reproduction in any medium, provided the original work is properly cited. This paper presents a new efficient algorithm for image interpolation based on regularization theory. To render a high-resolution (HR) image from a low-resolution (LR) image, classical interpolation techniques estimate the missing pixels from the surrounding pixels based on a pixel-by-pixel basis. In contrast, the proposed approach formulates the interpolation problem into the optimization of a cost function. The proposed cost function consists of a data fidelity term and regularization functional. The closed-form solution to the optimization problem is derived using the framework of constrained least squares minimization, by incorporating Kronecker product and singular value decomposition (SVD) to reduce the computational cost of the algorithm. The effect of regularization on the interpolation results is analyzed, and an adaptive strategy is proposed for selecting the regularization parameter. Experimental results show that the proposed approach is able to reconstruct high-fidelity HR images, while suppressing artifacts such as edge distortion and blurring, to produce superior interpolation results to that of conventional image interpolation techniques.
1. Introduction Image interpolation aims to render a high-resolution (HR) image by estimating the missing pixel information from the surrounding pixels of the observed low-resolution (LR) image. This image processing task is commonly referred to as image interpolation (when only a single LR image is available) or superresolution (when multiple LR images are available) [1– 4]. It has a wide range of applications such as computational photography and video surveillance. The challenge of image interpolation is to enhance the image quality while suppressing artifacts such as blurring and jagged edges. Various algorithms have been developed to address image interpolation over the years. Conventional piecewise polynomial techniques, such as bicubic interpolation, assume higher-order continuity of image intensity in the spatial domain. These techniques, however, often lead to oversmoothness in the edge and textured regions. Some edge-directed approaches adjust the algorithmic parameters according to the local features. The HR local covariance coefficients are estimated from the LR counterpart based on their geometric duality [5]. For example, inverse gradient has been employed to determine the weights of bicubic
interpolation. Different edge types are identified and used to determine different interpolation strategy for local image area [6–10]. The edge-directed interpolation is tuned based on the covariance. Other methods, including fuzzy-based [11], PDEbased [12], and regression-based method [13], have also been reported in color image interpolation and superresolution. These adaptive methods typically employ heuristic reasoning to estimate parameters such as threshold values or filter weights on a pixel-by-pixel basis. Therefore, they require extra computation to determine these local parameters, and the quality of the interpolated images may vary significantly with respect to changes in these parameters. The aforementioned deterministic image interpolation approaches cannot suppress the noise or blurring incurred in the input lowresolution image. In view of this, a block-based regularized image interpolation approach is proposed in this paper by imposing the regularization constraint on the reconstructed highresolution image. The relationship between the HR and LR images is exploited to formulate the interpolation problem as the optimization of a cost function. The cost function consists of a data fidelity term and Tikhonov regularization functional [14]. The closed-form solution to the optimization
2
Mathematical Problems in Engineering
problem is estimated using a new framework of constrained least squares minimization, Kronecker product, and singular value decomposition (SVD). A key feature of the method is its computational efficiency in reconstructing high-fidelity HR image, while alleviating common artifacts encountered by other interpolation techniques. This allows the proposed method to be employed readily in the areas of digital photography, computer vision, and medical imaging, among others. The rest of this paper is organized as follows. Section 2 provides the mathematical formulation on the image interpolation. In Section 3, the proposed regularized image interpolation approach is presented, which is further evaluated in experimental results presented in Section 4. Finally, Section 5 concludes this paper.
Δy
d
Δx
−1
0 d
1
−1
2. Problem Formulation
0
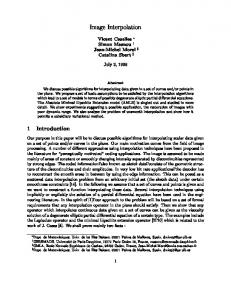
Figure 1: The relationship between HR and LR pixels.
The mathematical model between the HR and LR images plays a key role in the formulation of interpolation algorithms. Due to the finite sampling grid of the sensor array, the image acquisition processes can be modeled as integration (averaging), followed by decimation. Decimation and interpolation are inverse processes. An image decimation/interpolation model is illustrated in Figure 1. The dotted squares denote the HR pixels, while the shaded solid square represents the LR pixel. The decimation factor 𝑑 is 2 in this example. From a physical viewpoint of image acquisition, the response of each sensor is proportional to the integral of the light projected onto the surface of the sensor. Therefore, the intensity of the LR pixel in Figure 1 is determined by the corresponding effective area in the HR image grids. Consider
relationship between the LR and HR images can be modeled as 𝑤 (𝑖, 𝑗) =
(𝐾−1)/2
∑
(𝐾−1)/2
∑
ℎ (𝑘, 𝑙) 𝑓 (𝑖 + 𝑘, 𝑗 + 𝑙) + 𝑛 (𝑖, 𝑗) ,
𝑘=−(𝐾−1)/2 𝑙=−(𝐾−1)/2
𝑔 (𝑖, 𝑗) = 𝑤 (𝑑𝑖, 𝑑𝑗) , (2) where 𝑤(𝑖, 𝑗) is the intermediary signal before decimation, ℎ(𝑘, 𝑙) is a 𝐾 × 𝐾 two-dimensional (2D) integration operator characterizing the averaging process from the HR to LR image, and 𝑛(𝑖, 𝑗) is the additive noise. Rewriting (2) in the matrix-vector formation, we have g = DHf + n,
𝑔 (0, 0) = ℎ (−1, −1) 𝑓 (−1, −1) + ℎ (−1, 0) 𝑓 (−1, 0) + ℎ (−1, 1) 𝑓 (−1, 1) + ℎ (0, −1) 𝑓 (0, −1) + ℎ (0, 0) 𝑓 (0, 0) + ℎ (0, 1) 𝑓 (0, 1)
1
(1)
+ ℎ (1, −1) 𝑓 (1, −1) + ℎ (1, 0) 𝑓 (1, 0) + ℎ (1, 1) 𝑓 (1, 1) , where ℎ(𝑥, 𝑦) is the weight that is proportional to the area of HR pixels 𝑓(𝑥, 𝑦) in the LR pixel 𝑔(0, 0). In this case, ℎ(−1, −1) = (1 − Δ𝑥)(1 − Δ𝑦) and ℎ(−1, 0) = (1 − Δ𝑥). ℎ(𝑥, 𝑦) is a 2D integration operator, which reflects the regions of the HR grid that contribute to the formation of a single pixel in the LR grid. This process is commonly expressed as h = sz𝑇, 𝑇 where s = z = (1/𝑑)[0.5 1 ⋅ ⋅ ⋅ 1 0.5]𝑑+1 (if 𝑑 is even) or s = 𝑇 z = (1/𝑑)[1 1 ⋅ ⋅ ⋅ 1 1]𝑑 (if 𝑑 is odd). Let 𝑔(𝑖, 𝑗) and 𝑓(𝑖, 𝑗) represent the observed LR image of size 𝑀 × 𝑀 and the original HR image of size 𝑑𝑀 × 𝑑𝑀, respectively, where 𝑑 is the decimation factor. The
(3)
where f and g are the lexicographically ordered HR and LR images, respectively, n is the noise vector, and H and D are the corresponding matrices constructed from the integration and decimation processes [15, 16]. The interpolation problem can, therefore, be formulated as solving the least squares problem for f given the observation g. The Tikhonov regularization framework is used in this paper to address this problem, as it is able to offer numerically stable and visually pleasing solution. Under this setting, fopt is the solution to 2 fopt = minDHf − g2 + 𝜆‖f‖22 , f
(4)
where 𝜆 is the regularization parameter which controls the relative contributions between the least square error (first term) and the regularization functional (second term). The regularization term is to ensure smoothness of the solution. The closed-form solution to the least squares problem in (4) using pseudoinverse is given by fopt = [(DH)𝑇 (DH) + 𝜆I]−1 (DH)𝑇 g. However, the closed-form solution is impractical in many real-life applications due to the high computational cost associated with the inversion of the large matrix
Mathematical Problems in Engineering
3
[(DH)𝑇 (DH) + 𝜆I]−1 (with a dimension of 𝑑2 𝑀2 × 𝑑2 𝑀2 ). In view of this, we propose a computationally efficient method to address this issue in the paper.
3. Proposed Regularized Image Interpolation Approach The formulation of the proposed interpolation algorithm involves the manipulation of Kronecker product and SVD to reduce computational cost. The regularized least square solution can achieve a good tradeoff between edge preservation and noise suppression.
The structure of the Kronecker product for the decimation matrix D in (3) depends on the decimation factor, 𝑑. For instance, the structure of D when 𝑑 = 2 is given as 1 [0 [ D = D1 ⊗ D2 = [ .. [ . [0 [ [ ⊗ [ [
0 0 .. . 0
1 0 .. .
[0 3.1. Proposed New Framework of Image Interpolation through SVD and Kronecker Product. The matrix H in the linear image acquisition model (3) has a block-circulant structure [15]: H0 H−1 ⋅ ⋅ ⋅ H1 ] [ [ H1 H0 ⋅ ⋅ ⋅ H2 ] ] [ , H=[ . .. .. .. ] ] [ .. . . . ] [ [H−1 H−2 ⋅ ⋅ ⋅ H0 ]𝑑2 𝑀2 ×𝑑2 𝑀2 ℎ (𝑗, 0) ℎ (𝑗, −1) [ ℎ (𝑗, 1) ℎ(𝑗, 0) [ H𝑗 = [ .. .. [ . . ℎ (𝑗, −1) ℎ (𝑗, −2) [
(5)
⋅ ⋅ ⋅ ℎ (𝑗, 1) ⋅ ⋅ ⋅ ℎ (𝑗, 2)] ] , .. .. ] . . ] ⋅ ⋅ ⋅ ℎ (𝑗, 0)]𝑑𝑀×𝑑𝑀
⋅ ⋅ ⋅ 𝑧0 ]𝑑𝑀×𝑑𝑀 ⋅ ⋅ ⋅ 𝑠1 ⋅ ⋅ ⋅ 𝑠2 ] ] .. ] d .]
0 0 .. . 0
0
0 1 .. .
0
0 0 .. .
] ] ] ]
1 ]𝑀×𝑑𝑀
0 0 .. .
0
0 0] ] .. ] . ]
(7) .
1 ]𝑀×𝑑𝑀
Other decimation matrices with different decimation factors can be constructed in a similar fashion to (7) by adjusting the spacing between the consecutive 1s. The minimization of (4) can be expressed as the constrained least squares problem via
(6) ,
⋅ ⋅ ⋅ 𝑠0 ]𝑑𝑀×𝑑𝑀
where ⊗ denotes the Kronecker product. Here both H1 and H2 are circulant matrices, whose entries are constructed from the vector decomposition of integration operator: h = sz𝑇 , where s = [𝑠−(𝐾−1)/2 , . . . , 𝑠0 , . . . , 𝑠(𝐾−1)/2 ]𝑇 and z = [𝑧−(𝐾−1)/2 , . . . , 𝑧0 , . . . , 𝑧(𝐾−1)/2 ]𝑇 .
(8)
Since the dimension of DH is very large, it may not be computationally feasible to solve the problem directly using matrix pseudoinverse. In view of this, we develop an efficient scheme to solve (8) based on Kronecker product and SVD as follows. First, based on (6) and (7), the Kronecker product of DH can be expressed as DH = (D1 ⊗ D2 ) (H1 ⊗ H2 ) = (D1 H1 ) ⊗ (D2 H2 ) .
(9)
Next, we apply SVD on D1 H1 and D2 H2 to obtain D1 H1 = U1 [Σ1 | 0] VT1 , D2 H2 = U2 [Σ2 | 0] VT2 ,
⋅ ⋅ ⋅ 𝑧1 ⋅ ⋅ ⋅ 𝑧2 ] ] .. ] d .]
𝑠0 𝑠−1 [ 𝑠1 𝑠0 [ ⊗ [ .. .. [ . . 𝑠 𝑠 −1 −2 [
0
0 0 .. .
2 DH g fopt = min[√ ] f − [ ] . 0 2 f 𝜆I
where H𝑗 is the circulant matrix constructed from the 2D integration operator ℎ(𝑖, 𝑗). In the context of image interpolation problem, the integration operator is usually characterized as a 2D separable averaging process. Therefore, the matrix H can be decomposed into the Kronecker product of two matrices as 𝑧0 𝑧−1 [ 𝑧1 𝑧0 [ H = H1 ⊗ H2 = [ .. .. [ . . [𝑧−1 𝑧−2
0 1 .. .
(10)
where U1 , V1 , Σ1 , U2 , V2 , and Σ2 are the standard matrices arising from SVD. Then, substituting (9) and (10) into (8), we obtain fopt
2 DH g = min[ ] f − [ ] f 0 2 √𝜆I
DHf − g 2 ] = min[ √ 2 𝜆f f (U ⊗ U ) ([Σ | 0] ⊗ [Σ | 0]) 2 2 1 2 [ 1 ] T = min[ ] . × (V1 ⊗ V2 ) f − g f √ [ 𝜆f ]2
(11)
4
Mathematical Problems in Engineering
We further multiply the first row of the matrix by (U1 ⊗ U2 )𝑇 and multiply the second row of the matrix by (V1 ⊗ V2 )𝑇 to get
fopt
𝑇 (U1 ⊗ U2 ) (U1 ⊗ U2 ) [ [ [ × ([Σ1 | 0] ⊗ [Σ2 | 0]) (V1 ⊗ V2 )T f = min[ f 𝑇 [ [ −(U1 ⊗ U2 ) g √𝜆(V1 ⊗ V2 )T f [
2 ] ] ] ] . ] ] ]2 (12)
Finally, we denote y = (V1 ⊗ V2 )𝑇 f, x = (U1 ⊗ U2 )𝑇 g, to rewrite the above equation to obtain the optimal solution yopt as yopt
([Σ | 0] ⊗ [Σ | 0]) 2 2 x [ 1 = min ] y − [ ] . y 0 √𝜆I 2
(13)
To find out the closed-form solution of (13), we first get x = (U1 ⊗ U2 )𝑇 g = vec(U𝑇2 ivec(g)U1 ) and fopt = (V1 ⊗ V2 )yopt = vec(V2 ivec(yopt )V𝑇1 ), since the Kronecker product for matrices A, B, and vector c yields the property that (A ⊗ B)c = vec(Bivec(c)A𝑇). Then, according to (13), we can get yopt = minf ‖[Σ1 | 0] ⊗ [Σ2 | 0]y − x‖22 + 𝜆‖y‖22 and use pseudoinverse as the optimal solution as −1
yopt = [A𝑇 A + 𝜆I] A𝑇 x,
and P(𝜆) = ((DH)𝑇 (DH) + 𝜆I)−1 (DH)𝑇 . Substituting (9) and (10) into DH and P(𝜆), we obtain 𝑀 𝑀
𝑇 , DH = ∑ ∑𝜎1,𝑖 𝜎2,𝑗 u(𝑖−1)𝑀+𝑗 k(𝑖−1)𝑑𝑀+𝑗 𝑖=1 𝑗=1
P (𝜆) = ∑∑ [ 𝑖=1 𝑗=1
𝑇 ) k(𝑖−1)𝑑𝑀+𝑗 = vec (̃k2,𝑗 k̃1,𝑖
−1
= A𝑇(AA𝑇 + 𝜆I) x
(15)
−1 Σ Σ = ([ 1 ] ⊗ [ 2 ]) ([Σ21 ] ⊗ [Σ22 ] + 𝜆I) x. 0 0
By utilizing the newly derived equation (15), the computational cost of the estimation can be reduced. For an image of size 𝑀 × 𝑀 with decimation factor 𝑑, only 𝑂(𝑑3 𝑀3 ) operations are needed in the new scheme as compared to 𝑂(𝑑6 𝑀6 ) for direct implementation of pseudoinverse for (4). Therefore, this makes the algorithm computationally attractive and feasible to be implemented in real-life applications.
̃ 1,𝑖 , and u ̃ 2,𝑗 are the column orthonormal where k̃1,𝑖 , k̃2,𝑗 , u basis of V1 , V2 , U1 , and U2 , respectively. The residual error vector between the original image f and the interpolation result fopt is equal to r = fopt − f 2 2 𝜎1,𝑖 𝜎2,𝑗
𝑀 𝑀
= (∑ ∑ [ 𝑖=1 𝑗=1
2 𝜎2 + 𝜆 𝜎1,𝑖 2,𝑗
] k(𝑖−1)𝑑𝑀+𝑗 (18)
𝑇 × k(𝑖−1)𝑑𝑀+𝑗 − I) f 𝑀 𝑀
+ ∑∑ [ 𝑖=1 𝑗=1
𝜎1,𝑖 𝜎2,𝑗 2 2 + 𝜎1,𝑖 𝜎2,𝑗
𝜆
] k(𝑖−1)𝑑𝑀+𝑗 u𝑇(𝑖−1)𝑀+𝑗 n.
If the noise is zero-mean additive white Gaussian with variance 𝜎𝑛2 and independent of the image, then the expected error vector and square error between fopt and f are given by 𝑀 𝑀
𝐸 (r) = (∑∑ [ 𝑖=1 𝑗=1
2 2 𝜎1,𝑖 𝜎2,𝑗 2 𝜎2 + 𝜆 𝜎1,𝑖 2,𝑗
] k(𝑖−1)𝑑𝑀+𝑗
𝑇 × k(𝑖−1)𝑑𝑀+𝑗 − I) 𝐸 (f) ,
𝐸 (‖r‖22 )
=
2 2 𝑀 𝑀 𝜎1,𝑖 𝜎2,𝑗 2 𝜎𝑛 ∑∑ 2 2 𝜎2 + 𝜆) 𝑖=1 𝑗=1 (𝜎1,𝑖 2,𝑗 𝑀 𝑀
3.2. Regularization Analysis. After establishing the efficient algorithm to obtain the regularized solution, we study the effect of regularization on the interpolation results. The mean error and mean square error between the interpolated and original images are analyzed as follows. The direct solution to the least square problem in (4) is given as fopt = P(𝜆)g, where fopt is the estimated HR image
(17)
̃ 𝑇1,𝑖 ) , u2,𝑗 u u(𝑖−1)𝑀+𝑗 = vec (̃
where A = [Σ1 | 0] ⊗ [Σ2 | 0], A𝑇 = [ Σ01 ] ⊗ [ Σ02 ], and A𝑇 A = [Σ21 ] ⊗ [Σ22 ]. Finally, we can rewrite yopt as −1
2 𝜎2 + 𝜆 𝜎1,𝑖 2,𝑗
] k(𝑖−1)𝑑𝑀+𝑗 u𝑇(𝑖−1)𝑀+𝑗 ,
where Σ1 = diag(𝜎1,𝑖 ), Σ2 = diag(𝜎2,𝑗 ). k(𝑖−1)𝑑𝑀+𝑗 and u(𝑖−1)𝑀+𝑗 are the [(𝑖−1)𝑑𝑀+𝑗]th and [(𝑖−1)𝑀+𝑗]th column vectors of the orthogonal matrices V1 ⊗ V2 and U1 ⊗ U2 , respectively, which can be expressed as
(14)
yopt = [A𝑇 A + 𝜆I] A𝑇 x
(16)
𝜎1,𝑖 𝜎2,𝑗
𝑀 𝑀
+ 𝐸 [f 𝑇 (I − ∑∑ [
4 4 𝜎1,𝑖 𝜎2,𝑗
2 𝜎2 𝑖=1 𝑗=1 (𝜎1,𝑖 2,𝑗
2
+ 𝜆)
𝑇 × k(𝑖−1)𝑑𝑀+𝑗 k(𝑖−1)𝑑𝑀+𝑗 ) f] . ] (19)
Mathematical Problems in Engineering
5
It can be observed from (19) that the regularization functional has biased the interpolated image, as a tradeoff for numerical stability (i.e., 𝐸(r) ≠ 0 if 𝜆 ≠ 0 since 𝑀 𝑇 ∑𝑀 𝑖=1 ∑𝑗=1 k(𝑖−1)𝑑𝑀+𝑗 k(𝑖−1)𝑑𝑀+𝑗 = I). The mean square error 2 (MSE) 𝐸(‖r‖2 ) consists of two parts: the noise term and the image term. If the image is preprocessed using zero-mean centering and assumed to be white, then 𝐸(ff 𝑇 ) = 𝜎𝑓2 I, where 𝜎𝑓2 = 𝐸(f 𝑇 f)/𝑀2 is the image power. This assumption is used to enable 𝐸(‖r‖22 ) to be upper-bounded explicitly in terms of 𝜆 as below: 𝑀 𝑀
𝐸 (‖r‖22 ) ≤𝜎𝑓2 𝑀2 − 𝜎𝑓2 ∑ ∑
4 4 𝜎1,𝑖 𝜎2,𝑗
2 𝜎2 𝑖=1 𝑗=1 (𝜎1,𝑖 2,𝑗
+
+ 𝜆)
2
2 (I − DHP (𝜆) g . GCV (𝜆) = [trace(I − DHP (𝜆)]2
(21)
Cross-validation is a widely used technique in the field of statistical data analysis. It uses the leave-one-out principle to address approximation of noisy data. For a fixed value of model parameter, an interpolated image is redecimated to predict the observation. GCV determines the parameter by minimizing the weighted sum of prediction errors. An advantage of GCV is that it allows the selection of the regularization parameter even when the noise power is unknown. We derive the GCV function under the context of our formulation to give 𝑀 2 2 ∑𝑀 𝑖=1 ∑𝑗=1 (𝜆𝑥𝑖𝑀+𝑗 / (𝜎1,𝑖 𝜎2,𝑗 + 𝜆)) 𝑀 2 2 (∑𝑀 𝑖=1 ∑𝑗=1 (𝜆/ (𝜎1,𝑖 𝜎2,𝑗 + 𝜆)))
Lagrange- Bicubic Edge- Proposed based directed method 33.19 30 dB 32.93 31.73 33.72 Lena 33.39 40 dB 33.13 31.82 34.39 (512 × 512) 33.41 Noiseless 33.15 31.83 34.47 30.46 30 dB 30.21 29.24 31.02 Boat 30.58 40 dB 30.33 29.30 31.43 (512 × 512) 30.59 Noiseless 30.35 29.31 31.48 Image
2
2
,
(22)
where 𝜎1,𝑖 and 𝜎2,𝑗 are the singular values of Σ1 and Σ2 , respectively. 𝑥𝑖𝑀+𝑗 is the [𝑖𝑀+𝑗]th entry of the column vector x in (15). In fact, experimental results in Section 4 show that our algorithm is robust towards different values of 𝜆 so long as it falls within a reasonable range.
4. Experimental Results 4.1. Comparison with Other Image Interpolation Approaches. The proposed approach is compared with other conventional methods: Lagrange (2nd-order polynomial) and bicubic and
Noise level
Board (256 × 256)
30 dB 40 dB Noiseless
14.15 14.17 14.18
14.30 14.31 14.31
13.77 13.79 13.79
14.98 14.99 14.99
CalTrain (400 × 512)
30 dB 40 dB Noiseless
29.25 29.35 29.36
29.40 29.48 29.49
28.59 28.63 28.64
29.90 30.19 30.23
(20)
2 2 𝑀 𝑀 𝜎1,𝑖 𝜎2,𝑗 𝜎𝑛2 ∑∑ . 2 2 𝜎2 + 𝜆) 𝑖=1 𝑗=1 (𝜎1,𝑖 2,𝑗
It can be seen from (19) and (20) that regularization will reduce the impact of noise by introducing a small bias in the interpolated image. The regularization technique is instrumental in providing satisfactory results so long as the regularization parameter is properly selected. A simple yet effective scheme to estimate the regularization parameter 𝜆 is based on the generalized cross-validation (GCV) function since it has been shown to be robust in other regularization schemes [16]:
GCV (𝜆) =
Table 1: PSNR performance comparison of various image interpolation approaches.
edge-directed image interpolation [5]. The standard benchmark test images are used as ground truth in the experiments, including Lena (512 × 512), Boat (512 × 512), Board (256 × 256), and CalTrain (400 × 512), as shown in Figure 2. The observed low-resolution is artificially generated by filtering the original ground truth high-resolution image with an integration operator and decimating it at a rate of 𝑑 = 2 in the horizontal and vertical directions. The downsampled image is further degraded under different noise levels to produce different SNR values: noiseless, 40 dB, and 30 dB. The image is divided into blocks of size 16 × 16 with 4 × 4 overlapping area. There is a 4 × 4 overlapping in each block to avoid boundary effect. For each block, the proposed algorithm is applied to perform interpolation using (10)–(15), and the regularization parameter 𝜆 is chosen as 10−4 in this experiment. For performance evaluation, peak signal-to-noise ratio (PSNR) is used as the objective performance metric. Table 1 summarizes the results obtained for the test images using different methods. It can be observed that the proposed method achieves higher PSNR than the conventional methods consistently. On average, the proposed method offers a PSNR improvement of 0.5–1.0 dB over the Lagrange and bicubic methods and 1-2 dB over the edge-directed method. In Figures 3 and 4, the interpolated results using the Boat and Board images are given. It can be observed that the proposed method preserves the overall sharpness of the interpolated images, in particular near the edge and textured regions. The subjective human evaluation is confirmed by the objective performance measure given in Table 1. 4.2. Evaluation on the Choice of Regularization Parameter. In this section, the impact of the regularization parameter on the interpolation results is investigated. The Lena image in Figure 2(a) is selected as the test image. The same algorithm as in previous experiment is run but different values of regularization parameter 𝜆 are used, which range from 10−2 to 10−5 . In addition, the estimated 𝜆 based on the GCV function in (22) is also adopted. Table 2 summarizes the results
6
Mathematical Problems in Engineering
(a)
(b)
(c)
(d)
Figure 2: Test images used in experiments. (a) Lena, (b) Boat, (c) Board, and (d) CalTrain.
(a)
(b)
(c)
(d)
Figure 3: A closed-up comparison of various interpolated images (Boat image). (a) Lagrangian-based image interpolation, (b) bicubic image interpolation, (c) edge-directed image interpolation, and (d) the proposed approach.
Table 2: Comparison of different regularization parameters in PSNR performance. Noise
𝜆 = 10−2 30 dB 30.90 40 dB 31.17 Noiseless 31.21
Proposed method 𝜆 = 10−3 𝜆 = 10−4 𝜆 = 10−5 33.69 33.72 33.71 34.34 34.39 34.39 34.42 34.47 34.47
GCV(𝜆) 33.72 34.39 34.47
obtained using different regularization parameters. It can be observed that this method provides consistently good results for 𝜆 = 10−3 to 𝜆 = 10−5 and for various noisy environments from noiseless to 30 dB noise. The estimated 𝜆 using GCV also offers comparable performance. The results suggest that the proposed algorithm is robust towards different noisy environments and regularization parameters as long as the value of 𝜆 falls within a reasonable range [10−3 , 10−5 ]. Note that there is an obvious improvement from 𝜆 = 10−2 to 𝜆 = 10−3 . This gap can be explained by (20) together with the simulated mean square error (MSE) curve in Figure 5. The upper bound of MSE in (20) consists of three terms, where the first and third terms are positive and the second is negative. When the value of 𝜆 increases, the second term will decrease; however, the third term will increase. We simulate this situation in terms of 𝜆 ranging from 10−7 to 101 in Figure 5. The image energy is normalized to 1 (i.e., 𝜎𝑓2 = 1/𝑀2 ) and
Table 3: The run-time performance comparison of various image interpolation approaches. Image Lena (512 × 512) Boat (512 × 512) Board (256 × 256) CalTrain (400 × 512)
Lagrangebased
Bicubic
Edgedirected
Proposed method
0.13 s
0.56 s
29.80 s
0.29 s
0.13 s
0.56 s
31.80 s
0.29 s
0.06 s
0.20 s
6.90 s
0.15 s
0.09 s
0.49 s
24.51 s
0.33 s
30 dB SNR noise level (i.e., 𝜎𝑛2 = 10−3 𝜎𝑓2 ). Consider the illconditioned problem of matrix inversion; half of the singular values 𝜎1,𝑖 are assumed to be evenly distributed in the range of [0, 1] and the other half are assumed to be 0. It can be observed from Figure 5 that the magnitude of second term drops quickly and dramatically before the third term begins to increase. This leads to a basin area in the overall mean square error when 𝜆 is between a certain range. 4.3. Evaluation on Computational Complexity. These image interpolation approaches are run on a PC with Windows XP, MATLAB 7.1, CPU P4-3.4 GHz, and 1 G RAM. Each approach is run for 10 times and their average run-time is presented in Table 3, where one can see that the proposed approach
Mathematical Problems in Engineering
7
(a)
(b)
(c)
(d)
Upper bound of MSE
Figure 4: A closed-up comparison of various interpolated images (Board image). (a) Lagrangian-based image interpolation, (b) bicubic image interpolation, (c) edge-directed image interpolation, and (d) the proposed approach.
2
Acknowledgment
1
This work was supported by National Natural Science Foundation of China (nos. 61105010 and 61375017), Program for Outstanding Young Science and Technology Innovation Teams in Higher Education Institutions of Hubei Province, China (no. T201202).
0.5 0 −0.5 −1
References
−1.5 −2 10−7
10−6
10−5
10−4
First term Second term
10−3 10−2 Value of 𝜆
10−1
100
101
Third term Overall
Figure 5: Simulation of upper bound of mean square error in terms of 𝜆.
is much faster than the edge-directed interpolation, faster than the bicubic interpolation, but slightly slower than the Lagrange interpolation.
5. Conclusion In this paper, a new regularization-based image interpolation algorithm using Kronecker product and singular value decomposition has been proposed. The proposed approach reduces the computational cost of interpolation while offering significant performance improvement over other conventional methods. This paper also analyzes the effect of regularization on the interpolation results and shows that the proposed approach is fairly robust towards different values of regularization parameter. It is worthwhile to further study how to extend the proposed approach for the superresolution image reconstruction.
Conflict of Interests The authors declare that there is no conflict of interests regarding the publication of this paper.
[1] J. Zhao, H. Feng, Z. Xu, and Q. Li, “An improved image deconvolution approach using local constraint,” Optics and Laser Technology, vol. 44, no. 2, pp. 421–427, 2012. [2] J. Tian and K.-K. Ma, “A survey on super-resolution imaging,” Signal, Image and Video Processing, vol. 5, no. 3, pp. 329–342, 2011. [3] P. Shanmugavadivu and K. Balasubramanian, “Particle swarm optimized multi-objective histogram equalization for image enhancement,” Optics and Laser Technology, vol. 57, pp. 243–251, 2014. [4] H. Yang, Z. Zhang, M. Zhu, and H. Huang, “Edge-preserving image deconvolution with nonlocal domain transform,” Optics and Laser Technology, vol. 54, pp. 128–136, 2013. [5] X. Li and M. T. Orchard, “New edge-directed interpolation,” IEEE Transactions on Image Processing, vol. 10, no. 10, pp. 1521– 1527, 2001. [6] J. W. Hwang and H. S. Lee, “Adaptive image interpolation based on local gradient features,” IEEE Signal Processing Letters, vol. 11, no. 3, pp. 359–362, 2004. [7] D. D. Muresan and T. W. Parks, “Adaptively quadratic (AQua) image interpolation,” IEEE Transactions on Image Processing, vol. 13, no. 5, pp. 690–698, 2004. [8] L. Wang, S. Xiang, G. Meng, H. Wu, and C. Pan, “Edge-directed single-image super-resolution via adaptive gradient magnitude self-interpolation,” IEEE Transactions on Circuits and Systems for Video Technology, vol. 23, no. 8, pp. 1289–1299, 2013. [9] H. Xu, G. Zhai, and X. Yang, “Single image super-resolution with detail enhancement based on local fractal analysis of gradient,” IEEE Transactions on Circuits and Systems for Video Technology, vol. 23, no. 10, pp. 1740–1754, 2013. [10] F. Zhou, W. Yang, and Q. Liao, “Interpolation-based image super-resolution using multisurface fitting,” IEEE Transactions on Image Processing, vol. 21, no. 7, pp. 3312–3318, 2012. [11] V. Magudeeswaran and C. G. Ravichandran, “Fuzzy logicbased histogram equalization for image contrast enhancement,”
8
[12]
[13]
[14] [15]
[16]
Mathematical Problems in Engineering Mathematical Problems in Engineering, vol. 2013, Article ID 891864, 10 pages, 2013. T. Liu and Z. Xiang, “Image restoration combining the secondorder and fourth-order PDEs,” Mathematical Problems in Engineering, vol. 2013, Article ID 743891, 7 pages, 2013. X. Liu, D. Zhao, R. Xiong, S. Ma, W. Gao, and H. Sun, “Image interpolation via regularized local linear regression,” IEEE Transactions on Image Processing, vol. 20, no. 12, pp. 3455– 3469, 2011. A. N. Tikhonov, Equations of Mathematical Physics, vol. 39, Dover Publications, New York, NY, USA, 1963. R. L. Lagendijk and K. Biemond, Iterative Identification and Restoration of Images, Kluwer Academic Publishers, Boston, Mass, USA, 1990. N. P. Galatsanos and A. K. Katsaggelos, “Methods for choosing the regularization parameter and estimating the noise variance in image restoration and their relation,” IEEE Transactions on Image Processing, vol. 1, no. 3, pp. 322–336, 1992.
Advances in
Operations Research Hindawi Publishing Corporation http://www.hindawi.com
Volume 2014
Advances in
Decision Sciences Hindawi Publishing Corporation http://www.hindawi.com
Volume 2014
Journal of
Applied Mathematics
Algebra
Hindawi Publishing Corporation http://www.hindawi.com
Hindawi Publishing Corporation http://www.hindawi.com
Volume 2014
Journal of
Probability and Statistics Volume 2014
The Scientific World Journal Hindawi Publishing Corporation http://www.hindawi.com
Hindawi Publishing Corporation http://www.hindawi.com
Volume 2014
International Journal of
Differential Equations Hindawi Publishing Corporation http://www.hindawi.com
Volume 2014
Volume 2014
Submit your manuscripts at http://www.hindawi.com International Journal of
Advances in
Combinatorics Hindawi Publishing Corporation http://www.hindawi.com
Mathematical Physics Hindawi Publishing Corporation http://www.hindawi.com
Volume 2014
Journal of
Complex Analysis Hindawi Publishing Corporation http://www.hindawi.com
Volume 2014
International Journal of Mathematics and Mathematical Sciences
Mathematical Problems in Engineering
Journal of
Mathematics Hindawi Publishing Corporation http://www.hindawi.com
Volume 2014
Hindawi Publishing Corporation http://www.hindawi.com
Volume 2014
Volume 2014
Hindawi Publishing Corporation http://www.hindawi.com
Volume 2014
Discrete Mathematics
Journal of
Volume 2014
Hindawi Publishing Corporation http://www.hindawi.com
Discrete Dynamics in Nature and Society
Journal of
Function Spaces Hindawi Publishing Corporation http://www.hindawi.com
Abstract and Applied Analysis
Volume 2014
Hindawi Publishing Corporation http://www.hindawi.com
Volume 2014
Hindawi Publishing Corporation http://www.hindawi.com
Volume 2014
International Journal of
Journal of
Stochastic Analysis
Optimization
Hindawi Publishing Corporation http://www.hindawi.com
Hindawi Publishing Corporation http://www.hindawi.com
Volume 2014
Volume 2014