4 vB. a b c d e f g 4 5 6. e f g 0 1 2 3 4 5 6. Image A. Image B. Figure 4:
Path interpolation in the occluded regions with one object sta- tionary. (a) and (b)
...
Moving Gradients: A Path-Based Method for Plausible Image Interpolation Dhruv Mahajan Columbia University
Fu-Chung Huang UC Berkeley
Wojciech Matusik Adobe Systems
Ravi Ramamoorthi UC Berkeley
Peter Belhumeur Columbia University
(a) Input Image A (b) Interpolated Frames - Our Method (c) Input Image B Figure 1: This paper describes an image interpolation technique to produce a sequence of intermediate frames between two input Images A and B (a,c), as seen in our result in (b). While we show only three frames above, our method moves gradients in the original images to solve simultaneously for any number of frames of a temporally consistent interpolation, producing an animation sequence that preserves the frequency content of the original images, and looks quite natural. Note that this example is very challenging and under-constrained, involving complex, non-rigid and local deformations. Moreover, in contrast to conventional morphing-based techniques, our method is fully automatic — we require only the input images, with no further user assistance.
Abstract We describe a method for plausible interpolation of images, with a wide range of applications like temporal up-sampling for smooth playback of lower frame rate video, smooth view interpolation, and animation of still images. The method is based on the intuitive idea, that a given pixel in the interpolated frames traces out a path in the source images. Therefore, we simply move and copy pixel gradients from the input images along this path. A key innovation is to allow arbitrary (asymmetric) transition points, where the path moves from one image to the other. This flexible transition preserves the frequency content of the originals without ghosting or blurring, and maintains temporal coherence. Perhaps most importantly, our framework makes occlusion handling particularly simple. The transition points allow for matches away from the occluded regions, at any suitable point along the path. Indeed, occlusions do not need to be handled explicitly at all in our initial graph-cut optimization. Moreover, a simple comparison of computed path lengths after the optimization, allows us to robustly identify occluded regions, and compute the most plausible interpolation in those areas. Finally, we show that significant improvements are obtained by moving gradients and using Poisson reconstruction. CR Categories: I.3.m [Computer Graphics]: Miscellaneous— Image Interpolation; I.4.9 [Image Processing and Computer Vision]: Miscellaneous—Optical Flow Keywords: interpolation, path framework, transition point, occlusion handling, 3D poisson reconstruction
1
Introduction
We address the problem of image interpolation, to produce a sequence of plausible intermediate frames between two input images.
We focus on a wide range of applications like animation of still images (see Fig. 1), temporal interpolation for up-sampling of low frame rate videos, and interpolating viewpoints between images captured with different camera locations. Our method is based on the simple and intuitive notion that a given pixel in the interpolated frames will trace out a path in the input images. Figure 2a shows two images A and B. Image B is a shifted version of Image A. For simplicity, we consider a single scan line forming a x − t interpolation plane shown in Fig. 2b. We synthesize each pixel p separately, by simply moving and copying pixels from the input images.1 Figure 2b also shows one of the ways we can interpolate at pixel p. Initially pixels are copied from Image A and at some point we transition and start copying from Image B. This corresponds to an interpolation path as shown in Fig. 2c. The path starts at p in A, moves through the pixels in A to pA , makes a transition to pB in B and then moves through pixels in B to reach p. Our method is closely related to optical flow (and disparity-based stereo and warping) techniques (Fig. 2d). However, instead of standard optical flow that projects pixels from the input images (arrows from input images in Fig. 2d), ours is effectively an inverse optical flow algorithm. We compute where in the input images a given intermediate pixel p comes from (arrows towards input images in Fig. 2b), thus avoiding holes and other artifacts. Our focus is on visually plausible interpolation, rather than obtaining the most accurate sub-pixel flows for the input images. Developing a path-based framework (Sec. 3.1) requires a few simple, yet critical and novel design decisions. As shown in Fig. 2c, we transition (Sec. 3.2) between the two input images at some point pA and pB on the path. The transition point is chosen so that the two images match well at this point (pA and pB are in correspondence). It can be arbitrary and asymmetric, giving us an extra degree of flexibility to achieve high quality results. Because we transition instead of blend, we preserve the frequency content of the original images without blurring or ghosting. A major contribution is to greatly simplify occlusion handling. The flexible transition points allow us to find a good correspondence somewhere along the path, even if the pixel p itself is occluded in one of the input images. By avoiding matching in the occluded regions, we can write a simple energy functional that is solved using standard graph-cut techniques (Sec. 4.2). This optimization to find 1 In
practice, we do take spatial coherence into account, by ensuring that neighboring pixels have similar paths (Sec. 4.1).
tA= 0
t
tB= 1
Image A Scanline a b c d e f g h i j k
Image B Scanline
y f g h i j k l mn o p x
(a) Schematic
a b c d e f
b c d e f g
c d e f g h
d e f g h i
e f g h i j
p
f g h i j k p
p
g h i j k l
h i i j j k k l l m m n
j k k l l m mn n o o p
tA= 0 t1 t2 t3 t4 tB= 1
(b) Possible Interpolation
a b c d e f
b c d e f g
c d e f g h
d e e f f g g h h miB i j
pB
pA
f g h i gmhA i j h i j k Transition i j k l j k l m k l m n p
j k k l l m mn n o o p
(c) Corresponding Path
a b c d b c d e Backward c flow d e f d e f g e f g h f g h i
e f g h i j
p
f g h i j k p
g h i j k l
h i j k i j k l j k l m k Forward l mn flow l m n o m n o p
tA= 0 t1 t2 t3 t4 tB= 1
(d) Standard Optical Flow
Figure 2: Basic notion of path in our algorithm. Image B is a shifted version of Image A. We consider a single scan line forming a x − t interpolation plane (b). (b) shows the interpolation at a pixel p. Initially pixels are copied from Image A and at some point we start copying from Image B. This corresponds to an interpolation path as shown in (c). The interpolation path for pixel p moves in A towards the right until pA , makes a transition to B and then moves towards the right in B to reach p. At the transition point, the intensity values in the two images match, and hence we get a visually plausible interpolation. In practice, we do this matching in the gradient domain and copy gradient values instead of intensities for visually better results. (d) shows the optical flow interpolation. Red and blue lines show the interpolation with standard forward and backward optical flow respectively.
paths is robust, since we do not need to consider visibility explicitly, unlike standard optical flow and stereo. Seen in the context of optical flow techniques, our path computation robustly finds the forward and backward flows whenever they exist (in unoccluded regions, both flows are approximately the same). In many cases, a visually plausible interpolation is produced directly, and no further processing is needed. Moreover, the computed paths make it easy to identify the occluded regions deterministically as a post-processing operation by simply checking the consistency of flows (Sec. 3.3). Thereafter, we can easily perform plausible interpolation in these areas (Sec. 4.3). Finally, we show that significant benefits, in terms of visual quality, can be obtained by working in the gradient domain (Secs. 3.4, 4.4), matching, moving and copying image gradients rather than pixel intensities. To our knowledge, ours is the first technique that does interpolation in the gradient domain. We demonstrate the power of our framework by showing three applications (Sec. 6), ranging from temporal interpolation of video sequences (Fig. 13) where we can address non-rigid motions of multiple objects, to view interpolation (Fig. 12), to animating still images (Figs. 1, 15) where we can interpolate the complex local deformations correctly. Moreover, as seen in Figs. 6, 7 and 13, our approach produces significantly better results than both commercial video interpolation software (Adobe Aftereffects), and image interpolation based on optical flow.
2
Previous Work
Optical flow and stereo: There is a wealth of research in computer vision on establishing dense correspondences between a pair of images. A good survey of two-view stereo methods is [Scharstein and Szeliski 2002]. For more general motions of scene elements, optical flow methods are usually employed [Barron et al. 1994]. Interpolation is not usually the main goal of these methods, although it is simple to project pixels from the input images using the forward and backward flows. These results are then blended together. However, this linear blending can lead to ghosting and blurring if there are even minor errors in the flows. The path framework (essentially a form of inverse optical flow) draws heavily from these techniques. Our key innovations are the use of a transition point to avoid blending the images, and the resulting simplicity with which we handle occlusions. The traditional emphasis in optical flow has been on computing continuous flow, rather than robustly finding discontinuities. Some methods break the optical flow into piecewise-smooth parts [Black and Anandan 1996; Mémin and Pérez 2002]. However, these methods are parametric and cannot handle non-rigid scenes. [Xiao et al. 2006; Alvarez et al. 2007] take an important step by introducing
iterative variational methods. [Zitnick et al. 2005] jointly compute optical flow and video segmentation. However, their technique fails in the presence of significant occlusions due to absence of explicit occlusion reasoning. In stereo, occlusions have been addressed with dynamic programming within a scan-line [Belhumeur and Mumford 1992; Geiger et al. 1992], and more recently with global optimization using graph cuts [Kolmogorov and Zabih 2001; Sun et al. 2005]. An important disadvantage for most of these methods, is they need to explicitly consider occlusions within the optimization with some sort of occlusion penalty, that makes optimization much more difficult. In contrast, in our method, a low cost path exists even for the occluded pixels. Hence, we do not need to consider occlusions explicitly in our optimization at all, and can handle them as a simple post-optimization operation. This makes our energy functional simple and easy to optimize. Warping and morphing: More generally, a variety of techniques exist to warp the input images to create intermediate frames. Extensive work exists in image-based rendering (IBR) [Chen and Williams 1993; McMillan and Bishop 1995; Seitz and Dyer 1996; Fitzgibbon et al. 2003], that uses either manual correspondence or computer vision techniques based on stereo and optical flow. Most of these methods focus on view interpolation, while we develop a common framework for view and temporal interpolation by using a general linear path. Some of these methods are inspired by seminal earlier work on image morphing [Wolberg 1990], that can interpolate between completely general (and possibly very different) images. However, morphing usually requires user-specified correspondences while our method is fully automatic. Video processing: The concept of having transition points between input images and videos to generate new sequences has also been used before for problems like video textures [Schödl et al. 2000], graph-cut textures [Kwatra et al. 2003] and video compositing [Wang et al. 2005]. The inputs are the images or videos and the output is also an edited or composited image or video respectively. In comparison, we also find a variable transition point for our paths at every pixel. However, our input is just two images and the output is the whole sequence of interpolated frames. Poisson reconstruction: In our algorithm, we copy gradients from the original images and need to reconstruct pixel values using the gradients. The Poisson equation has been widely used for problems other than image interpolation, such as image editing applications in the gradient domain [Pérez et al. 2003; Jia et al. 2006; Agarwala et al. 2004; Jia and Tang 2008]. Similarly, the 3D Poisson equation has been used for video editing in the gradient domain [Wang et al. 2004]. However, in all these methods the gradient fields in the input images/videos remain static. Their inputs are images (videos) and output also an image (video). In comparison, our inputs are just two 2D images and output the whole sequence of interpolated frames.
3
1
Overview of Our Algorithm
We now present an overview of our algorithm, highlighting its main features and novel contributions. The main components are the path framework (Sec. 3.1), a new free parameter via transition points (Sec. 3.2), simplified occlusion handling (Sec. 3.3) and gradient domain Poisson reconstruction (Sec. 3.4). Corresponding Secs. 4.1-4.4 discuss the implementation of each component of our algorithm. We also discuss the limitations of our work alongside. 3.1 Path Framework As discussed in Sec. 1 and illustrated in Fig. 2, our method is based on the notion of a path at every pixel. The path starts at p in A, moves through the pixels in A to pA , makes a transition to pB in B and then moves through pixels in B to reach p. At the transition point, the intensity values in the two images match, and hence we get a visually plausible interpolation. The interpolated values at p can then be found by moving the pixels along this path and copying their gradient values at p. Although Fig. 2 shows a horizontal path, as suitable for view interpolation with rectified images, the path framework is general. We can consider any linear path, thus allowing a common framework for view and temporal interpolation.2 The path ω can be parameterized by two general motion vectors mA and mB in A and B respectively, ω = (mA , mB ). 3.1.1
Path vs. Optical Flow
Our path framework is closely related to optical flow. Given a pixel p in image A, forward optical flow determines to which pixel in image B it matches best. Similarly backward optical flow is found from B to A. Figure 2d shows the interpolation at p using forward (red) and backward (blue) flow. These flows are then linearly blended to get the final interpolation. Our path framework can be viewed as an inverse optical flow. Given a pixel p in the intermediate frame I(p,t), we determine from where in image A or B this pixel comes. Note that in standard optical flow, not all pixels in the intermediate frame will have a pixel in the initial images project onto them (either due to change in scale, minor flow errors, incorrect handling of occlusions, or integer quantization). These holes need to be filled as a post-processing step and can lead to unpleasant visual artifacts, while our path framework goes through each intermediate pixel, and so has no holes. Both our method and standard optical flow have analogous approximations and limitations. Optical flow assumes that a point moves in a straight line from A to B and vice versa; curved motions cannot be addressed. The path framework does not have this restriction, but instead assumes that all points/pixels passing through p during interpolation have the same flow. Thus, our paths are only approximate for highly curved objects. In practice, these assumptions work well for most scenes, except at the occlusion boundaries (Sec. 3.3). Both our and optical flow techniques also cannot handle complex lighting changes. However, small changes in lighting can be smoothly handled by working in the gradient domain (Sec. 3.4). 3.2
Arbitrary Transition Point
An important novel idea is the transition point between the images. By allowing the transition point to vary, we give flexibility in where correspondence is established. As shown in Fig. 2c, the transition points pA and pB at p are related to path parameters (mA , mB ) by pA = p + mA
pB = p − mB .
(1)
Since mA and mB are general motion vectors, the transition points pA and pB can vary arbitrarily over the images and we choose the 2 Although we only consider linear paths in this paper, our framework is not restricted to them. For example, we can consider general non-linear paths constructed using affine transformations on pixels. This might be helpful for handling more general motions such as rotation, shear or scaling.
.5 0
(a) Input Images (b) Transition Point Figure 3: (a) shows two input stereo images. (b) shows the transition point at every pixel as a fraction of total path length. Note how the transition point changes at every pixel to enhance the visual plausibility.
one where the two images agree the most. We constrain mA and mB to have the same direction so that the direction of motion remains the same once we transition from A to B. mB mA = = vˆB . vˆA = | mA | | mB | Figure 3b shows the transition point at every pixel as a fraction of total path length for the two stereo images shown in Fig. 3a. This parameter is a function of matching cost and changes significantly over the image. Transition points provide an important extra degree of freedom to improve the quality of interpolation compared to previous techniques. Indeed, standard forward or backward optical flow (Fig. 2d) can be seen as fixing the transition to be at the end-points, while other work on symmetric stereo using a cyclopean coordinate system [Belhumeur and Mumford 1992] effectively requires symmetric transition points. While our method explicitly computes paths, not optical flows, the distance between the transition points can be used to predict forward (vA ) and backward (vB ) flows, vA = pB − pA
vB = pA − pB .
(2)
In regions away from occlusion boundaries, the backward and forward flows are nearly equivalent. The occluded regions are discussed in detail in Secs. 3.3, 4.3. 3.3 Occlusion Handling An important benefit of arbitrary transition points is that they allow us to handle occlusions in a relatively simple and deterministic manner. We assume that only two layers/objects are involved in occlusion. Boundaries involving more than two layers as in Fig. 8 are not directly addressed by our method.
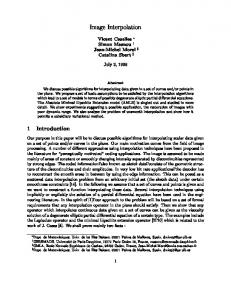
Figures 4a and b show two objects—foreground represented by alphabets, and background represented by numbers. The background is static and the foreground moves to the left by 4 pixels. As a result, in Fig. 4c, the region 0123 of the background occluded in image A becomes visible in image B. Figure 4c shows one of the plausible paths for this pixel along with our interpolation at that pixel. Since we can do matching at a point other than the pixel p itself, there still exists a path in the occluded region. The transition occurs at the foreground pixel g visible in both images. Figure 4d shows another possible path at p. Note that both the paths are equivalent except that the transition occurs at pixel f . Hence, the initial path computation in Sec. 4.2 does not need to explicitly consider occlusion at all. This is in stark contrast to most optical flow and stereo algorithms—that must solve for occlusion within the optimization by taking a penalty or treating these pixels as outliers. Once the path is determined, the transition points pA and pB are known and we directly compute the flows using Eq. 2. Figures 4c and d show these flows at a pixel p in the occluded region. Since p in image A has a correspondence in image B, we are able to predict the forward flow. However, the backward flow is not defined since the background (“1”) is not visible in A. Hence, our path framework
vA= 0 ...................
vA= - 4 ...................
Back Plane
0 1 2 3 4 5 6
...................
...................
Back Plane
0 1 2 3 4 5 6
...................
a b c d e f g 4 5 6
e f g
Image B
(a) Scene for Image A
(b) Scene for Image B
c d e f g
d e f g 0
-4 vA
e f g 0 1
f g 0 1 2
g 0 1 2 3
4 vB
4 4 4 4 4
5 5 5 5 5
(c) Possible Path
6 6 6 6 6
tA= 0 t1 t2 t3 tB= 1
a b c d e
b c d e f
c d e f g
d e f g 0
-4 vA
e f g 0 1
f g 0 1 2
g 0 1 2 3
4 vB
4 4 4 4 4
5 5 5 5 5
6 6 6 6 6
C(p, ω) = M(pA , pB ). tA= 0 t1 t2 t3 tB= 1
(d) Alternative Path
Figure 4: Path interpolation in the occluded regions with one object stationary. (a) and (b) shows a scene with two objects, foreground represented by alphabets and background represented by numbers. The background is stationary whereas the foreground is moving to the left. As a result, the region 0123 is visible in image B but not in A. (c) shows one of the plausible paths for this pixel along with the assigned flows by the path. A low cost path exists even for the occluded pixels. The path computes the forward flow whereas the backward flow is not defined. (d) shows another alternate path at p. Note that both paths are the same except for the transition point.
computes the forward or backward flow, or both, whenever they exist. Fortunately, we can also use this property to robustly identify the occluded regions (Sec. 4.3). 3.4 Gradient/Poisson Reconstruction One of the main features of our algorithm is that we do the interpolation in the gradient domain. Once we have computed the plausible path at pixel p, we move the pixels along this path, copying their gradient values to get the spatial gradients at p for the interpolated frames. Temporal gradients at p can be computed by finding the difference in intensity values between two successive pixels that move along this path. The gradient computation is discussed in more detail in Sec. 4.4. We then do 3D Poisson reconstruction from the computed gradients to get the interpolated frames. 3D Poisson reconstruction avoids local artifacts (e.g., at the transition points) as the error is distributed among all the interpolated frames both spatially and temporally. Moreover, since it computes the image whose gradient is closest in the l 2 -norm, it helps to preserve the edges better and hence reduce blurring. To our knowledge, ours is the first work that does image interpolation in the gradient domain.
4
Optimization for Paths: Computing Transition Point
Correspondence (Local Cost): It is critical that the two images should agree or match at the transition point. For a path ω at p, we define its cost C(p, ω) as
e f g 0 1 2 3 4 5 6
Image A
b c d e f
4.2
Once we have defined our paths, it is easy to modify the standard matching and energy functional methods for stereo and optical flow.
Front Plane
Front Plane
a b c d e f g
a b c d e
...................
Implementation
We have presented the notion of a generalized path with an extra degree of freedom to arbitrarily transition between the images. We will now discuss the implementation of our algorithm and explain in detail the various steps of Sec. 3. Secs. 4.1-4.4 correspond to the components discussed in Secs. 3.1-3.4. 4.1 Path Computation: Basic Set Up Let L denote the finite set of all possible discrete paths. If we allow arbitrary motions, L becomes very large. Hence, we do our path computation hierarchically. We construct the Gaussian pyramid of our input images and perform our path computation at the coarsest level. We then use the paths from the coarser level to construct the set L of possible paths at the next finer level. We double the total length of the path at the next finer level, and allow a shift of one pixel to enable the path length to be an odd number. However, we still allow the transition point to be arbitrary. This greatly reduces the size of L, making the interpolation feasible for large motions.
(3)
M(pA , pB ) is a measure of how well images A and B match at transition points pA and pB . Note that in view interpolation pA and pB are the image points which in general correspond to the same 3D surface point. In order to compute the matching cost we define q(pA , pB ) to be the weighted sum of color matching and gradient matching terms [Brox et al. 2004]. q(pA , pB ) =k ∇A(pA ) − ∇B(pB ) k2 +0.5 k A(pA ) − B(pB ) k2 , (4) where ∇ represents the gradients in the image domain. Note that if we double the intensities in the two images, the matching cost increases by a factor of 4. We would like the cost to be independent of large gradient intensities in A and B versus the small ones. We define σ (pA ) to be the standard deviation of pA in image A from its neighboring pixels pN . Similarly, we evaluate σ (pB ). We define a normalized metric q0 (pA , pB ), s q(pA , pB ) 0 q (pA , pB ) = . (5) σ (pA )σ (pB ) Note that the term inside the square root is similar to the normalized cross correlation (NCC) [Gonzalez and Woods 2002] except that we compute it with respect to neighboring pixels only rather than over a window. To further encourage good matches only, we also raise q0 to a large power, such as M(pA , pB ) = (q0 (pA , pB ))α .
(6)
The function works for a wide range of values of α and we use α = 8 in Figs. 1, 14 and 15. We have observed that other matching functions can also be used without affecting the quality. One such function that we use in Figs. 6, 7, 8, 9, 12 and 13 is M(pA , pB ) = exp(q0 (pA , pB )) − 1.
(7)
Coherency: The cost C is a per-pixel function and solves for the path separately at every pixel. However, we would expect the neighboring pixels to have similar motions and hence similar paths. Moreover, there are uncertainties in paths in the texture-less regions and hence we need a coherency term to regularize them. We introduce a pairwise smoothness prior cost V (ω, ωN ) between the respective paths ω and ωN at the two neighboring pixels p and pN .3 Every path has a length d =| mA + mB | and direction vˆA = vˆB associated with it. We define V (ω, ωN ) as V (ω, ωN ) = min(| d vˆA − dN vˆAN |, δ ),
(8)
where δ is a discontinuity preserving threshold. The value of this parameter for various examples in the paper is shown in Fig. 11. Note that the coherency cost puts constraints only on the path lengths and directions of two neighboring pixels but not on the transition points. The neighboring pixels can still have arbitrary transition points very different from each other. Global objective function: Since the coherency term V (ω, ωN ) involves pairwise pixels, we need to solve the interpolation globally. We define a global energy function E for interpolation that we need to minimize. E is the sum of the path cost C (Eq. 3) for all the 3p N
refers to the 4-neighborhood of p
E = ∑ C(p, ω) + λ ∑ ∑ V (ω, ωN ), p
(9)
p pN
where λ is the regularization parameter and controls the contribution of the coherency cost relative to the path cost. We have found that our method works well over a broad range of λ . Energy minimization: Since the set of possible discrete paths L is finite, we can use any suitable global optimization technique from the minimization literature. The energy function in Eq. 9 can be minimized using a fast iterative expansion algorithm based on graph-cuts ( [Boykov et al. 2001; Kolmogorov and Zabih 2001]). The algorithm is guaranteed to terminate in | L | iterations, finding a strong local minimum of the energy. In our case, we found that the algorithm generally terminates in 5 − 10 iterations.
-4 -4 -4 -4 -4 -4 -4 a b c d e f g b c d e f g 0 c d e f g 0 1 d e f g 0 1 2 e f g 0 1 2 3 4 4 4 4 4 4 4
0 0 0 vA 4 5 6 t =0 4 5 6 t 4 5 6 t 4 5 6 t 4 5 6 t =1 0 0 0 vB A 1 2
3
B
(a) Flows Assigned By the Paths
-4 -4 -4 -4 -4 -4 -4 0 0 0 vA a b c d e f g 4 5 6 t =0 b c d e f g 0 4 5 6 t c d e f g 0 1 4 5 6 t d e f g 0 1 2 4 5 6 t e f g 0 1 2 3 4 5 6 t =1 4 4 4 4 4 4 4 0 0 0 vB A 1 2
Note that because of the extra degree of freedom due to transition points, our optimization involves 3 variables (mA and mB are general 2D vectors, but constrained to have the same direction). In contrast, optical flow requires 2 variables.4 As a result, our method is expected to perform slower than the standard optical flow methods. Also note that we find paths only to one pixel accuracy leading to coarse computation of the flow. In practice, we found this sufficient for visually plausible interpolation. 4.3
Occlusion Handling
As discussed earlier in Sec. 3.3 and Figs. 4c and d, a plausible path is found even in the occluded regions. Moreover, as we now show, our method can detect the occlusions as a simple post-processing step, and correct the paths accordingly. We again consider the moving foreground against the static background scene discussed in Fig. 4. Figure 5a shows the forward (vA ) and backward (vB ) flows at different pixels derived (using Eq. 2) from the computed paths. Note that wherever the flow exists, our path framework is able to compute it. However, the backward flow is not defined in the occluded region 0123. We now present a postprocessing algorithm to detect these regions. Forward flow verification: Consider a pixel p in the occluded region. We project p in image A to p f in image B shown by the green line in Fig. 5b. Since p in image A and p f in image B both belong to the foreground, we have vA (p) = −vB (p f ). Hence, we mark vA (p) as a consistent flow. Note that our verification matches flows, not pixel intensities, at these locations. Backward flow verification: We project p in image B to pb in image A using vB (p) shown by the red line. Since p in image B belongs to the occluded region whereas pb in image A belongs to the background, vB (p) 6= −vA (pb ). Hence, we mark vB (p) to be not defined. Occlusion labeling: We repeat the process for all the pixels in the images and get the markings shown in Fig. 5c. Only the flows in the occluded regions shown by red lines are labeled by a cross. We mark these pixels as occluded (red in Fig. 5d).
3
B
are occlusion labels also in some stereo and optical flow optimizations, but these are binary labels only.
1 2
3
B
pf
X X X X
-4 -4 -4 -4 -4 -4 -4 0 0 a b c d e f g 4 5 b c d e f g v3 =4 -45 A c d e f g 2 3 4 5 d evB f= 0g 1 2 3 4 5 e f g 0 1 2 3 4 5 4 4 4 0 0 0 0 0 0 (e) Our Interpolation
pX
(b) Flow Verification
-4 -4 -4 -4 -4 -4 -4 a b c d e f g b c d e f g 0 c d e f g 0 1 d e f g 0 1 2 e f g 0 1 2 3 4 4 4 ? ? ? ?
0 0 0 vA 4 5 6 t =0 4 5 6 t 4 5 6 t 4 5 6 t 4 5 6 t =1 0 0 0 vB A 1 2
3
B
X X X X
(c) Incorrect Flow Detection
0 6 6 6 6 6 0
vA tA= 0
(d) Occluded Region
-4 -4 -4 -4 -4 -4 -4 0 0 0 vA a b c d e f g 4 5 6 tA= 0 b c d e f g 3 4 5 6 Boundary c d e f g 2 3 4Point 5 6 d e f g 1 2 3 4 5 6 e f g 0 1 2 3 4 5 6 tB= 1 4 4 4 0 0 0 0 0 0 0 vB
t’ tB= 1
vB
(f) Corresponding Path
Figure 5: Occlusion detection for the static background case. (a) shows the forward flow (vA ) and backward flow (vB ) assigned by our method for all the pixels. (b) shows the verification process at a pixel p by projecting the flows to the other image and checking their consistency. As a result, we know that the backward flow in image B is not defined. (c) shows the verification process for all the pixels. Note the mismatching (red lines) of the background pixels. These pixels are then labeled as occluded (d). (e) shows our interpolation at an occluded pixel. We interpolate using forward flow till we reach the boundary point R at time t 0 . We then start interpolating using the backward flow. (f) shows the path corresponding to this interpolation. The transition occurs at the boundary point in A. Note that the two images no longer match at the transition point.
4.3.1
Assigning Flows to the Occluded Pixels
So far we have only identified the occluded regions. We still need to assign flows to them for interpolation. We assume that the occluded region has one of the two flows responsible for occlusion, the foreground (alphabets, vB = 4) or the background (numbers, vB = 0). We also assume that the occluded region as a whole is consistent and takes the flow which majority of pixels want to take. To determine whether the occluded region is part of the foreground or background, we match pixel intensities, assuming that background pixels will match more closely with the background. Our method is robust, since we match the whole area together, rather than individual pixels separately. In practice, we have found that this algorithm works well for most of our test scenes except in the texture-less regions where the visual quality of interpolation is not affected by the wrong flows. The same analysis holds for the general occlusion case, with both objects moving, and is discussed in the appendix. 4.3.2
4 There
A
ion
Discussion: Note that our energy functional is simple with just matching and coherency terms. We need not consider the occlusions in our optimization. This is different from most stereo and optical flow algorithms, where occluded regions are either considered as outliers or the occlusion labels are used explicitly in the optimization. This make their energy functional more complex.
pb
p
-4 -4 -4 -4 -4 -4 -4 0 0 0 vA a bMatch c d e f g 4 5 6 t =0 b c d e f g 0 4 5 6 t c d e f g 0 1 4 5 6 t No match d e f g 0 1 2 4 5 6 t e f g 0 1 2 3 4 5 6 t =1 4 4 4 4 4 4 4 0 0 0 vB
Tr an sit
pixels in the image and the pairwise coherency cost V (Eq. 8) for every pair of neighboring pixels. Thus,
Paths in Occluded Regions
Now that we know the flows in the occluded regions also, we can estimate the path in these regions. The paths need to be recomputed
Ground Our Spatially Truth Method Variant
Backyard - Our Interpolation
JIF Reg
TV-L1- Graph Learning Horn & Flow 2D-CLG F-TV-L1 Schunck Fusion Improved Cuts
CBF
Zoom Ups (Low Resolution Images From Middlebury Website)
Figure 6: Comparison with optical flow algorithms from Middlebury website on Backyard dataset. We show the interpolated image generated using our technique, the zoom-ups of the marked region along with the ground truth and the top ten optical flow methods from the website on these images. Note that we are able to preserve the ball and prevent ghosting artifacts whereas all other methods split it in two. A slight blurring can be seen near the occlusion boundary in our method, since we are not computing sub-pixel flows. Ground Truth
Fusion
Dumptruck - Our Interpolation
Our Method
Spatially Variant
JIF - Reg
F-TV-L1
TV-L1-Improved
Graph Cuts
Learning Flow
2D-CLG
Horn & Schunck
CBF
Zoom Ups (Low Resolution Images From Middlebury Website)
Figure 7: Comparison with optical flow algorithms from Middlebury website on Dumptruck dataset. We show the brightness enhanced zoom-ups of the marked region along with the ground truth and top ten optical flow methods from the website on these images. We are able to handle occlusions well and preserve the frequency content. Note the blurring of tires and the ghosting on the back window visible in other methods.
at the pixels where forward flow (vA ) and backward flow (vB ) are incompatible. Consider one such pixel p in Fig. 5e. We follow interpolation with forward flow (shown in red) till we reach the boundary point at time t 0 . Note that we can easily determine the boundary in A as the point where the forward flow changes. We then directly go over to occluded pixel p in image B. The correct path is shown in Fig. 5f. The path estimation for the general occlusion case, with both regions moving, is shown in the appendix. 4.4 Moving Gradients For Interpolation Once we have found the visually plausible path ω at pixel p = (x, y), we can find the k interpolated values (intermediate frames) I(p,t), t = 0 : k − 1 at p by moving the pixels in k uniform steps along this path and copying their values at p. We would like to point out that k is a variable. Once we have a path, we can discretize into any number of steps and hence can produce a continuous interpolation at any frame rate. In order to copy values from the sub-pixel locations (due to division of path in k uniform steps), we use bilinear interpolation. Instead of interpolating the intensities we actually interpolate the gradients. As discussed earlier, working in the gradient domain preserves edges better. Let G(p,t) = (Gx , Gy , Gt ) denote respectively the x, y and temporal gradient of the interpolated frames that we want to estimate from the paths. The spatial gradients (Gx , Gy ) can be computed by copying the gradients in image A and B as we move along the path. The temporal derivative Gt (p,t) can be found by computing the rate of change of intensities in the images A and B in the direction of the path as we move along it.5 Once we get the derivative field G, we solve the 3D Poisson equation [Wang et al. 2004] ∇2 I = ∇·G,
(10)
2 2 2 where ∇2 I = ∂∂ x2I + ∂∂ y2I + ∂∂t 2I is the Laplacian operator and the gra∂G dient ∇·G = ( ∂∂Gxx + ∂ yy + ∂∂tGt ) is the divergence operator, with the
5 In order to incorporate the effect of discretization of the path into k steps, we actually scale the temporal derivative Gt by k−1 d where d is the path length.
boundary conditions, I(p, 0) = A
5
I(p, k − 1) = B.
(11)
Evaluation
We now evaluate different aspects of our technique. We will first compare it with the state-of-the-art optical flow based interpolation algorithms. We will then discuss the importance of various aspects of our algorithm such as arbitrary transition point, robust occlusion handling and working in the gradient domain. 5.1 Comparison with Optical Flow Our method has several advantages over standard optical flow techniques for interpolation. Figures 6 and 7 show our interpolation result on two of the images from the optical flow datasets available at http://vision.middlebury.edu/flow/. The website contains results and evaluations of the state of the art optical flow algorithms [Baker et al. 2007] and has been widely accepted as a benchmark for these methods. While their primary focus, and that of most algorithms, is on evaluating the flow itself, interpolated images are also available.
Since our aim is to do visually plausible interpolation, we focus on the qualitative analysis. The publicly available portion of the website provides a low-resolution version of ground truth and results from various optical flow methods, that suffices for a direct visual comparison. In general, we find that our method provides visually superior interpolation with minimal artifacts in most cases, although the quantitative flow does not yet match the accuracy of other methods (nor is this our goal). In Figs. 6 and 7, we show our interpolation results, and zoom-ups in interesting areas, to compare to ground truth, and the top ten optical flow algorithms in terms of the numerical error from the website. For the backyard scene (Fig. 6), with a ball dropping rapidly on the left, no other method is able to keep the ball together, without splitting into two. On the other hand, we are able to avoid the ghosting as well as handle most of the occlusions near the ball accurately. A few blurring artifacts can be seen near the occlusion edges, because there is a one pixel ambiguity in locating the occlusion boundaries (including sub-pixel matching in our technique would likely resolve this in future). Similarly, in Fig. 7, we are able to handle complex
(b)
(c)
(d)
(e)
(f)
Row1
(a)
Our Method
Jif-Reg F-TV-L1 (Anonymous) (Wedel et. al 2008)
Basketball Dataset (Middlebury Website)
Row 3
Row2
Ground Truth
Figure 8: Middlebury’s basketball dataset. This is a difficult case which violates our two region occlusion assumption near the hand. There are three regions involved in occlusions near the hand: ball, hand and background. Note that other methods also do not perform well on this example.
occlusions between the cars and truck, as compared to other algorithms. Note the blurring of the tire and ghosting artifacts on the back window of the car visible in other methods. Note that large regions of the image such as the background will have small motion without significant occlusions. In these regions we expect optical flow algorithms to perform quantitatively better since they compute flows to sub-pixel accuracy. However, the interpolated images produced by optical flow and our method are identical qualitatively in these simple regions. Our major benefits are in areas with large motion and occlusions, e.g., the ball in Fig. 6. In these regions the optical flow interpolation has visual artifacts whereas we are able to preserve the visually salient features. Figure 8 shows a complicated example from the Middlebury dataset where our assumptions are violated. The occlusions with the hand are complex since there are three contributing regions instead of two: hand, background and ball. Note that these regions are difficult for any algorithm, and violate the assumptions of most optical flow techniques. Our results are thus comparable to other methods. 5.2
Evaluation of Components: Transition points, Occlusion handling and Poisson blending
Our algorithm involves a few simple, yet critical and novel design decisions such as arbitrary transition points, robust occlusion handling, and working in the gradient domain. In order to show the importance of each step, we add these features incrementally. Figure 9 shows zoom-ups of the regions of the backyard scene in Fig. 6, along with a table showing which features are being added. Figure 9a shows images with fixed transition (in the middle of the path), no gradient blending and no explicit occlusion handling. Note that there are lots of artifacts. Allowing for arbitrary transition points (Fig. 9b) considerably improves image quality, especially in Row 3. Similarly, doing Poisson blending (Fig. 9c) gives better results, e.g. in Rows 1 and 2. However, note that there are still artifacts. In Fig. 9d, we allow both for arbitrary transition points as well as Poisson blending. This further improves the interpolation quality, especially in Row 2. Note the improvement in the high frequency artifacts on the leg (Fig. 9b) and missing foot (Fig. 9c). However, the ball in the top row is properly handled only when we turn on the post-process occlusion handling (Fig. 9e which focuses on transition points and occlusions, while turning off the Poisson blending). Figure 10 shows the occlusion map we compute using our post-process occlusion handling. The blue color shows the occluded regions. Note that occlusions near the ball and other edges are detected correctly. Finally, in the right-most column (Fig. 9f),we switch on all our features and get better quality interpolation. Thus, all three steps (flexible transition points, occlusion handling, and working in the gradient domain) play a crucial role.
(a)
(b)
Transition Occlusions Poisson
(c) (a)
x x x
(b)
x x
(d) (c)
x x
(d)
x
(e) (e)
(f) (f)
x
Figure 9: Importance of different steps of our technique. As shown in the table, we incrementally add various features of our method in the backyard scene of Fig. 6 to show their importance. Note that transition point, occlusion handling and Poisson reconstruction all play a crucial role in removing artifacts from the interpolation, and hence are crucial for our method.
Occlusion Maps
Figure 10: Occlusion maps computed using our post-processing. The occluded regions are shown in blue. Note that occlusions near the ball and other edges are detected correctly
6
Applications
We now show a wide range of applications that can be handled by our method: view interpolation, temporal interpolation of video sequences with complex non-rigid motions, and the animation of still images. The values of various parameters and image resolution for these and other examples in the paper are shown in Fig. 11. 6.1 View Interpolation Figure 12 shows interpolation between two different views of an elephant figurine. The maximum disparity or motion between the images is 30 pixels, more than most of the previous view interpolation techniques. Figure 12a shows one of the intermediate frames generated using our method. Figure 12c shows a zoom into the trunk. For evaluation purposes, we skipped a number of frames between the input images in the original database, comparing the closeup of our result (Fig. 12c) with the ground truth (Fig. 12d). We preserve the spatial frequencies of the input images. We can handle comparatively larger disparity with better occlusion handling as compared to the current methods for two input images. 6.2 Temporal Interpolation of Videos One of the main applications of our framework is temporal upsampling and interpolation of video sequences. In many scenarios, especially when the original frame rate is lower, interpolated videos where the scene varies slowly and smoothly are visually more pleasing. Typically a video contains complex non-rigid motion and most of the current optical flow algorithms fail to interpolate these effects correctly if the motions are large between the frames. Although our method interpolates between only two images, we can actually do a full sequence by interpolating between successive video frames.
Example Wink (Figs. 1, 14) Elephant (Fig. 12) Milk Video (Fig. 13) Cat (Fig. 15) Middlebury (Figs. 6-8)
Resolution 270 × 270 643 × 525 420 × 220 295 × 164 480 × 640
λ 10 5 5 10 5
δ 20 2 2 20 2
Pyramid Levels 1 3 2 2 3
Figure 11: Parameter values for the examples.
(b) Input Images
(a) Our View Interpolation
(c) Our Method
(d) Ground Truth
Figure 12: Figure showing view interpolation between two images using our method. The interpolated frame (a,c) computed using our method matches closely with the ground truth (d), preserving the spatial frequencies of the input images (b). We are also able to handle occlusions properly at most of the occlusion boundaries, with only a few artifacts near the left ear.
Figure 13 shows the interpolation between two frames of a video sequence with fixed viewpoint. This is a challenging sequence involving complex non-rigid motions. For evaluation purposes, we used the first and third frames (Figs. 13a and b), generating and comparing our result (Figs. 13c and e) to the actual second frame (ground truth, Fig. 13d). Note that the interpolated frame generated using our method matches very closely with the ground truth. We also used the commercial implementation in Adobe Aftereffects (Fig. 13f), an optical flow algorithm similar to [Brox et al. 2004] (Fig. 13g) and simple linear blending (Fig. 13h) of the input images for interpolating these frames. These methods lead to ghosting and other artifacts near the occlusion edges. In comparison, our interpolation does not suffer from serious ghosting artifacts and also handles occlusion edges correctly. For this sequence, we insert 8 intermediate frames to slow down the video 9 times and allow for smoother playback. 6.3 Animating Still Images Given two still images, animating them is a hard and underconstrained problem. Consider the two images of a face in Fig. 1. Going from normal (Fig. 1a) to a smiling and winking face (Fig. 1c) involves complex local deformations of the skin (e.g., dimple formation) and is in general very difficult to capture from just two images automatically. Image morphing techniques can be used, but they are not automatic and require user-specified correspondences.
Figure 1b shows the three intermediate frames produced by our method. We are able to capture the local deformations to produce a plausible interpolation of the face. The smooth animation, shown in the accompanying video, looks very natural. Figure 14 shows the interpolation between four different face emotions – normal, smile, wink, and wink plus smile. Assuming these four faces to be the vertices of a square, we can find any face emotion within the square by first using the input images to interpolate along the edges and then interpolating the interpolated frames themselves. In the figure, we show three interpolated faces within the square and the interpolation looks plausible. Figure 15 shows the interpolated frames for a yawning cat. This is a challenging example since artifacts like blur are easily noticeable on textures like fur and wood. Our method produces reasonable interpolation and the animation looks quite natural. A few blurring
artifacts near the whiskers and tongue are due to the fact that these features are not clearly visible in the input image A.
7
Conclusions and Future Work
We have presented a method for the plausible interpolation of images. We move gradients in the input images along a general linear path with arbitrary transition points between the images, to solve simultaneously for all the intermediate frames and produce temporally consistent interpolation. Our path framework also allows us to correctly address many of the common occlusion effects in a relatively easy and deterministic manner. We can handle complex non-rigid motions, different viewpoints and animate still images. We also preserve the frequency content of the original images and do not suffer from artifacts like ghosting and blur. In the future, we would like to increase the generality of our path framework. We would like to extend our path framework to interpolate other visual data like light fields and images with different illuminations for light transport computations. One of the potential ways to do this is to find some intrinsic decomposition/representation of the images, e.g., separation of diffuse and specular components and interpolate these components separately. We would also like to generalize our occlusion framework to handle more complex effects and boundaries involving more than two layers of motion. Image interpolation is a problem of significant interest in both computer graphics and computer vision. In this paper, we have introduced a novel path-based algorithm, based on moving gradients, with a wide range of applications. Our method, may be relevant in many other applications such as finding correspondences for stereo and optical flow with occlusion detection. In summary, we believe our work to be a significant step towards addressing the long-standing problems of temporal interpolation of video sequences, view interpolation, and animation of still images.
Acknowledgements This work was supported in part by an ONR Young Investigator Award N00014-07-1-0900 on Mathematical Models of Illumination and Reflectance for Image Understanding and Machine Vision, and a generous gift from Adobe. We also acknowledge NSF grants (CCF 03-03522, 03-25867, 04-46916, 05-41259, 07-01775), a Sloan Research Fellowship, and equipment donations from Intel and NVIDIA. We also acknowledge Peter Sand for running the optical flow comparisons and the reviewers for providing their valuable feedback on the work.
References AGARWALA , A., D ONTCHEVA , M., AGRAWALA , M., D RUCKER , S., C OLBURN , A., C URLESS , B., S ALESIN , D., AND C OHEN , M. 2004. Interactive digital photomontage. ACM Trans. on Graphics (SIGGRAPH 2004) 23, 3 (aug), 294–302. A LVAREZ , L., D ERICHE , R., PAPADOPOULO , T., AND S ANCHEZ , J. 2007. Symmetrical dense optical flow estimation with occlusions detection. Int. Journal of Computer Vision 75, 3 (December), 371–385. BAKER , S., S CHARSTEIN , D., L EWIS , J. P., ROTH , S., B LACK , M. J., AND S ZELISKI , R. 2007. A database and evaluation methodology for optical flow. In Proc. IEEE Int. Conf. Computer Vision, 1–8. BARRON , J., F LEET, D., AND B EAUCHEMIN , S. 1994. Performance of optical flow techniques. Int. Journal of Computer Vision 12, 1, 43–77. B ELHUMEUR , P., AND M UMFORD , D. 1992. A bayesian treatment of the stereo correspondence problem using half-occluded regions. Proc. IEEE Conf. Computer Vision and Pattern Recognition, 506–512. B LACK , M., AND A NANDAN , P. 1996. The robust estimation of multiple motions: Parametric and piecewise-smooth flow-fields. Computer Vision and Image Understanding 63, 1 (January), 75–104.
(a) Input Image A
(b) Input Image B
(c) Interpolated Image - Our Method
(d) Ground Truth (e) Our Method (f) Adobe Aftereffects (g) Optical Flow (h) Linear Blending Figure 13: Temporal interpolation of a video sequence. (c) shows one of our interpolated frames between two input frames (a) and (b). While we show only a single frame above, we are solving simultaneously for 8 intermediate frames. For purposes of evaluation, we used the first and third frames of the sequence, generating and comparing the closeup of our result (e) to the actual second frame (ground truth) (d) of the sequence. This is a challenging video sequence involving complex non-rigid motions, and previous methods such as the commercial implementation in Adobe Aftereffects (f), an optical flow algorithm similar to Brox et al. 2004 (g) and simple linear blending (h) lead to ghosting and other serious artifacts. Normal
Wink
Smile
Wink + Smile
Figure 14: Animation of face emotions. We interpolate between four different face emotions – normal, smile, wink, and wink plus smile. Assuming these faces to be the vertices of a square, we can find any face emotion within the square. We show three such faces and the interpolation looks plausible.
Input Images Input Image A Interpolated Frames - Our Method Input Image B Figure 15: Animation of a yawning cat. This is a challenging sequence since artifacts like blurring are easily noticeable on textures like fur and wood. We show two of the interpolated frames generated using our method. We are able to animate the sequence, making it look natural.
B OYKOV, Y., V EKSLER , O., AND Z ABIH , R. 2001. Fast approximate energy minimization via graph cuts. IEEE Trans. Pattern Analysis and Machine Intelligence 23, 11, 1222–1239. B ROX , T., B RUHN , A., PAPENBERG , N., AND W EICKERT, J. 2004. High accuracy optical flow estimation based on a theory for warping. In Proc. European Conf. Computer Vision, vol. 3024, 25–36. C HEN , S., AND W ILLIAMS , L. 1993. View interpolation for image synthesis. In Proc. SIGGRAPH 93, 279–288. F ITZGIBBON , A. W., W EXLER , Y., AND Z ISSERMAN , A. 2003. Imagebased rendering using image-based priors. In Proc. IEEE Int. Conf. Computer Vision, 1176–1183. G EIGER , D., L ADENDORF, B., AND Y UILLE , A. 1992. Occlusions and binocular stereo. In Proc. European Conf. Computer Vision, 425–433. G ONZALEZ , AND W OODS. 2002. Digital Image Processing. Prentice Hall Inc. J IA , J., AND TANG , C. 2008. Image stitching using structure deformation. IEEE Trans. Pattern Analysis and Machine Intelligence 30, 4, 617–631.
J IA , J., S UN , J., TANG , C., AND S HUM , H. 2006. Drag-and-drop pasting. ACM Trans. on Graphics (SIGGRAPH 2006) 25, 3 (jul), 631–637. KOLMOGOROV, V., AND Z ABIH , R. 2001. Computing visual correspondence with occlusions using graph cuts. Proc. IEEE Int. Conf. Computer Vision, 508–515. K WATRA , V., S CHÖDL , A., E SSA , I., T URK , G., AND B OBICK , A. 2003. Graphcut textures: Image and video synthesis using graph cuts. ACM Trans. on Graphics (SIGGRAPH 2003) 22, 3 (July), 277–286. M C M ILLAN , L., AND B ISHOP, G. 1995. Plenoptic modeling: An imagebased rendering system. In In Proc. SIGGRAPH 95, 39–46. M ÉMIN , E., AND P ÉREZ , P. 2002. Hierarchical estimation and segmentation of dense motion fields. Int. Journal of Computer Vision 46, 2, 129–155. P ÉREZ , P., G ANGNET, M., AND B LAKE , A. 2003. Poisson image editing. ACM Trans. on Graphics (SIGGRAPH 2003) 22, 3 (jul), 313–318. S CHARSTEIN , D., AND S ZELISKI , R. 2002. A taxonomy and evaluation of dense two-frame stereo correspondence algorithm. Int. Journal of Computer Vision 47, 1, 7–42.
s
pr
-7 -7 -7 -7 -7 -7-7 -7 -7 -3 -3 -3 -3 -3 vA a b c d e f g h i j 4 5 6 7 tA b c d e f g h i j 3 4 5 6 7 c d e f g h i j 3 4 5 6 7 8 d e f g h i j 2 3 4 5 6 7 8 e f g h i j 2 3 4 5 6 7 8 9 f g h i j 1 2 3 4 5 6 7 8 9 g h i j 1 2 3 4 5 6 7 8 9 10 h i j 0 1 2 3 4 5 6 7 8 9 10 tB 7 7 7 7 7 7 7 7 7 3 3 3 3 3 v
p
(a) Possible Paths
B
r
q
s
X X X
q
-7 -7 -7 -7 -7 -7-7 -7 -7 -7 -3 -3 -3 -3 vA a b c d e f g h i j 4 5 6 7 t A b c d e f g h i j 3 4 5 6 7 c d e f g h i j 3 4 5 6 7 8 d e f g h i j 2 3 4 5 6 7 8 e f g h i j 2 3 4 5 6 7 8 9 f g h i j 1 2 3 4 5 6 7 8 9 g h i j 1 2 3 4 5 6 7 8 9 10 h i j 0 1 2 3 4 5 6 7 8 9 10 tB 7 7 7 7 7 7 7 7 7 3 3 3 3 3 vB
-7 -7 -7 -7 -7 -7-7 -7 -7 -3 -3 -3 -3 -3 vA a b c d e f g h i j 4 5 6 7 b c d e f g h i j 3 4 5 6 7 c d e f g h i j 3 4 5 6 7 8 d e f g h i j 2 3 4 5 6 7 8 e f g h i j 2 3 4 5 6 7 8 9 f g h i j 1 2 3 4 5 6 7 8 9 g h i j 1 2 3 4 5 6 7 8 9 10 h i j 0 1 2 3 4 5 6 7 8 9 10 7 7 7 7 7 7 7 7 7 3 3 3 3 3 vB X X X X X X X
s
r
X X X X
r q (b) Flow Verification
s r q (c) Connected Component Analysis
Figure 16: General occlusion case. (a) shows two objects, foreground represented by alphabets and background represented by numbers both moving in the same direction. The pixel p has different forward (vA = −7) and backward flow (vB = 3). However both pixels have well defined correspondences. As a result, two possible paths corresponding to these flows exist (shown in green and blue). (b) shows the verification process discussed in Fig. 5 for these regions. Due to existence of pixels like p in (a), pixels shown by blue crosses are labelled inconsistent although they have correspondence in the other image. (c) shows that these regions in image A and B form a single connected components q − s, and, since | q − r || r − q |, we conclude that the occluded region belongs to Image B and hence remove the cross from pixels in image A. We then run a local optimization to assign the correct flow to these pixels in image A and correct the corresponding pixels in image B. In the end, we are left only with the occluded region in image B. Path near the occluded region: Figure 17a shows our interpolation for the general case. In this case once we reach the boundary point, 0 we project the point (p,t ) to image B using backward flow and start moving towards p in image B with this flow (shown in green). The corresponding corrected path is shown in Fig. 17b. Note that at transition point, pixels no longer match because of discontinuities. Hence we are able to interpolate the occlusions correctly. Finite width objects: We can do a similar analysis for finite width objects where the motion of the object is greater than its dimensions. In this case the foreground moves over a background pixel p and passes over it due to finite width. As a result, p in both the images belongs to the background and is assigned the background flow with no occlusions. Hence we interpolate at p using only backward flow and hence in some intermediate frames where foreground passes over it we do not interpolate correctly. Our path framework allows us to detect such pixels in the intermediate frames by projecting the foreground flow and detecting its compatibility with the flow assigned by our path framework at the intermediate pixels.