1988
IEEE TRANSACTIONS ON POWER DELIVERY, VOL. 26, NO. 3, JULY 2011
A Hybrid Framework for Fault Detection, Classification, and Location—Part I: Concept, Structure, and Methodology Joe-Air Jiang, Member, IEEE, Cheng-Long Chuang, Member, IEEE, Yung-Chung Wang, Chih-Hung Hung, Jiing-Yi Wang, Chien-Hsing Lee, Senior Member, IEEE, and Ying-Tung Hsiao, Member, IEEE
Abstract—Bridging the gap between the theoretical modeling and the practical implementation is always essential for fault detection, classification, and location methods in a power transmission-line network. In this paper, a novel hybrid framework that is able to rapidly detect and locate a fault on power transmission lines is presented. The proposed algorithm presents a fault discrimination method based on the three-phase current and voltage waveforms measured when fault events occur in the power transmission-line network. Negative-sequence components of the three-phase current and voltage quantities are applied to achieve fast online fault detection. Subsequently, the fault detection method triggers the fault classification and fault-location methods to become active. A variety of methods—including multilevel wavelet transform, principal component analysis, support vector machines, and adaptive structure neural networks—are incorporated into the framework to identify fault type and location at the same time. This paper lays out the fundamental concept of the proposed framework and introduces the methodology of the analytical techniques, a pattern-recognition approach via neural networks and a joint decision-making mechanism. Using a well-trained framework, the tasks of fault detection, classification, and location are accomplished in 1.28 cycles, significantly shorter than the critical fault clearing time. Index Terms—Artificial neural networks (ANNs), fault detection, fault location, principal component analysis (PCA), support vector machine (SVM).
I. INTRODUCTION
Q
UALITY of power in transmission lines is these days considered a vital factor to achieve the continuity of service of electric power from power-generating plants
Manuscript received November 16, 2010; revised February 23, 2011; accepted April 02, 2011. Date of publication May 19, 2011; date of current version June 24, 2011. This work was supported in part by the National Science Council of Republic of China under contract NSC 96-2628-E-002-252-MY3. Paper no. TPWRD-00879-2010. Y.-T. Hsiao is with the Department of Digital Technology Design, National Taipei University of Education, Taipei 106, Taiwan (e-mail:
[email protected]. edu.tw). J.-A. Jiang, C.-L. Chuang, C.-H. Hung, and J.-Y. Wang are with the Department of Bio-Industrial Mechatronics Engineering, National Taiwan University, Taipei 106, Taiwan (e-mail:
[email protected];
[email protected];
[email protected];
[email protected]). Y.-C. Wang is with the Department of Electrical Engineering, National Taipei University of Technology, Taipei 106, Taiwan (e-mail:
[email protected]. tw). C.-H. Lee is with the Department of Systems and Naval Mechatronic Engineering, National Cheng Kung University, Tainan 701, Taiwan (e-mail:
[email protected]). Color versions of one or more of the figures in this paper are available online at http://ieeexplore.ieee.org. Digital Object Identifier 10.1109/TPWRD.2011.2141157
to their end users. A fault protection system has become fundamentally important due to its ability to prevent economical losses. The main purpose of a protection system is to process the voltage and/or current signals to determine whether a fault is present, to classify what kind of fault it may be, to estimate the fault location, and to take action to remove the fault from the power transmission-line system. The continuity service depends heavily on the possibility of detecting, classifying, locating, and isolating faults in the power transmission-line system [1], [2]. Conventional methods for relay to protect the transmission-line system were to monitor distortions in voltage and/or current signals in time and frequency domains [3]–[5]. In recent studies [6]–[8], these issues were solved in different ways, ranging from hardware implementation to new hybrid analytical approaches. Protection systems generally fit into three categories: quantitative model-based approaches, qualitative model-based approaches, and data-driven approaches. The quantitative model- and qualitative model-based approaches showed superior performance in the simulation studies. However, they delivered poor performance in case of the presence of noise in the fault voltage or current signals or led to uncertainties due to the variations of system parameters. Therefore, measurement and system noises are key factors that can affect the capabilities of these methods, resulting in high false positives or false negatives [9]. For real-world applications, data-driven approaches may be the most practical ones to make a protection system become more robust against noise due to their flexibility in implementation and adaptability in detecting and classifying faults in different systems. Therefore, the data-driven methods, such as artificial intelligence techniques, can be adapted to different systems with unknown levels of measurement and system noises, showing a possible solution when designing a protection system. Faults that occur in power transmission lines can cause an interruption of power supply, which leads two primary indices of the continuity service of power—system average interruption frequency index and system average interrupt duration index—to increase [10]–[12]. To lower these indices, various methods have been proposed to detect, classify, or locate faults in power transmission lines in recent years. It is also essential to classify the faults and identify which phases are involved. The features of faults have been extracted using various filters, such as fast Fourier transforms [13]–[17], Kalman filter [18], as well as fractal [19] and wavelet transforms [20]. For example,
0885-8977/$26.00 © 2011 IEEE
JIANG et al.: HYBRID FRAMEWORK FOR FAULT DETECTION, CLASSIFICATION, AND LOCATION—PART I
wavelet transforms and artificial neural networks (ANNs) have been successfully used to detect and classify faults in transmission lines [21]–[23]. A hybrid of wavelet transforms and support vector machines has been proposed to inspect fault zones in a power system [24]. In addition, model-based structural analysis has been applied to fault detection and location in power systems [25]–[27]. Most of the aforementioned works were validated via simulation studies and their actual performance tested in a real-world scenario still remains unknown. This is because the hardware implementation of fault protection techniques is rare; only a handful of studies reported field testing with hardware implementation [28]–[33]. These studies, however, accomplished only partial functions of a protection system. Moreover, the automation of a protection system can be achieved by combining all of the functions proposed by these studies in a system, but it may run into the problem of time consumption. In order to efficiently enhance the automation level of a power protection system, the main focus of this study is to propose a framework that can be implemented using the field-programmable gate array (FPGA) technology for real-world scenarios. In this paper, we present a hybrid framework that consists of a symmetrical component analysis for fault detection, a multilevel complex wavelet transformation, a principal component analysis, and a set of support vector machines and adaptive structure neural networks for fault classification and fault location. This work is presented in a series of two papers that focus on theoretical foundation and implementation, respectively. The main contributions of this series of two papers are summarized as follows. 1) A new framework is developed in this paper to detect the presence of fault in the transmission line. 2) The proposed framework calculates the fault location based on the measurement of postfault three-phase voltages and currents. 3) Since the impedance and load model may vary according to the actual condition of the transmission lines, the proposed framework uses an online-trainable neural network to estimate the fault location. 4) The proposed algorithm not only detects and classifies the fault type in the power system, but also estimates the fault zone and location between two buses. 5) This study provides the details of implementing the proposed hybrid framework using the field-programmable gate-array (FPGA) technology and the performance of the system is validated via hardware-based experiments. The framework enters power-efficient mode when there are no faults in the power system. The fundamental theories and mathematical principles of the proposed framework are presented in Section II where the system architecture of the proposed framework is introduced. Section III is devoted to a thorough explanation of the proposed fault detection, classification, and location algorithms. The system configuration for collecting prefault and during-fault data from the bus terminal is described in Section IV. Section IV also shows the results of software analysis by using the toolbox in MATLAB/Simulink [34]. In addition, the details of implementing the proposed framework using FPGA technology
1989
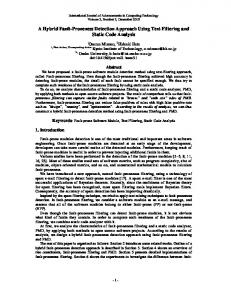
Fig. 1. Simplified physical model of the proposed hybrid framework.
and the performance of the framework tested in real-world scenarios will be presented in the following paper. II. PROPOSED HYBRID FRAMEWORK In this section, the proposed hybrid framework for fault detection, classification, and location is introduced from a systematic view. The overall architecture of the proposed protection system is illustrated in Fig. 1. The focus of this paper is on the numerical and mathematical models used in the proposed framework, detailed information regarding analog-to-digital conversion will be introduced in the following paper. In this paper, we assume that the fundamental frequency of the power system is 60 Hz. A sampling rate of 3840 Hz (64 samples/cycle, measured by advanced power measurement units) is chosen to extract signals from the transmission lines. Measurement units are installed at buses to obtain three-phase voltage and current signals. The acquired data are then transmitted to regional fault analysis stations via a wide-area-network (WAN) for fault detection, classification, and location. The regional fault analysis station is made by a FPGA-based stand-alone server. The recorded fault signals are organized into oscillographic records and diagnosis engineers at the utility company can have access to the records from the oscillographic server. Once the fault identification is completed, the system operators can use the diagnosis results to enhance the performance of the proposed hybrid framework. The FPGA-based stand-alone server is responsible for analyzing the voltage and current signals obtained from the buses. The proposed hybrid framework, as depicted in Fig. 2, involves three primary modules: 1) fault detection; 2) classification; and 3) location. This framework can analyze faults occurring between two buses that are equipped with measurement units. Specifically, the first step of the framework is to detect the presence of a fault in the power system in real time. Then, the method of symmetrical components is used to convert the three-phase power
1990
IEEE TRANSACTIONS ON POWER DELIVERY, VOL. 26, NO. 3, JULY 2011
be activated. On the other hand, if the fault detection module captures the feature of a fault, it will activate fault classification and fault-location modules. When a fault is detected, a multilevel wavelet transform (WT) is applied to the voltage and current signals in the most recent cycle. The feature of the signals can be obtained by principal component analysis (PCA). Since different types of fault can result in different principal component patterns, support vector machines (SVMs) are then utilized to identify the type of fault currently occurring in the power system. Finally, a fault-location module, which incorporates a two-stage adaptive structure neural network (ASNN), carries out the function of fault location. After the proposed framework completes the diagnosis procedures, if the fault location is within the protected section (as illustrated in Fig. 1), the protection system can take actions properly to reduce the damage caused by the fault. Otherwise, diagnosis results will be recorded for further analysis. III. MATHEMATICAL MODELS OF THE FRAMEWORK As shown in Fig. 2, the framework is composed of three different modules responsible for fault detection, classification, and location. Detailed mathematical models of each module are successively presented as follows. A. Fault Detection Module
Fig. 2. Architecture of the proposed hybrid framework for the protection system.
signals to three sets of independent components, which are positive, negative, and zero sequences. The negative-sequence component is calculated as a reliable indicator of the fault condition. If no fault is detected, the remaining part of the modules will not
In power transmission systems, the majority of voltage and current signal distortions are caused by faults. A fault may produce transient phenomena that cause unbalanced three-phase quantities in voltage and current signals. Many previously proposed methods, such as [21], [31], and [33], detect transient phenomena in the frequency domain. However, these phenomena can also be easily detected by symmetrical component analysis. The method of symmetrical components [35] is a simple method which is widely utilized to analyze unbalanced three-phase power systems. It is known that negative-sequence voltage and current are sensitive to signals from a fault or misconnection on a balanced or unbalanced three-phase system. Thus, they are widely used as an indicator of fault conditions in various applications [36]–[38]. Suppose that the three-phase voltages and currents are deand , where and noted by . The three symmetrical components for voltages and currents can be arranged into vectors as and , where subscripts 0, 1, and 2 represent the zero-, positive-, and negative-sequence components, respectively. In the proposed approach, the negative-sequence compoand currents nents of voltages are used as fault indicators. However, in case of unbalanced three-phase power systems, there are large contents of negative-sequence voltages and currents due to the unequal system impedances and unequal distribution of loads in each phase. In and , partial diforder to identify the variation in nonzero and with time by ferentiation is applied to and . Furthermore, differential negative-sequence voltages or currents require a simple convolution operation in order to lower the possibility of issuing false alarms. A joint
JIANG et al.: HYBRID FRAMEWORK FOR FAULT DETECTION, CLASSIFICATION, AND LOCATION—PART I
1991
Fig. 3. Triangular wave defined in (2). It is used in the convolution operation in (1) to stabilize the output of the proposed joint fault indicator.
fault indicator is thus designed to perform a more stable detection of fault occurrences, which can be formulated as follows:
(1) where time .
is the value of the joint fault indicator measured at is a triangular function that can be expressed by (2)
where is the Heaviside step function. The results of as a triangular function are depicted in Fig. 3. By using (1) and (2), the joint fault indicator is not only sensitive when a fault occurs, it also produces a stable fault alarm after a fault occurs. If reaches a value larger than 1 (obtained by the parameters in (2), that is, 0.01 100), it indicates that the fault detection module discovers the existence of a fault that occurs in the power system at time . It is worth mentioning that the proposed joint fault indicator is also robust against frequency deviation and amplitude variation caused by the variations of operating parameters in the power system. A 735-kV overhead transmission line with a 1500-MW simplified synchronous machine and other loads (around 3000 MW in total), a total length of 1000 km, has been simulated using ). MATLAB/Simulink software (base current 1 s, three-phase power transmission lines to ground When fault (ABC-G) are triggered at a location at a distance of 0.95 p.u. from the bus equipped with a phasor measurement unit (PMU). The resulting voltage and current waveforms are depicted in Fig. 4, showing the patterns of fault signals as well as negative-sequence voltages and currents. In Fig. 4(a) and 1.0034 s and (c), the main fault signals reach the bus at the values of negative-sequence voltages and currents begin increasing at the same time, which are depicted in Fig. 4(b) and (d). These values are not stable as faults exist, so they cannot be directly used as fault indicators. Furthermore, the joint fault 1.0035 s, as shown in indicator declares the fault when Fig. 4(e). This short response time (0.0001 s) and steady values of the joint fault indicator make it an effective trigger to activate fault classification and fault-location modules. These modules will be explained in the following subsections. B. Fault Classification Module After a fault has been detected, the proposed hybrid framework starts to measure the three-phase voltages and currents under the postfault and are then analyzed using condition over one cycle.
Fig. 4. Simulation of a three-phase power transmission line-to-ground fault (ABC-G). (a) The resulting voltage signals and (b) its corresponding negativesequence voltages. (c) Resulting current signals and (d) its corresponding negative-sequence currents. (e) The time course record of the joint fault indicator. In (a) and (c), the signals of different phases are depicted in different colors and line styles (i.e., phase-A in red dashed lines, phase-B in blue solid lines, and phase-C in green dotted lines).
the wavelet analysis, PCA and SVM, in the fault classification module. Detailed operations are presented as follows. 1) Wavelet Analysis: A multiresolution signal decomposition technique based on WT has been successfully applied to extract relevant information from signals in many fields, including transmission-line protection. WT is a mathematical theory associated with building a model for nonstationary signals using wavelets. The wavelets can be scaled and shifted to form a family of wavelets. WT provides a good tool to divide nonstationary and nonperiodic wideband signals in the time and frequency domains for feature extraction. In this study, a multilevel continuous WT (CWT) [39] is used and currents to analyze the signals of three-phase voltages . For example, the CWT of a continuous time series voltage is defined as signal (3)
1992
IEEE TRANSACTIONS ON POWER DELIVERY, VOL. 26, NO. 3, JULY 2011
Fig. 5. Mallat-style discrete wavelet decomposition process of MRA applied to three-phase voltage and current vectors (V and I ).
where function is the mother wavelet and and are real numbers that represent the scaling and translation parameters, respectively. The scale parameter determines the oscillatory frequency and the length of the wavelet, whereas the translation parameter controls the shifting position. The wavelet coeffigive a measure of similarity between scaled and cients shifted wavelets with the voltage signal . However, it is impossible to compute the wavelet coefficients using mother wavelets with all possible scaling and translation parameters. In order to solve this problem, CWT is discretized to a discrete WT (DWT) by using wavelets which satisfy a series of strict conditions in the mathematical modeling [40], so that the DWT will be able to reserve all information of the signal. In DWT, the scaling and translation parameters are also discrete, , , where and are both such as when is integers. In general, most of DWT-based applications set equal to 2 and is equal to 1. By discretizing the CWT in (3), can be formulated by the DWT of a voltage signal
Fig. 6. Sample fault signals simulated using MATLAB. (a) Three-phase voltage waveform (b) and (c) show the 1st level wavelet approximation and detail coefficients of the voltage signals, respectively. (d) and (e) show the 2nd level wavelet approximation and detail coefficients of the voltage signals, respectively. Signals of different phases are depicted in different colors (i.e., phase-A in red dashed lines, phase-B in blue solid lines, and phase-C in green dotted lines).
(4) is a discrete version of . where A multilevel DWT (ML-DWT) is used to recursively deand currents compose the signals of three-phase voltages into wavelet approximation and detail coefficients, known as the multiresolution analysis (MRA) [41]. Wavelet approximation coefficients represent the low-frequency signal content and and wavelet detail coefficients correspond of and . Each set of to high-frequency components of high-frequency components can be further decomposed into other levels of wavelet approximation and detail coefficients. Thus, in this study, an ML-DWT of three-phase voltage and and ) can be constructed by using the current vectors ( Mallat-style descrete wavelet decomposition process, depicted in Fig. 5. The 1st and 2nd level wavelet detail coefficients , , and ) are used for further ( analysis via PCA. Furthermore, the selection of the mother wavelet is crucial to produce good performance results. Daubechies wavelet Db4 is chosen to be the mother wavelet of the ML-DWT, since it is proven to be the most effective mother wavelet in power system fault analysis [43]–[45]. For example, based on the sampling rate (3,840 Hz) of the voltage and current measurements, the and ranges of frequency bands for the 1st level ( ) and the 2nd level ( and ) wavelet detail coefficients are 960–1920 Hz and 480–960 Hz, respectively. These coefficients at these high-frequency bands can be used to catch transient phenomena caused by faults, as depicted in Figs. 6 and 7.
Fig. 7. Sample fault signals simulated using MATLAB. (a) Three-phase current waveform (b) and (c) show the 1st level wavelet approximation and detail coefficients of the current signals, respectively. (d) and (e) show the 2nd level wavelet approximation and detail coefficients of the current signals, respectively. Signals of different phases are depicted in different colors (i.e., phase-A in red dashed lines, phase-B in blue solid lines, and phase-C in green dotted lines).
2) Principal Component Analysis: Original signals measured from a real-world power system are noisy and full of redundant information. These characteristics also exist in the wavelet coefficients. In this study, the primary goal of using PCA is to reveal key hidden factors, so that the feature
JIANG et al.: HYBRID FRAMEWORK FOR FAULT DETECTION, CLASSIFICATION, AND LOCATION—PART I
of the fault underlying the wavelet detail coefficients of the three-phase voltage and current signals can emerge. After the fault signals are preprocessed by ML-DWT, the 1st and 2nd level wavelet detail coefficients of voltages and currents can be expressed as the following column vectors:
(5)
1993
and are given by the eigenvectors and eigenvalues of the covariance matrix (13) In order to obtain the vectors and scalars , we can . Let and solve the eigenvectors and eigenvalues of be the eigenvectors and eigenvalues of , respectively, so (14) By multiplying both sides by
(6) (15) and
(7)
where , , and denote features in the phase-A, -B, and -C of the transmission line, respectively. Since we record the , voltage and current signals for one cycle at 3840 Hz, then , and contain 64 vectors . , , and are mean-centered by subtracting the mean and value from each coefficient vector. Let represent the mean of the th-level wavelet coefficients of and in the phase- of the transmission line, respectively
which means that the first eigenvectors and eigenof are given by and for the transvalues mission line with phase , respectively. However, needs to be normalized in order to be equal to . The eigenvectors corresponding to nonzero eigenvalues of the produce an orthonormal basis for the covariance matrix subspace within which most wavelet detail coefficients of voltages and currents in the phase- of the transmission line can be represented with a small amount of error. The eigenvectors are sorted by their corresponding eigenvalues in a decreasing order. The eigenvector associated with the largest eigenvalue is the one that reflects the greatest variance in the wavelet detail coefficients. Since the sorted eigenvalues decrease in exponential fashion, roughly 90% of the total variance is contained in the first 5% to 10% of the dimensions. The wavelet detail coefficients can be projected onto dimensions by computing
(8) (16) (9) where and . Then, the mean-centered wavelet coefficients can be defined as
(10)
where and represent the mean-centered wavelet detail coefficients of voltages and currents in phase-A, -B, and -C of the transmission line, respectively. In order to find a vector , which has the largest possible projection onto each , we need to find a set of orthonormal vectors column of so that the quantity (11) is maximized with the orthonormality constraint that (12) where .
and
are an identity matrix of size
and . is where the th coordinate of the wavelet detail coefficient in the new space, which came to be the principal component of voltages and currents in the phase- of the transmission line and . 3) Support Vector Machine: In this study, the first two coordinates of the principal component scores give the projection of wavelet detail coefficients of voltages and currents in each phase , of the transmission line ( and ) onto a feature plane. SVM is then applied to the feature plane for fault classification. SVM is a universal learning algorithm which has one output and can deal with linear and nonlinear separable models based on theoretical results from the statistical theory [45]. SVM is used to classify two coordinates of the principal component scores into different types of faults. There are six major types of faults considered in this study: • phase-to-ground faults: A-G, B-G, and C-G; • double-phase-to-ground faults: AB-G, BC-G, and AC-G; • phase-to-phase faults: AB, BC, and AC; • three-phase fault: ABC; • three-phase-to-ground fault: ABC-G; • high-impedance fault: HIF. Please note that nonlinear high-impedance faults (e.g., arcing) are not in the scope of this study due to their constantly changing
1994
IEEE TRANSACTIONS ON POWER DELIVERY, VOL. 26, NO. 3, JULY 2011
Furthermore, suppose that the weight vector can be expressed as a linear combination of training samples as (21) Then, the decision boundaries can be expressed as (22) In the feature space, the expression can be rewritten in the following form: (23)
Fig. 8. Architecture of the integrated fault classification and location modules.
fault currents and the earth or obstacle surfaces that support the arc. In order to correctly classify these fault types, a set of six SVMs and its corresponding ASNNs are integrated to perform fault classification and location, respectively. The detailed architecture regarding SVMs and ASNNs is depicted in Fig. 8. In this subsection, we focus on the SVM part of the fault classification module and ASNNs will be discussed later. It is given that a set of prior knowledge vectors , where and are the labels associated with . The SVM regression functions can be expressed as follows:
is known as the dual The expression in terms of variables representation of the decision boundaries. and are tuned by solving the solution of The value of the following regularized risk function:
subsect
(24)
where represents slack variables that allow a feature point to , known as the margin error) of be in the margin ( , and is the hyperplane or to be misclassified a penalty parameter. Using the method of Lagrange multipliers, we can obtain the dual formulation of (24) which is expressed as in terms of variables
(17) . denotes the number of hyperplanes, where is the weight vector, and is the bias term. Each hyperplane divides the space into two portions, and the sign of the discrimidenotes the side a feature point is on. Hownant function ever, the nonlinear classifier provides greater accuracy in many applications. Since this paper is interested in the nonlinear transient phenomenon of during-fault signals, it is necessary to map the feature points from the input space to a feature space using a nonlinear transfer function . The discriminant function of such transformation is (18) where (19) In this case, the decision boundaries for the classifier can be rewritten by (20) These transformations add flexibility to the decision boundaries so that nonlinear decision boundaries can be achieved.
subject to
(25)
The SVM optimization problem can be solved by dual formulation using many special-purpose solvers [46]. One of the most commonly used solvers is LIBSVM [47]. The computational complexity of training nonlinear SVMs with LIBSVM has been reported to be quadratic in a number of training samples [46]. Since the training of SVMs is in offline fashion, the quadratic complexity is acceptable as long as the number of training samples is less than, say, one million. Generally, in this study, it is not possible to use a training data set of size one million; thus, the training of SVMs can be completed in less than one minute. In the proposed framework, as shown in Fig. 8, each SVM is designed to identify a type of fault event. The classification functions and the output patterns of these SVMs are summarized in Table I. The output will be an output vector with six . Please elements denoted by and note that the binary SVM classifiers in this module also provide relative strengths for comparison if a fault event belongs to more than one class. The elements of output patterns are displayed by
JIANG et al.: HYBRID FRAMEWORK FOR FAULT DETECTION, CLASSIFICATION, AND LOCATION—PART I
1995
TABLE I CLASSIFICATION FUNCTION, DETAILED CLASSIFICATION AND OUTPUT PATTERN OF THE SVMS IN THE FAULT CLASSIFICATION MODULE
Fig. 9. Detailed diagram of the input/output configuration of ASNN for fault location.
using signal “1” for the faulty condition and “ condition.
” for the normal
C. Fault-Location Module In this study, a set of adaptive structural neural networks (ASNNs) is used to estimate fault location. As shown in Fig. 8, after the SVMs determine the fault type, the proposed framework will activate an associated ASNN to precisely locate the position of the fault. An ASNN was previously proposed that is an adaptive neural network with minimal predetermined parameters and a dynamic structuring mechanism [48]. Due to the dynamic structuring mechanism, we can continuously enhance the performance of the proposed framework via the runtime training technique. This technique allows the engineers to train the ASNN when they collected new training samples. Any initialization process is not required. For detailed information regarding ASNN, please refer to [48] and http://bem.bime.ntu.edu.tw/clchuang/ASNN.pdf. The detailed input/output configuration of the fault-location and module is depicted in Fig. 9. The training samples were obtained previously their corresponding fault location through real-world measurements from power systems or computer-based simulations. Before the proposed framework is applied to fault diagnosis, each network in the set of ASNNs needs to be properly trained using and in order to allow the framework to become functional. When the proposed framework monitors the system, the principal component scores of fault voltages and currents in each phase of the transmission line for (i.e., , and ) serve as the inputs of the ASNN activated by its associated SVM. After the ASNN completes the analysis, the estimated location of fault, denoted by , will be presented at the output of the ASNN. It
is worth mentioning that the primary purpose of using ASNN in the fault-location module is to increase the flexibility of the proposed framework. Training without reinitializing the neural network is an important feature since the power company cannot afford to shut down the monitoring system for the power grid too long. IV. DISCUSSION AND CONCLUSION This paper is the first part of the two-paper series. In the first part, we presented the fundamental concept of the proposed framework, including the methodology of the analytical techniques, the pattern recognition via neural networks, and a joint decision-making mechanism. Several algorithms have been employed to form the proposed hybrid framework, such as symmetrical component analysis, multilevel wavelet transforms, PCA, support vector machine, and adaptive structure neural networks. The proposed hybrid framework is a data-driven method which is more robust against unknown level of noises in real-world environments. With the runtime training technique, the proposed framework becomes more flexible to absorb newly available training datasets. This feature may allow the proposed framework to adapt to the changing conditions and architectures of a power system. The performance of the proposed framework is evaluated through the computer-based simulation studies. Due to limited space, detailed procedures of the simulation studies using a simple two-end power network and an IEEE 14-bus power system are provided in the supplementary document [49]. In the simple power network, the proposed algorithm yielded 99.9% fault detection accuracy and 99.84% and 99.9% fault classification sensitivity and specificity, respectively. The averaged fault-location error is 0.54%. We further enhance the performance of the proposed framework via the runtime training technique and successfully improve the averaged location error to 0.41%. In the IEEE 14-bus power network, the proposed framework yielded 99.9% fault detection accuracy and the sensitivity and specificity of fault classification are 99.73% and 99.9%, respectively. The averaged fault-location
1996
IEEE TRANSACTIONS ON POWER DELIVERY, VOL. 26, NO. 3, JULY 2011
error is around 0.61%. These results show that the proposed framework is useful in simple and complex power systems. In addition, the computational complexity of the proposed framework seems to be high. However, most of complex computational operations (e.g., optimization of SVMs and training of ASNNs) are conducted in the training stage. After the proposed framework is tuned by the training samples, the computational operations used in real-time monitoring are mostly addition, subtraction, multiplication, and division operations. By utilizing the multithreading technology, the proposed framework can be sped up in order to shorten its response time. In most of the simulation cases, after a fault occurred, the proposed fault detection module took 3.5 ms to declare the occurrence of the fault. Then, the fault classification and location modules are triggered. It takes 16.7 ms (1 cycle) to collect a sufficient amount of data for classifying and locating the fault. Since the amount of data is small (64 sample points 3 phases 2 signal types (voltage and current) 384 floating point numbers), the data can be rapidly analyzed by WT, PCA, SVMs, and ASNNs by using a laptop with an Intel i7-720QM CPU (4 cores). The CPU time used to classify and locate the fault is around 1.2 ms. Therefore, the overall response time of the proposed framework (including fault detection, classification, and location) is around 1.28 cycles (0.021 s), which is significantly shorter than critical fault clearing time (typically 6 to 10 cycles). Besides computer-based simulations, in order to show the applicability of the proposed method in real-world scenarios, we have implemented the proposed framework using FPGA technology. We are able to evaluate whether the hardware implementation of the proposed method is robust and efficient enough against noise signals from ADCs and computational delays. The results will be presented in the following paper. REFERENCES [1] P. M. Anderson, Power System Protection. New York: Wiley, 1998. [2] D. Düstegör, S. V. Poroseva, M. Y. Hussaini, and S. Woodruff, “Automated graph-based methodology for fault detection and location in power systems,” IEEE Trans. Power Del., vol. 25, no. 2, pp. 638–646, Apr. 2010. [3] IEEE Guide for Protection, Interlocking and Control of Fossil-Fueled Unit-Connected Steam Stations, IEEE Std. 502-1985. [4] IEEE Recommended Practice for Protection and Coordination of Industrial and Commercial Power Systems, IEEE Std. 242-1986. [5] IEEE Guide for the Protection of Network Transformers, ANSI/IEEE Std. C37.108-1989. [6] V. Venkatasubramanian, R. Rengaswamy, K. Yin, and S. N. Kavuri, “A review of process fault detection and diagnosis Part I: Quantitative model-based methods,” Comput. Chem. Eng., vol. 27, pp. 293–311, 2003. [7] V. Venkatasubramanian, R. Rengaswamy, K. Yin, and S. N. Kavuri, “A review of process fault detection and diagnosis Part II: Qualitative models and search strategies,” Comput. Chem. Eng., vol. 27, pp. 313–326, 2003. [8] V. Venkatasubramanian, R. Rengaswamy, K. Yin, and S. N. Kavuri, “A review of process fault detection and diagnosis Part III: Process history based methods,” Comput. Chem. Eng., vol. 27, pp. 327–346, 2003. [9] A. Maghsooloo, A. Khosravi, H. S. Anvar, and R. Barzamini, “ANFIS and PCA capability assessment for fault detection in unknown nonlinear systems,” in Proc. 3rd Int. Symp. Communications, Control and Signal Processing, St. Julians, U.K., Mar. 2008, pp. 47–52. [10] T. Short, Electric Power Distribution Handbook. Boca Raton, FL: CRC, 2003.
[11] J. Mora-Flórez, V. Barrera-Núñez, and G. Carrillo-Caicedo, “Fault location in power distribution system using a learning algorithm for multivariable data analysis,” IEEE Trans. Power Del., vol. 22, no. 3, pp. 1715–1721, Jul. 2007. [12] J. Mora-Flórez, G. Morales-España, and S. Pérez-Londoño, “Learning-based strategy for reducing the multiple estimation problem of fault zone location in radial power systems,” Inst. Eng. Technol. Gen. Transm. Distrib., vol. 3, no. 4, pp. 346–356, Apr. 2009. [13] B. D. Russell and R. P. Chinchali, “A digital signal processing algorithm for detecting arcing fault on power distribution feeders,” IEEE Trans. Power Del., vol. 4, no. 1, pp. 132–140, Jan. 1989. [14] B. M. Aucoin and B. D. Russell, “Distribution high impedance fault detection using high frequency current components,” IEEE Trans. Power App. Syst., vol. PAS-101, no. 6, pp. 1596–1606, Jun. 1982. [15] Y. Sheng and S. M. Rovnyak, “Decision tree-based methodology for high impedance fault detection,” IEEE Trans. Power Del., vol. 19, no. 2, pp. 533–536, Apr. 2004. [16] A. Lazkano, J. Ruiz, L. A. Leturiondo, and E. Aramendi, “High impedance arcing fault detector for three-wire power distribution networks,” in Proc. 10th. Mediterranean Electrotechnical Conf., May 29–31, 2000, vol. 3, pp. 899–902. [17] D. Wai and X. Yibin, “A novel technique for high impedance fault identification,” IEEE Trans. Power Del., vol. 13, no. 3, pp. 738–744, Jul. 1998. [18] A. Girgis, W. Chang, and E. Makram, “Analysis of high-impedance fault generated signals using a Kalman filtering approach,” IEEE Trans. Power Del., vol. 5, no. 4, pp. 1714–1724, Oct. 1990. [19] A. Mamishev, B. Russell, and G. Benner, “Analysis of high impedance faults using fractal techniques,” IEEE Trans. Power Del., vol. 11, no. 1, pp. 435–440, Jan. 1996. [20] A. Sedighi, M. Haghifam, O. Malik, and M. Ghassemian, “High impedance fault detection based on wavelet transform and statistical pattern recognition,” IEEE Trans. Power Del., vol. 20, no. 4, pp. 1414–2421, Oct. 2005. [21] K. M. Silva, B. A. Souza, and N. S. D. Brito, “Fault detection and classification in transmission lines based on wavelet transform and ANN,” IEEE Trans. Power Del., vol. 21, no. 4, pp. 2085–2063, Oct. 2006. [22] N. I. Elkalashy, M. Lehtonen, H. A. Darwish, A.-M. I. Taalab, and M. A. Izzularab, “DWT-based detection and transient power direction-based location of high-impedance faults due to leaning trees in unearthed mv networks,” IEEE Trans. Power Del., vol. 23, no. 1, pp. 94–101, Dec. 2008. [23] O. A. S. Youssef, “Combined fuzzy-logic wavelet-based fault classification technique for power system relaying,” IEEE Trans. Power Del., vol. 19, no. 2, pp. 582–589, Apr. 2004. [24] U. B. Parikh, D. Biswarup, and R. P. P. Maheshwari, “Combined wavelet-SVM technique for fault zone detection in a series compensated transmission line,” IEEE Trans. Power Del., vol. 23, no. 4, pp. 1789–1794, Oct. 2008. [25] M. Aldeen and F. Crusca, “Observer-based fault detection and identification scheme for power systems,” Proc. Inst. Elect. Eng., Gen., Transm. Distrib., vol. 153, no. 1, pp. 71–79, 2006. [26] F. Caliskan and I. Genc, “A robust fault detection and isolation method in load frequency control loops,” IEEE Trans. Power Syst., vol. 23, no. 4, pp. 1756–1767, Nov. 2008. [27] D. Dustegor, S. V. Poroseva, M. Y. Hussaini, and S. L. Woodruff, “Automated graphe-based methodology for fault detection and location in power systems,” IEEE Trans. Power Del., vol. 25, no. 2, pp. 638–648, Apr. 2010. [28] S.-J. Huang, T.-M. Yang, and J.-T. Huang, “FPGA realization of wavelet transform for detection of electric power system disturbances,” IEEE Trans. Power Del., vol. 17, no. 2, pp. 388–394, Apr. 2002. [29] E. Monmasson and M. N. Cirstea, “FPGA design methodology for industrial control systems—A review,” IEEE Trans. Ind. Electron., vol. 54, no. 4, pp. 1824–1842, Aug. 2007. [30] A. Ordaz-Moreno, R. de Jesus Romero-Troncoso, A. Vite-Frias, R. Rivera-Gillen, and A. Garcia-Perez, “Automatic online diagnosis algorithm for broken-bar detection on induction motors based on discrete wavelet transform for FPGA implementation,” IEEE Trans. Ind. Electron., vol. 55, no. 4, pp. 2193–2202, May 2008. [31] R. H. Salim, K. R. C. de Oliveira, A. D. Filomena, M. Resener, and A. S. Bretas, “Hybrid fault diagnosis scheme implementation for power distribution systems aytomation,” IEEE Trans. Power Del., vol. 23, no. 4, pp. 1846–1856, Oct. 2008.
JIANG et al.: HYBRID FRAMEWORK FOR FAULT DETECTION, CLASSIFICATION, AND LOCATION—PART I
[32] O. Lopez, J. Alvarez, J. Doval-Gandoy, D. Freijedo, A. Nogueiras, A. Lago, and M. Penalver, “Comparison of the FPGA implementation of two multilevel space vector PWM algorithms,” IEEE Trans. Ind. Electron., vol. 55, no. 4, pp. 1537–1547, Apr. 2008. [33] S. P. Valsan and K. S. Swarup, “High-speed fault classification in power lines: Theory and FPGA-based implementation,” IEEE Trans. Ind. Electron., vol. 56, no. 5, pp. 1793–1800, May 2009. [34] Mathworks, Inc., Mathworks Matlab. [Online]. Available: http://www. mathworks.com/ [35] J. L. Blackburn, Symmetrical Components for Power Systems Engineering. New York: Marcel Dekker, 1993. [36] F. Villada, D. R. Cadavid, J. E. Aedo, B. A. Benavides, and E. Velilla, “The negative sequence impedance as fault indicator in induction motors,” Rev. Fac. Ing. Univ. Antioquia, vol. 52, pp. 226–232, 2010. [37] V. Duraisamy, N. Devarajan, P. S. V. Kumar, S. N. Sivanandam, and D. Somasundareswari, “A fuzzy based fault detection scheme for synchronous generator,” Academ. Open Internet J., vol. 14, 2005. [38] Q. Wu and S. Nandy, “Fast single-turn sensitive stator inter-turn fault detection of induction motors based on positive and negative sequence third harmonic components of line currents,” in Proc. IEEE Ind. Appl. Soc. Annu. Meeting, Oct. 2008, pp. 1–8. [39] P. Brémaud, Mathematical Principles of Signal Processing, Fourier and Wavelet Analysis. Berlin, Germany: Springer-Verlag, 2002, pp. 171–187. [40] C. K. Chui, Introduction to Wavelets. London, U.K.: Academic, 1992. [41] S. G. Mallat, “A theory for multiresolution signal decomposition: The wavelet representation,” IEEE Trans. Pattern Anal. Mach. Intell., vol. 11, no. 7, pp. 674–693, Jul. 1989. [42] S. M. Brahma, “Use of wavelets for out of step blocking function of distance relays,” in Proc. IEEE Power Eng. Soc. Gen. Meeting, Jun. 2006, pp. 1–5. [43] A. H. Osman and O. P. Malik, “Protection of parallel transmission lines using wavelet transform,” IEEE Trans. Power Del., vol. 19, no. 1, pp. 49–55, Jan. 2004. [44] M. J. Reddy and D. K. Mohanta, “Adaptive-neuro-fuzzy inference system approach for transmission line fault classification and location incorporating effects of power swings,” Inst. Eng. Technol. Gen. Transm. Distrib., vol. 2, no. 2, pp. 235–244, 2008. [45] N. Cristianini and J. Shawe-Taylor, An Introduction to Support Vector Machines and Other Kernel-Based Learning Methods. Cambridge, U.K.: Cambridge Univ. Press, 2000, pp. 31–112. [46] , L. Bottou, O. Chapelle, D. DeCoste, and J. Weston, Eds., Large Scale Kernel Machines. Cambridge, MA: MIT Press, 2007. [47] T. Joachims, “Training linear SVMs in linear time,” in Proc. ACM SIGKDD Int. Conf. Knowl. Discovery Data Mining, Aug. 2006, pp. 217–226. [48] Y. L. Lu, C. L. Chuang, C. S. Fahn, and J. A. Jiang, “Multiple disturbance classifier for electric signals using adaptive structuring neural networks,” Meas. Sci. Technol., vol. 19, p. 075106, 2008. [49] J. A. Jiang, C. L. Chuang, Y. C. Wang, C. H. Hung, J. Y. Wang, C. H. Lee, and Y. T. Hsiao, Supplementary document for a hybrid framework for fault detection, classification and location-Part I: Concept, Structure and Methodology. Feb. 2011. [Online]. Available: http://bem.bime.ntu. edu.tw/clchuang/Fault_2011.rar
Joe-Air Jiang (M’01) was born in Tainan, Taiwan, in 1963. He received the M.S. and Ph.D. degrees in electrical engineering from National Taiwan University (NTU), Taipei, Taiwan, in 1990 and 1999, respectively. From 1990 to 2001, he was with Kuang-Wu Institute of Technology, Taipei. Currently, he is a Professor of Bio-Industrial Mechatronics Engineering, NTU, where he is an active researcher. His specialties in power transmission systems are computer relaying, solar generation systems, fault detection, fault classification, fault location, power-quality event analysis, and smart-grid systems. His areas of interest are diverse and cover wireless sensor network (WSN) technology, biomechatronics, neuroengineering, bioeffects of electromagnetic wave, automatic systems for agroecological monitoring with WSN, and lowlevel laser therapy. Dr. Jaing was the recipient of the Best Paper Award (entitled Jan Ten-You Paper Award) from the Chinese Institute of Engineers in 2002, the Best Young Researcher Award from the Power Engineering Division of the National Sci-
1997
ence Council (NSC) in 2002, the Prize Paper Award from IEEE/Power Engineering Society Transmission and Distribution Conference and Exhibition in 2002, the NTU Excellent Teaching Award in 2004, the Best Paper Award from the Journal of Formosan Entomology, Taiwan Entomological Society, in 2007, the Best Paper Award from the International Seminar on Agricultural Structure and Agricultural Engineering in 2007 (IS-ASAE 2007), the Best Paper Award from the Workshop on Consumer Electronics in 2008 (WCE 2008), the Annual Best Paper Award from Taiwan Society of Naval Architects and Marine Engineers in 2010, and the Academic Achievement Award from the Chinese Institute of Agricultural Machinery in 2010. Currently, he is the Principal Investigator of several large-scale integration projects funded by the NSC and the Council of Agriculture of the Executive Yuan, Taiwan.
Cheng-Long Chuang (S’04–M’11) received two B.S. degrees in electrical engineering and computer science and information engineering from Tamkang University, Taipei, Taiwan, in 2003, the M.S. degree in electrical engineering from Tamkang University, Taipei, Taiwan, in 2005, and two Ph.D. degrees in biomedical engineering and bio-industrial mechatronics engineering from National Taiwan University, Taipei, in 2010. Currently, he is a Postdoctoral Research Fellow with the Department of Bio-Industrial Mechatronics Engineering, National Taiwan University. He is also an Adjunct Assistant Professor in the Department of Computer Science, National Taipei University of Education, Taipei. His research interests are in the areas of power systems, multiagent systems, cryptography, optimal theory, wireless communications, integrated-circuit design, cognitive psychology, artificial intelligence, as well as bioinformatics and neuroscience.
Yung-Chung Wang received the M.S. and Ph.D. degrees in electrical engineering from National Tsing Hua University, Hsinchu, Taiwan, in 1990 and 2000, respectively. From 1990 to 2001, he was a Research Engineer with the Chung-Hwa Telecommunication Laboratory, where he was engaged in research on the development of ATM switching systems and IP switch router systems. Since 2001, he has been with the Department of Electrical Engineering, National Taipei University of Technology (NTUT), Taipei, Taiwan, where he is a Full Professor. His research interests include wireless networks, optical networks, and queuing theory and performance evaluation of communication networks.
Chih-Hung Hung received the B.S. degree in electrical engineering from National Taipei University of Technology, Taipei, Taiwan, in 2008 and the M.S. degree in bio-industrial mechatronics engineering from National Taiwan University, Taipei, in 2010. His research interest is in the area of integrated-circuit design, power systems, mechatronics, and wireless sensor networks.
Jiing-Yi Wang received the B.S. degree in electrical engineering from Chung Yuan Christian University, Taoyang, Taiwan, in 2008 and the M.S. degree in bio-industrial mechatronics engineering from National Taiwan University, Taipei, Taiwan, in 2010. His research interest is in the area of integratedcircuit design, electromagnetism, mechatronics, and wireless sensor networks.
1998
IEEE TRANSACTIONS ON POWER DELIVERY, VOL. 26, NO. 3, JULY 2011
Chien-Hsing Lee (S’93–M’98–SM’06) was born in Pingtung, Taiwan, on June 13, 1967. He received the B.S. degree in electrical engineering from Arizona State University, Tempe, in 1993 and the M.S.E.E. and Ph.D. degrees from the Georgia Institute of Technology, Atlanta, in 1995 and 1998, respectively. Currently, he is an Associate Professor at National Cheng Kung University, Taipei, Taiwan. His research interests are power system grounding analysis, power system transient modeling, power quality, and applications of wavelet theory in power systems.
Ying-Tung Hsiao (M’92) received the B.S. degree in electrical engineering from National Taiwan Institute of Technology, Taipei, Taiwan, in 1986 and the M.S. and Ph.D. degrees in electrical engineering from National Taiwan University in 1989 and 1993, respectively. Subsequently, he joined the faculty of St. John’s and St. Mary’s Institute of Technology and was a Professor of Electrical Engineering at Tamkang University, Taiwan. Currently. he is a Professor and Chair in the Department of Digital Technology Design and a joint Professor in the Department of Computer Science and Information, Nation Taipei University of Education. His research interests include power system analysis, optimal theory, and motor control.