252
A Method for Design of Data-tailored Partitioning Algorithms for Optimizing the Number of Clusters in Microarray Analysis Milan Vukicevic, Boris Delibasic, Milos Jovanovic, Milija Suknovic Center for Business Decision-Making Faculty of Organizational Sciences, University of Belgrade Belgrade, Serbia
[email protected] Abstract—We propose a method for designing a partitioning clustering algorithm from reusable components that is suitable for finding the appropriate number of clusters (K) in microarray data. The proposed method is evaluated on 10 datasets (4 syntetic and 6 real-word microarrays) by considering 1008 reusable-componentbased algorithms and four normalization methods. The best performing algorithm were reported on every dataset and also rules were identified for designing microarray-specific clustering algorithms. The obtained results indicate that in the majority of cases a data-tailored clustering algorithm design outperforms the results reported in the literature. In addition, data normalization can have an important influence on algorithm performance. The method proposed in this paper gives insights for design of divisive clustering algorithms that can reveal the optimal K in a microarray dataset. Keywords- clustering, reusable components, microarray data
I.
INTRODUCTION
Clustering of gene expression microarray data plays an important role in biomedical research. The usage and evaluation of clustering algorithms in biomedical research has been exhaustively reviewed [1] and the importance of finding the appropriate algorithms for different biomedical applications is greatly emphasized. Microarray gene expression data can be clustered twofold. On one hand, genes can be clustered based on similar expressions over biological samples and, on the other hand, biological samples can be clustered based on gene expression data [2]. A more challenging problem is the clustering of samples on the basis of genes, where many clustering techniques fail to capture complex local structures, due to the high-dimensionality of the data and the small number of samples [3], [4]. Although there are some recommendations regarding algorithm selection for clustering biological data [5], there is no consensus about the best algorithm for such a hard clustering
978-1-4673-1191-5/12/$31.00 ©2012 IEEE
Zoran Obradovic Center for Data Analytics and Biomedical Informatics CIST, Temple University Philadelphia, USA
[email protected]
task. In this regard, the reusable-component (RC) based approach ([6] for clustering algorithms could give a clearer direction. In this paper we propose a method for designing a hierarchical divisive clustering algorithm that can reveal an appropriate number of clusters in data (K). The method is used to design algorithms for clustering of samples over gene expression data. The RC-based approach allows the design of a plethora of hierarchal divisive clustering algorithms (in this paper 1008) that are composed by combining RCs (found in algorithms and algorithm improvements) on the same algorithm sub-problems (e.g. various methods for initialization, for measuring distances etc). This research extends our research of RC-based partitioning clustering algorithms on microarray data analysis [7], where the main focus was identification of algorithm structures that can reveal the right clustering structure, given a known K. In comparison to [7] this research makes the following extensions: •
Analysis of the influence of different normalization techniques done prior to clustering on clustering quality;
•
Development and evaluation on microarray datasets of divisive hierarchical clustering algorithms that can detect the appropriate number of clusters K; and
•
Proposal of a method for identifying the most-suited divisive clustering algorithms, when K is not known in advance (algorithms investigated in [7] needed user defined number of clusters).
The remainder of this paper is structured as follows. In Section 2 we explain the RC-based algorithms framework, and in Section 3 we present the experimental results followed by a discussion provided .in Section 4.
253 II.
REUSABLE-COMPONENT-BASED DIVISIVE CLUSTERING ALGORITHMS
The reusable component (RC) design approach proposes decomposing algorithms into sub-problems that can be solved using different RCs. These are well-documented, frequently occurring solutions for specific sub-problems in a family of algorithms [6] (in this case representative based clustering). RCs have the same I/O structure as the sub-problems (i.e. all RCs for the Initialization sub-problem have dataset as an input and cluster representatives as output). This allows re-using parts of algorithms discussed in the literature for reconstructing original algorithms or designing new RC-based algorithms by assembling RCs into algorithms. In [7], partitioning (k-means like) clustering algorithms based on the idea of RC-based design were used to analyze algorithm structure that adapts best to dataset “ground truth”. Those algorithms were unable to find an optimal K for the data at hand. Based on the idea of RC-based clustering algorithms [6], in this paper we analyze hierarchical divisive clustering algorithms that can reveal the true K. RC-based algorithms have a generic clustering structure that allows RCs to be combined. The structure of a generic clustering algorithm is made of subproblems [6]. Examples of these are representative initialization, distance measuring, updating of representatives, etc. Each of these sub-problems can be resolved in several ways with RCs (e.g. Initialization of representatives can be done randomly, or like in X-means [8] or in other ways mentioned later in this paper). Besides having a generic clustering structure, in RC-based design there must exist a generic algorithm that is able to assemble RCs into clustering algorithms. The generic clustering (GC) algorithm used in this paper consists of three phases: 1. Initialization, where initial (minK) representatives are generated; 2. Refinement, where objects are iteratively assigned to representatives, and representatives recalculated; and 3. Hierarchical division, where the clusters are being split binary, until the desired number (maxK) of clusters has been achieved. The GC algorithm has three global parameters. These are: minK: number of clusters that should be generated in the “Initialization” phase, we have set this to 2; maxK: number of clusters that should be produced after the “Hierarchical division” phase (we set this parameter to 2*K); and refinePartitions: defines how clusters should be refined in the “Hierarchical division” phase after a cluster has been split binary. There are two possibilities usually used in literature:
Local: to refine child clusters based only on data from the parent cluster [8], and Global: to refine all clusters again, this time with two newly added child representatives (as in [9]). We use the GC algorithm and GC structure to construct 1008 divisive hierarchical clustering algorithms. Clustering algorithms used in our study are designed by varying RCs from the following four sub-problems: initializing representatives, measuring distance, updating representatives and evaluating clusters [6]. Additionally, we used both strategies for refinement (local and global). We have also normalized data prior to clustering with 4 different methods (RCs), namely L1, L2, MAXMIN (subtracting each column value from the minimal value, and dividing with max-min value), and AVGSTD (standard score normalization). Note that in the GC algorithm, “evaluating clusters” is used during the execution of the algorithms (as a model selector that influences cluster division). 1.
The pseudocode for the GC algorithm is shown in Algorithm
Algorithm 1.Generic representative-based clustering algorithm Input: Dataset Output: Cluster model Parameters: minK = 2 maxK = 2K refinePartitions: local/globa) GC algorithm (Dataset, minK, maxK, refinePartitions) 1. // Initialization 2. Use “Initialize representatives” to initialize minK representatives 3. // Refinement 4. repeat 5. for each randomly (without replacement) sampled case 6. for each representative 7. “Measure distance” (instance, representative) 8. end 9 Assign instance to nearest representative 10. If “Update representatives”.isOnline() then 11. “Update representatives”.update() 12.end 13. If not “Update representatives”.isOnline() then 14. “Update representatives”.update() 15.until“Stop criterion” 16.// Hierarchical division 17. If maxK>minK 18. Split each cluster binary using “Initialize representatives” 19. repeat 20. Do “Evaluate clusters” on child clusters and parent clusters 21 Choose best child and parent clusters difference evaluation 22 If difference is positive 23 If refinePartitions is local 24 .Do Refinement (Parent cluster dataset, child centroids) 25 If refinePartitions is global 26. Do Refinement (Whole dataset, all centroids) 27. until number of clusters = maxK or no splitting in last loop
254 1008 algorithms represent the space of algorithms that are formed by reusing parts of various representative-based (k-means like) and hierarchical divisive algorithms from the literature. Now we will explain this in more detail. In particular, for initialization of cluster representatives (IR) we considered seven RCs: (DIANA); (RANDOM); (XMEANS); (GMEANS); (PCA); (KMEANS++) more detailed description of the RCs is available upon request. The following four distances (similarities) were considered in this study as RCs: Euclidean distance (EUCLIDEAN); City block distance (CITY); Correlation similarity (CORREL); and Cosine similarity (COSINE). This sub-problem is abbreviated in following text as MD (Measure distance). We used the following three RCs for representative update (UR): MEAN, MEDIAN and ONLINE. By combining RCs, original algorithms can be reproduced, but new algorithms can also be created. E.g. the K-means algorithms can be reconstructed as RANDOM-EUCLIDEANMEAN-COMPACT. An example of a new algorithm would be PCA-COSINE-ONLINE-SILHOU, that uses PCA to “initialize representatives”, COSINE to “measure distance”, ONLINE to “update representatives, and SILHOU to “evaluate clusters”. We integrated internal cluster evaluation measures’ RCs into algorithms and in that way influenced the retrieved cluster models. For the “Evaluate clusters” (EC) sub-problem. we used six RCs: Akaike information criteria (AIC), Bayesian information criteria (BIC), silhouette index (SILHOU), intracluster distance from K-means (COMPACT), XB index (XB), and connectivity (CONN). By combining RCs from the four aforementioned subproblems we designed 504 (7*4*3*6) algorithms, which form a space of RC-based divisive cluster algorithms. As we used two strategies for cluster refinement in hierarchical clustering (local and global, to be explained in the next Section) we tested in total 1008 RC-based algorithms. III.
EVALUATION
A. Experimental setting For evaluation of the proposed generic algorithm we used four synthetic and six real world gene expression data sets. These datasets are often used in microarray data analysis, where biological samples are clustered based on gene expression data ([10]; [11]; [12]). However, for the real world datasets, number of clusters is estimated and the researches are referenced in Table 1. Table 1 shows a summary of datasets for synthetic and real world problems, respectively.
TABLE I.
DATASETS SUMMARY, SOURCE: [6]
Synthetic datasets [11] Gaussian 3 Gaussian4 Gaussian5delta3 Simulated 6 Real world datasets Leukemia [13] Novartis [14] Lung cancer [15] CNS Tumors [16] St. Jude [17] Normal [18]
Clusters
Samples
Attributes
3 4 5 6
60 400 500 60
600 2 2 600
3 4 4+ 5 6 13
38 103 197 48 248 90
999 1000 1000 1000 985 1277
By using an RC based approach, we designed 1008 clustering algorithms (as explained in previous section) and evaluated them on all datasets with different normalization techniques (totally 10x1008x4 runs). All algorithms, including stochastic RCs (e.g. for initialization of representatives RANDOM), were ran 10 times, and the average results are reported. In order to evaluate the suggested approach, we inspected whether RC based algorithms can find the true number of clusters in data. Cluster quality was measured with two external indices: Adjusted mutual index (AMI) [10] and Adjusted Rand Index (ARI) [19]. Both indexes compare two clustering solutions (ground truth vs. structure detected by the clustering algorithm). If the resulting partitions are identical, the value of both indices is 1 and if the partitions are completely different from one another, the index has an expected value of 0. Here we describe used measures, by using notation from [10]. Let S be a set of N data items, then a (partitional) clustering U on S is a way of partitioning S into non-overlap subsets {U1,U2,...,UR}. The information on the overlap between two clusterings U={U1,U2,...,UR} and V={V1,V2,...,VR} can be described in contingency table as described in Table 2. ARI is a pair counting based measure are built upon counting pairs of items on which two clusterings agree or disagree. item pairs in S can be classified into one of the 4 types-N11: the number of pairs that are in the same cluster in both U and V; N00: the number of pairs that are in different clusters in both U and V; N01: the number of pairs that are in the same cluster in U but in different clusters in V; and N10: the number of pairs that are in different clusters in U but in the same cluster in V.
255 TABLE II.
CONTIGENCY MATRIX FOR CALCULATING ARI INDEX
U/V
V1
V2
…
VC
Sums
U1
n11
n12
…
n1C
a1
U2
n21
n22
…
n2C
a1
…
…
…
…
…
UR
nR1
nR2
…
nRC
aR
Sums
b1
b2
…
bC
When contingency matrix is defined, ARI is calculated as:
ARI (U , V ) =
2( N 00 N11 − N 01 N10 ) ( N 00 + N 01 )( N 01 + N11 ) + ( N 00 + N10 )( N10 + N11 )
AMI is information theoretic based measure [10]. Given two clusterings U and V, their entropies, joint entropy, conditional entropies and mutual information (MI) are defined naturally via the marginal and joint distributions of data items in U and V respectively as: R
H (U ) = −∑ i =1
ai a log i N N R C n ij
H (U ,V ) = −∑∑ i =1 j =1 R
C
H (V ,U ) = −∑∑ i =1 j =1
R
C
I (U ,V ) = ∑∑ i =1 j =1
N nij N
log log
nij N nij N
nij / N n ij log N ai b j / N 2
Finally, AMI is calculated as:
AMI =
I (U ,V ) − E{I (U ,V )} max{H (U ), H (V )} − E{I (U , V )}}
We use AMI because it was recently suggested by [10] as a general purpose validation index and it showed valid performance on microarray datasets. Additionally we adopt ARI index in order to compare the results with already published work (since we are not aware of any research on clustering microarray data that reported AMI as validation measure). B. Results In Table 3, we show that on all datasets there are algorithms that found the appropriate K and identified real cluster structures (have high values of external indices). However, on “CNS
Tumors” and “Normal” datasets the algorithms didn’t find the “ground truth” hidden in the data, although there were algorithms that found the right K. For the Normal dataset, this is expected since this problem has a large number of clusters (13) with respect to number of samples (90) and other clustering algorithms also failed to capture real cluster structure ([11]; [12]). “CNS Tumors” does not have this problem and so we assume that some other type of clustering algorithms could be better adopted for its distribution. TABLE III. NUMBER OF ALGORITHMS ON EACH DATASET THAT FOUND THE RIGHT K. MAXIMAL AND AVERAGE VALUES FOR ARI AND AMI ARE ALSO SHOWN. # Alg. % Alg. ARI found K found K (max) Synthetic datasets Gaussian 3 Gaussian4 Gaussian5delta3 Simulated 6 Real world datasets Leukemia Novartis Lung cancer CNS Tumors St. Jude Normal
ARI (avg)
AMI (max)
AMI (avg)
462 240 132 96
22.92% 11.90% 6.55% 4.76%
1.00 0.90 0.94 1.00
0.55 0.74 0.84 0.22
1.00 0.87 0.92 1.00
0.55 0.73 0.84 0.26
23 491 128 7 194 73
1.14% 24.36% 6.35% 0.35% 9.62% 3.62%
0.45 1.00 0.92 0.28 0.96 0.95
0.28 0.43 0.50 0.17 0.68 0.40
0.47 1.00 0.87 0.40 0.96 0.94
0.33 0.44 0.54 0.26 0.71 0.44
Also, we can notice that there is a discrepancy between maximal and average ARI and AMI values. Therefore, we generalize the results on algorithms where both the number of K was correct and AMI values were within 10% of the best AMI value, as these algorithms show similar results on a dataset. E.g. on “Leukemia” (max AMI = 1) all algorithms within the range of ARI values [1, 0.9] will be analyzed. In order to inspect if the best RC based algorithms are comparable with other algorithms reported in literature, we compared our results with the results of ([11]; [12]) who proposed two ensemble-based clustering algorithms. Ensemble clustering is a very popular method in microarray data analysis and showed better results than single clustering algorithms that they are using for making a consensus ([11]; [12]). We compared the results with the graph-based consensus clustering (GCC) methods that use correlation clustering and K-means (GCCcorr and GCCkmeans) from [12] and with consensus clustering based on SOM and hierarchical clustering (CCsom and CCkmeans) by [11] in Table 4. In Table 4, the structures of the best performing RC based algorithms on each dataset are shown. Comparisons are made based on ARI values (even though it is showed that AMI is more adequate for clustering evaluation) since they are reported in referenced papers. ARI values of the best algorithms are showed in bold.
256 TABLE IV.
COMPARISON WITH RESULTS FROM (MONTI ET AL., 2003; YU ET AL., 2007) GCCcorr
CNSTumors Leukemia Lung cancer Novartis Normal St.Jude
0,658 0,831 0,544 x x 0,873
GCC Kmeans 0,718 0,831 0,562 x x 0,86
CChc
CCsom
0,549 1 0,31 0,921 0,572 0,948
0,429 0,721 0,233 0,897 0,487 0,825
Best RC-based algorithm 0.597 1 0,921 0,960 0,572 0.955
The results show that algorithms designed with RC interchange produced the best results or equally good results as other algorithms on five out of six datasets (datasets that are tested in [11], but not in [12] are marked with “x”). Since consensus-based clustering uses single algorithms (often representative-based) and re-sampling techniques, or several different algorithms for creating consensus partitions and identification of the “true” number of clusters, this experiment indicates that inclusion of RC based algorithms in consensus frameworks could lead to even better results. TABLE V.
STRUCTURE OF THE BEST RC BASED ALGORITHMS
Normal CNSTumors MEANSTD
IR PCA
MD
UR
EC
COSINE ONLINE COMPACT
Leukemia MAXMIN GMEANS COSINE ONLINE SILHOU AIC Lung cancer MEANSTD DIANA EUCLID ONLINE L2 XMEANS CITY MEAN SILHOU Novartis MEANSTD GMEANS CORREL ONLINE SILHOU Normal L2 PCA CITY ONLINE AIC St.Jude
glob/loc glob glob glob glob glob glob
Presented results provide evidence that RC based algorithms are comparable with the state-of-the-art algorithms for clustering microarray data. However, structure of the best RC based algorithms (Table 5) suggests that on different datasets, different RCs participated in building the best algorithm. From Table 5, it can be noticed that AIC and SILHOU are the only RCs used for “Evaluate clusters” sub-problems (which is a result also suggested by [7], ONLINE was the most frequent for “Update representatives”. Still, detailed inspection of the results showed that there were a lot of algorithms that showed minimal difference in performance from the best one, but had a quite different structure. Because of that and the fact that a large number of algorithms is evaluated, we further employ some rule extraction techniques to generalize our results by identification of rules for building good performing algorithms for clustering microarray data. C. Discussion It is very hard to make general conclusions based on the obtained experimental results because there is no one-fit-all clustering algorithm, and algorithms are usually dataset-tailored. However, some fairly general observations can be made. As said in the previous sub-section, in our experiments there was large
discrepancy between maximal and average performance of algorithms that found the true K. That is why we focus only on the best algorithms (algorithms whose AMI values were within 10% of the best AMI value). High values of the AMI index mean that most of the samples that should be clustered together are really in the same cluster. But this does not mean that in all cases algorithms with high AMI value recognized the true number of clusters. In our case, after selection of the algorithms with best AMI values there were 333 algorithms that found the real number of clusters and 342 that didn’t. This is why we employed the famous A priori algorithm for finding association rules that identify which algorithms (or RCs) that had good AMI values have recognized the true number of clusters. Association rules provide the rules in the following form: “if antecedent(s) then consequent(s)”. As input variables (antecedents) we defined all algorithmic sub-problems, while the output variable (consequent) was a binary indicator (true/false) of the right number of clusters. We measured the quality of the association rules by support and confidence. Support shows the ratio between the number of cases, for which the entire rule, (antecedent(s) and consequent(s)), is true and the total number of cases in the dataset. Confidence shows the ratio between the number of cases for which the entire rule is true, and the number of cases for which antecedent(s) is/are true. After filtering out the rules that had low confidence and support and redundant rules we end up with four interesting rules that are showed in Table 6. TABLE VI.
ASOCIATION RULES FOR GENERALIZATION OF THE RESULTS
IF ND =MEANSTD UR=MEAN MD =CORREL ND =MEANSTD UR=MEDIAN MD =CORREL ND = MAXMIN UR=ONLINE ND = MAXMIN UR=ONLINE G/L = LOCAL
THEN True K
Supp.
Conf.
FALSE
12.44
91.67
FALSE
12.44
91.67
TRUE
15.41
80.01
TRUE
8.44
82.46
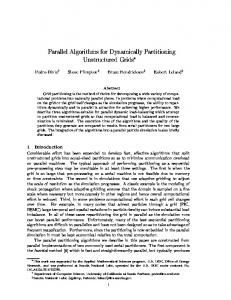
From Table 6 we can conclude that MEAN and MEDIAN RCs from the update representative sub-problem shouldn’t be used in an algorithm that finds the right K structure. On the other side, the true number of K and the right cluster structure is found if ONLINE RC is combined with MAXMIN normalization and more specifically with “local” divisive strategy. Normalization done prior to clustering can also have influence on clustering algorithms. From Figure 1 we can see that
257 L1 as normalization never shows up in algorithms that can reveal the true clustering structure, so it is not a good idea to use this RC prior to clustering microarray datasets. On the “Lung” dataset, using L2 can also fail to reveal true clustering results.
Algorithms that contained AIC were most frequently able to find the right number of clusters, but not with all combinations of RCs (201 times out of 318 algorithms with AIC found the right K). Further inspection of the decision tree showed that AIC together with ONLINE RC most frequently revealed the ground truth. If combined with MEAN, good results are achieved with RANDOM and XMEANS initializations (Figure 3).
Figure 1. AMI values for different normalizations on real world datasets
We further investigated the influence of different RC combinations on algorithms’ ability to find the appropriate number of clusters by using the C4.5 decision tree. Input and output variables were the same as for the A priori algorithm. The decision tree identified the evaluate clusters sub-problem as the most significant one, because the first level of the decision tree was created based on RCs from this sub-problem (Figure 2)
Figure 3. Rules about algorithms that include AIC RC
The decision tree model also revealed interesting rules about algorithms that include SILHOU RC (Figure 4). When using this RC, data should be normalized with MAXMIN normalization. Second, if data is normalized with L2 metric, distance should be measured with CITY, COSINE or EUCLID.
Figure 2. Branching the decision tree by different “evaluate clusters” RCs
From Figure 2, it is clear that BIC, CONN and XB evaluate clusters RCs shouldn’t be used in algorithms, because in 113 out of 114 cases they induced the wrong number of clusters.
Figure 4. Rules about algorithms that include SILHOU RC
258 IV.
REFERENCES
CONCLUSION AND FUTURE RESEARCH
In this paper, we used the component-based approach clustering algorithm design [6] to build generic divisive clustering algorithms that can be applied on microarray data. With this approach, we constructed 1008 algorithms and tested them on 10 datasets with 4 different normalization types.
[1]
[2]
Experiments conducted in this paper provide evidence that a component-based design of data-specific algorithms are a promising approach for clustering microarray data when the true number of clusters is not known in advance.
[3]
On the other side, the GC based framework with RCs used in this paper can produce 1008 algorithms, and adding new RCs would make the number of available algorithms grow. In this paper we addressed the problem of algorithm overflow with more general rules by which RCs should be assembled (or not) in order to design well-performing clustering algorithms.
[5]
Experiments also suggest that divisive hierarchical based algorithms built from RCs are competitive with alternative clustering algorithms. These experiments also indicated that extension of RC repository could improve quality of clustering algorithms. Furthermore, single algorithms composed from RCs showed better performance than consensus clustering frameworks that use traditional single algorithms (e.g. K-means, SOM) [11] [12]. This implies that even better clustering could be achieved if RC based algorithms were to be integrated in consensus-based frameworks. Integration of RC based clustering algorithms into consensus frameworks is an interesting research topic to be tackled in the future. Another direction of future work could be integration of RC based algorithms in meta-learning frameworks. Meta-learning relates performance of algorithms to data distribution and enables automatic selection and ranking of algorithms for a given problem. Even though this is a common approach for selection/ranking of supervised learning algorithms [20], in the area of clustering this is a relatively new and unexplored topic [21]. Still, preliminary results in the area of microarray data clustering [21], [22] are promising. These studies explicitly concluded that clustering meta-learning frameworks would benefit from including a larger number of algorithms. Integration of a large number of RC-based algorithms in the meta-learning framework would be beneficial for solving the problem of algorithm selection for clustering microarray data because recommendations for using an algorithm or specific RCs could be made on the basis of dataset properties.
[4]
[6]
[7]
[8]
[9]
[10]
[11]
[12]
[13]
[14]
[15]
ACKNOWLEDGMENT This work was funded in part by DARPA grant DARPAN66001-11-1-4183 negotiated by SSC Pacific (to Z. Obradovic).
[16]
R. Xu, DC. Wunsch DC, Clustering Algorithms in Biomedical Research: A Review. IEEE Reviews in Biomedical Engineering 3:120-154, 2010. doi:10.1109/RBME.2010.2083647 D. Slonim, From patterns to pathways: gene expression data analysis comes of age. Nature genetics 32:502-508, 2010. G. Kerr, H. Ruskin, M. Crane, P. Doolan: Techniques for clustering gene expression data. Computers in Biology and Medicine, 38:283-293, 2008. R. De Bin and D. Risso, A novel approach to the clustering of microarray data via nonparametric density estimation BMC Bioinformatics 12(49), 2011. B. Andreopoulos, A. An, X. Wang et al., A roadmap of clustering algorithms: finding a match for a biomedical application. Briefings in Bioinformatics 10(3):297-314, 2009. B. Delibašic, K. Kirchner, J.Ruhland, M. Jovanović, M. Vukićević. Reusable components for partitioning clustering algorithms.Artificial Intelligence Review 32, pp.59-75, 2009. M. Vukicevic, B. Delibasic, M. Jovanovic, M. Suknovic, Z. Obradovic Internal Evaluation Measures as Proxies for External Indices in Clustering Gene Expression Data, In: Proceeding of the 2011 IEEE International Conference on Bioinformaticsand Biomedicine (BIBM11), Atlanta, Georgia, USA, Nov. 12-15, 2011. D. Pelleg, A.W. Moore, X-means: extending K-means with efficient estimation of the number of clusters, in: Proceedings of the Seventeenth International Conference on Machine Learning (ICML 2000), Morgan Kaufmann, pp. 727-734, 2011. G. Hammerly, C. Elkan, Learning the k in k-means. In: Proceedings of the seventeenth annual conference on neural information processing systems, pp 281–288, 2003. N. X. Vinh, J. Epps, J. Bailey. Information Theoretic Measures for Clusterings Comparison: Variants, Properties, Normalization and Correction for Chance. J. Mach. Learn. Res 11, pp. 2837-2854, 2010. S. Monti, P. Tamayo, J. Mesirov, and T. Golub, Consensus Clustering: A Resamlping Based Method for Class Discovery and Visualization of Gene Expression Microarray Data, Journal on Machine Learning, 52(1-2), 2003. Z. Yu, H-S. Wong, and H. Wang. Graph-based consensus clustering for class discovery from geneexpression data. Bioinformatics, 23(21):2888– 2896, 2007. Golub, T. R., Slonim, D. K., Tamayo, P., Huard, C., Gaasenbeek, M., Mesirov, J. P., Coller, H., Loh, M., Downing, J., Caligiuri, M., Bloomfield, C., & Lander, E. (1999). Molecular classification of cancer: Class discovery and class prediction by gene expression. Science, 286:5439, 531–537. Su, A. I., Cooke, M. P., Ching, K. A., Hakak, Y., Walker, J. R., Wiltshire, T., Orth, A. P., Vega, R. G., Sapinoso, L. M., Moqrich, A., Patapoutian, A., Hampton, G. M., Schultz, P. G., & Hogenesch, J. B. (2002). Large-scale analysis of the human and mouse transcriptomes. Proceedings of the National Academy of Sciences, 99:7, 4465–447. Bhattacharjee, A., Richards, W. G., Staunton, J., Li, C., Monti, S., Vasa, P., Ladd, C., Beheshti, J., Bueno, R., Gillette, M., Loda, M., Weber, G., Mark, E. J., Lander, E. S., Wong, W., Johnson, B. E., Golub, T. R., Sugarbaker, D. J., & Meyerson, M. (2001). Classification of human lung carcinomas by mRNA expression profiling reveals distinct adenocarcinomas sub-classes. In Proceedings of the National Academy of Sciences, 98:24, 13790–13795. Pomeroy, S., Tamayo, P., Gaasenbeek, M., Angelo, L. M. S. M., McLaughlin, M. E., Kim, J. Y., Goumnerova, L. C., Black, P. M., Lau, C., Allen, J. C., Zagzag, D., Olson, J. M., Curran, T., Wetmore, C., Biegel, J. A., Poggio, T., Mukherjee, S., Rifkin, A., Califano, G., Stolovitzky, D. N., Louis, J. P., Mesirov, E. S., Lander, R., & Golub, T. R. (2002). Gene expression-based classification and outcome prediction of central nervous system embryonal tumors. Nature, 415:6870, 436–442.
259 [17] Yeoh, E.-J., Ross, M. E., Shurtleff, S. A., Williams, W. K., Patel, D., Mahfouz, R., Behm, F. G., Raimondi, S. C., Relling, M. V., Patel, A., Cheng, C., Campana, D., Wilkins, D., Zhou, X., Li, J., Liu, H., Pui, C.-H., Evans, W. E., Naeve, C., Wong, L., & Downing, J. R. (2002). Classification, subtype discovery, and prediction of outcome in pediatric acute lymphoblastic leukemia by gene expression profiling. Cancer Cell, 1:2. [18] Ramaswamy, S., Tamayo, P., Rifkin, R., Mukherjee, S., Yeang, C.-H., Angelo, M., Ladd, C., Reich, M., Latulippe, E., Mesirov, J. P., Poggio, T., Gerald, W., Loda, M., Lander, E. S., & Golub, T. R. (2001). Multi-class cancer diagnosis using tumor gene expression signatures. Proceedings of the National Academy of Sciences, 98:26, 15149–15154. [19] L. Hubert & P. Arabie, Comparing partitions. Journal of Classification, 2, pp. 193–218, 1985.
[20] K. Smith-Miles, Towards insightful algorithm selection for optimization using meta-learning concepts. In: Proceedings of the IEEE International Joint Conference on Neural Networks pp. 4118-4124, 2008. [21] MCP de Souto, RBC Prudencio, RGF Soares et al., Ranking and
selecting clustering algorithms using a meta-learning approach. In: Proceeding of the IEEE International Joint Conference on Neural Networks, pp.3729-3735, 2008 doi: 10.1109/IJCNN.2008.4634333
[22] A. Nascimento, R. Prudencio, M. de Souto, et al., Mining Rules for the Automatic Selection Process of Clustering Methods Applied to Cancer Gene Expression Data. In: Proceedings of the 19th International Conference on Artificial Neural Networks: Part II, Springer-Verlag Berlin, Heidelberg, 2009.