So, based upon these sample data we would conclude that the predictor set does ... to tell SPSS that we want to analyze data only from Experimental students ...
Comparing a Multiple Regression Model Across Groups We might want to know whether a particular set of predictors leads to a multiple regression model that works equally effectively for two (or more) different groups (populations, treatments, cultures, social-temporal changes, etc.). Here's an example… While developing a multiple regression model to be used to select graduate students based on GRE scores, one of the faculty pointed out that it might not be a good idea to use the same model to select Experimental and Clinical graduate students. The way to answer this question is a bit cumbersome, but can be very important to consider. Here's what we'll do… Split the file into a Clinical and an Experimental subfile Run the multiple regression predicting grad gpa from the three GRE scores for each subfile Then compare how well the predictor set predicts the criterion for the two groups using Fisher's Z-test Then compare the structure (weights) of the model for the two groups using Hotelling's t-test and the Meng, etc. Ztest First we split the sample… Data Split File Be sure "Organize output by groups" is marked and move the variable representing the groups into the "Groups Based on:" window Any analysis you request will be done separately for all the groups defined by this variable.
Next, get the multiple regression for each group … Analyze Regression Linear move graduate gpa into the "Dependent " window move grev, greq and grea into the "Independent(s)" window remember -- with the "split files" we did earlier, we'll get a separate model for each group
SPSS Syntax SORT CASES BY program. SPLIT FILE SEPARATE BY program. REGRESSION /STATISTICS COEFF OUTS R ANOVA CHANGE /DEPENDENT ggpa /METHOD=ENTER grev greq grea.
Here's the abbreviated output…
PROGRAM = Clinical (n=64)
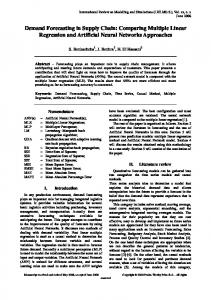
PROGRAM = Experimental (n=76) Model Summaryb
Model Summaryb Model 1
R R Square .835a .698
Adjusted R Square .683
Std. Error of the Estimate .34522
Model 1
R R Square .735a .541
b. PROGRAM = Experimental
b. PROGRAM = Clinical
Coefficientsa,b
Coefficientsa,b
Model 1
Std. Error of the Estimate .39810
a. Predictors: (Constant), Verbal subscore of GRE, Quantitative subscore of GRE, Analytic subscore of GRE
a. Predictors: (Constant), Verbal subscore of GRE, Quantitative subscore of GRE, Analytic subscore of GRE
Unstanda rdized Coefficien ts B (Constant) -.773 Analytic subscore of GRE 2.698E-03 Quantitative subscore of 5.623E-03 GRE Verbal subscore of GRE -1.17E-03
Adjusted R Square .521
Stand ardize d Coeffi cients Beta .200
t -1.287 2.145
Si g. .20 .04
.741
8.070
.00
-.106
-1.314
.19
a. Dependent Variable: 1st year graduate gpa -- criterion variable b. PROGRAM = Clinical
Model 1
(Constant) Analytic subscore of GRE Quantitative subscore of GRE Verbal subscore of GRE
Unstandar dized Coefficient s B -1.099 8.588E-03
Stand ardize d Coeffi cients Beta .754
t -2.04 7.737
Sig. .045 .000
2.275E-03
.314
3.472
.001
-3.212E-03
-.361
-3.48
.001
a. Dependent Variable: 1st year graduate gpa -- criterion variable b. PROGRAM = Experimental
Comparing the Fit -- R² values -- of the two models To compare the "fit" of this predictor set in each group we will use the FZT program to perform Fisher's Ztest to compare the R² values of .698 and .541…
Remember the “Fisher’s Z” part of the FZT program uses R (r) values! Applying the FZT program with ry1 = .835 & N=64 and ry1 = .735 & N=76
gives Z = 1.527 and so p > .05
So, based upon these sample data we would conclude that the predictor set does equally well for both groups. But remember that this is not a powerful test and that these groups have rather small sample sizes for this test. We might want to re-evaluate this question based on a larger sample size. .
Comparing the "structure" of the two models. We want to work with the larger of the two groups, so that the test will have best sensitivity. So, first we have to tell SPSS that we want to analyze data only from Experimental students (program = 2). Data Select Cases
Be sure "If condition is satisfied" is marked and click the "If…" button Specify the variable and value that identifies the cases that are to be included in the analysis
Next we have to construct a predicted criterion value from each group's model. Transform Compute
Finally we get the correlation of each model with the criterion and with each other (remember that the correlation between two models is represented by the correlation between their y' values). Because of the selection we did above these analyses will be based only on data from the Experimental students. Analyze Correlate Bivariate
SPSS Syntax SELECT IF (program = 2).
select experimental cases
COMPUTE clinpred = (.002698*grea) + (.005623*greq) + (.00117*grev) - .773 COMPUTE exppred = (.008588*grea) + (.002275*greq) + (-.0032127*grev) - 1.099.
y’ based on clinical model y’ based on exp model
CORR VARIABLES = gpa clinpred exppred.
get correlations to compare the clinical and experimental group models
Here's the output.. Correlations
1st year graduate gpa -- criterion variable EXPPRED
CLINPRED
Pearson Correlation Sig. (2-tailed) N Pearson Correlation Sig. (2-tailed) N Pearson Correlation Sig. (2-tailed) N
1st year graduate gpa -- criterion variable 1 . 76 .735 .000 76 .532 .000 76
EXPPRED .735 .000 76 1 . 76 .724 .000 76
CLINPRED .532 .000 76 .724 .000 76 1 . 76
Direct R
-- the same as the R from the original multiple regression analysis of the experimental data above.
Crossed R
-- when you apply the weights from the Clinical sample multiple regression model onto the Experimental sample
Model Correlation
-- remember that the correlation between two models is represented by the correlation between their y' values
Remember that the “Hotellings t / Steiger’s Z” part of the FZT program uses R (r) values! Applying the FZT program with ry1 = .735, ry2 = .532 and r12 = .724 and N = 76 gives t = 3.44 & Z = 3.22 Based on this we would conclude there are structural differences between the best multiple regression model for predicting 1st year GPA for Clinical and Experimental graduate students. Inspection of the standardized weights of the two regression models suggests that all three predictors are important for predicting Experimental students grades, with something of an emphasis for the analytic subscale. For the Clinical students, the quant subscale seems the most important, with a lesser contribution by the analytic (and don't get too brave about ignoring the verbal -remember the sample size is small).
Examining Individual Predictors for Between Group Differences in Model Contribution Asking if a single predictor has a different regression weight for two different groups is equivalent to asking if there is an interaction between that predictor and group membership. (Please note that asking about a regression slope difference and about a correlation difference are two different things – you know how to use Fisher’s Test to compare correlations across groups). This approach uses a single model, applied to the full sample… Criterion’ = b1predictor + b2group + b3predictor*group + a If b3 is significant, then there is a difference between then predictor regression weights of the two groups. However, this approach gets cumbersome when applied to models with multiple predictors. With 3 predictors we would look at the model. Each interaction term is designed to tell us if a particular predictor has a regression slope difference across the groups. y’ = b1G + b2P1 + b3G*P1 + b4P2 + b5G*P2 + b6P3 + b7G*P3 +a Because the collinearity among the interaction terms and between a predictor’s term and other predictor’s interaction terms all influence the interaction b weights, there has been dissatisfaction with how well this approach works for multiple predictors. Also, because his approach does not involve constructing different models for each group, it does not allow the comparison of the “fit” of the two models or an examination of the “substitutability” of the two models Another approach is to apply a significance test to each predictor’s b weights from the two models – to directly test for a significant difference. (Again, this is different from comparing the same correlation from 2 groups). However, there are competing formulas for “SE b-difference “. Here is the most common (e.g., Cohen, 1983). b
G1
-b
2
(df
G2
Z = -----------------SE b-difference
bG1
SE
b-difference
=
* SE
bG1
2
) + (df
bG2
* SE
bG2
)
--------------------------------------------√
df
bG1
+ df
bG2
Note: When SEbs aren’t available they can be calculated as SEb = b / t However, work by two research groups has demonstrated that, for large sample studies (both N > 30) this Standard Error estimator is negatively biased (produces error estimates that are too small), so that the resulting Z-values are too large, promoting Type I & Type 3 errors. (Brame, Paternost, Mazerolle & Piquero, 1998; Clogg, Petrova & Haritou, 1995). Leading to the formulas … bG1 - bG2 SE b-difference = √ ( SEbG12 + SEbG22 ) and… Z = --------------------------√ ( SEbG12 + SEbG22 ) Remember: Just because the weight from model is significant and the weight from another model is non significant does not mean that the two weights are significantly different!!! You must apply this to determine if they are significantly different! Here are the results from these models… Predictor Analytic GRE Quantitative GRE Verbal GRE
Clinical Group b SEb** .002698 .001258 .005623 .000697 -.00117 .001258
Experimental Group b SEb** .008588 .000757 .002275 .000665 -.003212 .000923
SEb-diff
Z (Brame/Clogg)
p
.001468 0.0009563 .000156
4.011 3.475 1.309