firm message delivery deadline is required. Our proposed. 1The work was funded in part by NSF grant CNS-0832000 and the Mordecai Wyatt Johnson Program ...
A PRACTICAL ROUTING STRATEGY IN DELAY TOLERANT NETWORKS USING MULTIPLE PIGEONS1 Hui Guo† , Jiang Li‡ , Yi Qian† and Ye Tian‡ National Institute of Standards and Technology Gaithersburg, MD 20899, USA ‡ Department of Systems and Computer Science Howard University, Washington, DC 20059, USA †
ABSTRACT The development of Delay Tolerant Networks (DTN) has attracted significant attention in the networking research community. In this paper, we investigate a new type of delay tolerant network - Homing Pigeon based DTN (HoPDTN) system. In HoP-DTN, each node owns multiple dedicated messengers (called pigeons), and each pigeon will take a round trip starting from its home, through the destination nodes and then return home, disseminating the messages on its way. The proposed scheme is a practical and effective way to overcome end-to-end disconnection in DTN. We obtain the average message delay of the scheme through theoretical analysis. The analytical model is validated by simulations. We also study the effects of several key parameters on system performance. I. I NTRODUCTION One of the major properties of delay tolerant networks (DTN) [1] is that there does not always exist a complete path from a source to a destination. What all existing communication solutions in DTN share in common is that mobile nodes must be exploited to carry messages around the network to overcome path disconnection, which refers to store-carry-and-forward scheme. Most solutions for routing in DTN are reactive approach, where nodes rely on their inherent movements to disseminate data when nodes encounter each other [2][3][4]. Due to unpredictable mobility, this random behavior leads to low delivery rates and large delays. On the other hand, the proactive approach is to introduce extra nodes (messengers) which move around the networks actively for creating chances to re-connect disconnected nodes [5][6][7]. This kind of schemes are more suitable for systems with QoS requirements, e.g., a firm message delivery deadline is required. Our proposed 1 The work was funded in part by NSF grant CNS-0832000 and the Mordecai Wyatt Johnson Program at Howard University.
c 2008 IEEE 978-1-4244-2677-5/08/$25.00 °
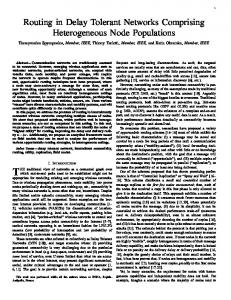
Figure 1. A HoP-DTN Example
homing-pigeon based DTN (HoP-DTN for short) falls into this category. In HoP-DTN, each node in networks owns multiple dedicated pigeons, and the node that a pigeon is dedicated to is called the home node of that pigeon. We assume the distances among the nodes in HoP-DTN are large enough that they are out of the communication range of each other, i.e., there is no realtime communication link between any pair of nodes. When a node has messages for other nodes, its dedicated pigeon will have a round trip starting from the home (source node), traveling through the destination nodes and then return, disseminating the messages on its way, which is a practical and efficient way to overcome the partition in networks. An example of HoP-DTN is shown in Fig. 1. It is easy to extend the model by generalizing that each source or destination node to be an always connected network cluster. Message generation within a cluster corresponds to that of a source node, and message transmission between the clusters corresponds to that between the nodes in the original model. The HoP-DTN model could be used in many real-world scenarios, for example, in message transportation among battlefields or field hospitals, communication between disaster rescue groups or remote disconnected villages, in which usually the entities are partitioned or isolated over a large deployment area. Each entity can be viewed as a
1 of 7
node in our model. The pigeon nodes could be airplanes, vehicles, robots or even human soldiers to transport data between separated areas. The selection of pigeon depends on the application and environment of operation. A requirement of HoP-DTN is that pigeons know the location of other nodes (clusters). This requirement is reasonable as the current location of a node (cluster) could be transmitted to the pigeons through various longdistance communication technologies, such as satellite networks. In this paper, we model and evaluate the proposed HoP-DTN system, and then discuss the major observations from simulation results. The rest of this paper is organized as follows: the next section discusses related work. In Section III, we describe the model and assumptions. Section IV presents detailed analysis of HoP-DTN system. The simulation results are discussed in Section V. Finally, we conclude the paper in Section VI. II. R ELATED WORK Message Ferry [5] and Data Mules [6] are typical work that introduce auxiliary nodes for facilitating message transmission (proactive approach) in DTN. In [8] the authors have also proposed a proactive routing approach named MV routing protocol through controlling the movement of messengers. In general, they all belong to shared messenger scheme. That is, the messengers are shared by all nodes in the network to provide service. The major difference of HoP-DTN with previous proactive approaches is that a messenger (pigeon) in HoP-DTN is owned by its home node and is thus completely under the control of the home node (dedicated messenger scheme). The work in [7] is similar to HoPDTN in that it also proposed ownership concept of messengers, i.e., each messenger only serves a specific node. However, it only considers a one-hop delivery system that a messenger only visits one destination per trip. Furthermore, the study is only based on simulations. We believe that theoretical analysis for a more complicated model provides more insightful views for such kind of system. It was the first work [9] that proposed the home-pigeon routing concept. This work has investigated the system performance through modeling the message delivery process as a queueing system. However, the discussion is based on a couple of simplistic assumptions which do not applicable for real scenario, e.g., each node only owns a single pigeon; the destination nodes are distributed along a one-dimensional path. In this paper we relax these assumptions to make it more close to real-world scenarios.
TABLE I S YSTEM PARAMETERS Parameters n s v λ k m T
Definition The total number of destination nodes Number of pigeons owned by source node The pigeon moving speed Average message arrival rate at the source node Number of messages generated during pigeon’s inter-departure time The number of destinations has been visited by pigeon per trip Round trip time of a pigeon in steady-state
III. T HE M ODEL In a DTN of our interest, we assume one source node and n destination nodes. All the nodes are stationary and are uniformly distributed over the deployment area. Moreover, no real-time communication is feasible between any pair of nodes. Therefore, all messages have to be delivered by pigeons. The procedure of message delivery is described as following: When a message transmission request arrived (or self-generated) at source node, the message is buffered in a FCFS (first come first serve) queue at source node (Fig. 1). Once the next pigeon is available (i.e., a pigeon returns to its home), the pigeon will depart again to deliver this message to its destination. The departure of pigeon is based on ondemand schedule. That is, when a pigeon returns to its home, if there are messages queuing at the home node, the pigeon will start out immediately to deliver all queuing messages. Otherwise, the pigeon will wait until the first message sending request arrives and then start out. Table I shows a list of the symbols used in the following analysis. We also have the following assumptions for analytical model: • • •
•
The data generation at every source node follows a Poisson process with mean rate of λ; Each message picks one of the n recipient nodes as its destination with equal probability; The source node owns multiple pigeons for message delivery. The pigeons move around at a constant speed v . All of generated messages have equal size
As mentioned before, the model we proposed is a dedicated messenger scheme, which is a major difference with previous work where shared messenger scheme were employed. The disadvantages of a shared messenger scheme are that: 1) The route design for messengers can not adapt to dynamic transmission demands from multiple sources. For example, if a node generates a large amount of traffic at one time, the system can not schedule
2 of 7
Figure 2. Pigeon arrival-departure process in single-pigeon system
more messengers visiting on that node because shared strategy stipulates messengers to visit all nodes along with a predetermined route. 2) The data transmission from a source to a destination could be achieved through multi-hop relaying among multiple messengers. Once an intermediate messenger does not have enough buffer or fails to relay data, it would cause huge delay. 3) In a shared messenger scheme the new arrived messenger could be a non-trusted agent for message transmission. In a dedicated messenger scheme, the transmitting node (messenger) must be a trusted one as it can be recognized by its home node. Thus we believe that our dedicated messenger scheme is more favorable for message delivery in DTN. IV. T HE SYSTEM ANALYSIS One of the major performance metrics of DTN is average message delivery delay. The goal of our analysis is to predict the average message delay of HoP-DTN system if the number of pigeons owned by the source is given. It is not difficult to see that message delay includes two components: message delivery time and message waiting time. The former is the time between message departure from the source and message arrival at the destination, and the latter is the time between message generation time at the source and message departure time from the source (or queueing time). We explore the two components separately in the following. A. Message delivery time Let us denote the random variable of message delivery time as X , and the round trip time of a pigeon as T . Clearly, a message delivery time depends on round trip time of the pigeon that carrying this message, and X < T . We utilize steady-state analysis to obtain the round trip time of a pigeon. For simplicity, we analyze single-pigeon system at first, then we extend our results to multiple-pigeon scenario. Fig. 2 illustrates arrivaldeparture procedure of a pigeon in single-pigeon system. In Fig. 2, suppose the pigeon returns/departs at t0 , t1 , t2 respectively, and the periods of T1 , and T2 are the first and second round trip time of the pigeon. Note that
the pigeon departs immediately once it returns, which is reasonable because we only consider the situation under steady-state and suppose that the round trip time of a pigeon is larger than inter-arrival time of messages. During the period of T1 , suppose there are k number of messages arrived and these k messages choosing m number of different nodes as their destinations (m ≤ k ; m ≤ n). Obviously, the round trip time of a pigeon, T2 , is a function of number of destinations (m) it visits, i.e., T2 = f (m), and m depends on the value of k , i.e., m = g(k). Further, k depends on the value of T1 , i.e., k = h(T1 ). Based on these relationships, we can see that T2 is a function of T1 , i.e., T2 = ψ(T1 ). For a long run, the whole system will eventually fall into a steady state, which means the round trip time of pigeons always keeps the same, i.e., T1 = T2 = T . Therefore, we have the equation T = ψ(T ). If we get the expression of function ψ , we can solve the equation for T . For route design of a pigeon, we expect the pigeon would visit m number of destinations with shortest path for minimizing round trip time. We can utilize the solutions of well-studied traveling salesman problem (TSP) [10]. In our analysis, we use a lower bound of TSP path length to calculate round trip time of a pigeon. Suppose m number of nodes randomly distributed in one unit square, according to [12], a lower bound of the shortest path length passing through the m nodes should √ be 0.7078 m + 0.551. Thus we have T = f (m) = √ 0.7078 m+0.551 . Next, we define the variable NT as the v number of messages generated for delivery during the period of T , and then denote P (m|NT = k) as the probability of choosing m number of different nodes as destinations while delivering k number of messages. So we have the relationship between T and k as M in(n,k)
T =
X
m × P (m|NT = k)
(1)
m=1
and from [9] we have µ ¶ µ ¶ m n m kX m j k P (m|NT = k) = ( ) ( ) (−1)m−j m n j m j=1 (2) As we consider the system under steady-state, we can simply obtain the function of h(T ) as k=
T λ
(3)
Clearly, we can not get an explicit expression of equation T = ψ(T ) through Eq-(1), (2) and (3). However, the value of T can be calculated through iterative method by giving an initial estimated value.
3 of 7
Figure 3. Pigeon arrival-departure process in two-pigeon system
Figure 4. Waiting process of messages
To extend the analysis to multiple-pigeon system, Fig. 3 illustrates the pigeons arrival-departure procedure in two-pigeon system, which denotes T1 and T2 as roundtrip time of two pigeons, and t1 and t2 as inter-departure (inter-arrival) time of pigeons. We can see that the round trip time of T2 depends on inter-departure time between current pigeon and the last one (t1 ), i.e., T2 = ψ(t1 ). In steady-state, as the inter-departure time (denoted as η ), round-trip time of pigeons (T ) would approach to fixed values, i.e., t1 = t2 = η and T1 = T2 = T , then we have η = T /2. In consequence, we could calculate T through the equation T = ψ(T /2). Accordingly, in multiplepigeon system where there are s number of pigeons, we do calculation through equation T = ψ(T /s). The calculation can be achieved by simply change Eq-(3) to
nodes. Because of the uniform distribution of destination selection, the probability of selecting any particular node πi (1 ≤ i ≤ m) as the destination of a message is equal, i.e., 1/m. Thus Xm is given by
T (4) λ×s The relationship between average message delay and routing trip time of pigeons is analyzed as follows. Suppose a pigeon route passing through m (1 ≤ m ≤ n) number of destinations can be viewed as a permutation of these destinations, π : π1 , π2 , ..., πm , where πi stands for the node ID that is visited at order i. The round trip time of the pigeon is denoted as Tm . The notation Ei denotes the edge between two nodes of πi−1 and πi . Fig. 1 illustrates an example of pigeon route traveling through 5 destinations. We define Dim as the length of m edge Ei , and D(s,i) as the traveling distance from the source to the destination πi when the pigeon visits m m number of destinations, then D(s,i) can be calculated m m m m by D(s,i) = D1 + D2 + ... + Di . As the nodes are uniformly distributed around the deployment area, for ease of analysis, we assume the random variables Dim are independent each other and have the same expectation, i.e., Dim = Djm (i 6= j). Thus we can get the expected m m = D1m + D2m + ... + Dim = value of D(s,i) as D(s,i)
B. Message waiting time
k=
m ×v i × Dim , and we have Dim = Tm+1 . Accordingly, the expectation of traveling time from the source to the m , can be calculated destination node πi , denoted as T(s,i) m
m = i×Di = i×Tm . by T(s,i) v m+1 We denote the notation Xm as message delivery time when the pigeon visits m number of destination
Xm =
m m X X 1 i × Tm Tm m = × T(s,i) = m m(m + 1) 2 i=1
(5)
i=1
As we consider the average message delivery time in steady-state (m and Tm asymptotically approach to fixed value), the expectation of X is given by X=
T 2
(6)
Individual message waiting time W is the period between the generation of a message and its departure time from the source node. To calculate W , we assume that there are exactly k number of messages generated within the period of pigeons inter-departure time η , and the corresponding message waiting time is denoted as Wk . Let mi (1 ≤ i ≤ k ) denote the i-th message generated during the period of η , and mk as k -th (the last) generated message accordingly. We define βi as the period from the generation of i-th message to that of the k -th one. ε is defined as the period from the generation of k -th message to the next pigeon departure time, and ξ as the inter-generation time between mk and mk+1 . As illustrated by Fig. 4, we have Wk = βi + ε, and ε ≤ ξ . From [9] we have βi = (k − 1)/2λ, and we also know ξ = 1/λ. For simplicity, we assume ε = M ax(ε) = ξ , and then obtain Wk = βi + ε =
k+1 2λ
(7)
We define the random variable Nη as the number of generated message during the period of η . As the message generation process follows the Poisson distribution, we have e−λη (λη)k (8) P (Nη = k) = k!
4 of 7
TABLE II S IMULATION PARAMETERS IN OPNET
Therefore, the expectation of message waiting time is W =
∞ X
Wk × P (Nη = k) =
k=1
=
∞ X k + 1 e−λη (λη)k k=1
2λ
η 1 (1 + e−λη ) + 2 2λ
k!
(9)
From previous analysis we know that η = T /s, where s is the number of pigeons owned by the source. Thus the average message waiting time could be calculated by W =
T 1 (1 + e−λT /s ) + 2s 2λ
(10)
C. Overall message delay The overall message delay, D, is the period from when a message generated at the source node to its receipt time by the destination, which is the sum of the waiting time and delivery time, i.e., D = W +X . Because the random variables W and X are independent of each other, we can get the expectation of message delay (i.e., average message delay) by D =W +X =W +X 1 T + T e−λT /s 1 = (T + + ) 2 s λ
(11)
V. S IMULATIONS We have implemented the simulation of homingpigeon based routing scheme in OPNET Modeler [13]. The primary goal for our simulation is to validate our analysis and to observe the effect of different parameters on the performance of HoP-DTN. The simulation setup and results are presented below. A. simulation setup In our simulations, 50 nodes are randomly distributed around 6 km × 6 km area. We choose one of the nodes as observation node to collect results. The observation node acts as a source node, which generates messages with the average rate of λ. Each message randomly picks any other nodes as the destination with equal probability. The source node owns s number of pigeons that traveling around the deployment area at a speed of v . The transmission range of both the nodes and the pigeons is 200 meters and the data rate is 10 M bps. For TSP route construction, we use the bio-inspired Ant Colony Optimization (ACO) algorithm [11] to compute the pigeons routes. ACO algorithm has been proved to be a successful and low-cost solution to solve the TSP problem. The simulation duration at each time is 12 hours. Simulation parameters are summarized in
Parameters Topology Simulation time # of nodes # of pigeons Pigeon speed Message arrival rate Average message size Communication range Data rate Buffer capacity of pigeon
Default Value 6 km × 6 km 12 hours 50 4 10 m/s 0.05 message/s 9 kBytes 200 m 10 Mbps 45 messages
Value Range N/A N/A N/A 2 - 10 5 - 40 m/s 0.01 - 2.05 8 - 4096 kBytes N/A N/A 10 - 100 messages
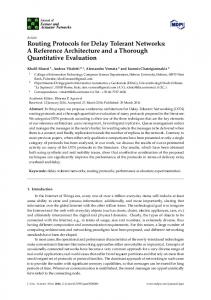
Table II. The default values of parameters are used for all experiments unless otherwise mentioned. The value ranges of parameters are used to evaluate the impact of variation of parameters on simulation results. B. Analytical and simulation results Given the positions of the nodes and the parameters above, we utilize two different scheduling strategies to schedule multiple pigeons: on-demand and storagebased. The process of on-demand scheduling has been described before. The storage-based scheduling means there is a limited capacity of buffer on pigeon node. Each time a pigeon departs from its home, it carries a fixed number of messages for delivery. That is, the pigeon would wait until the predefined storage capacity has been filled up by messages, and then start out. In our experiments, we test the cases when buffer capacity (denoted as ϕ) equals to the size of 15, 45 and 100 messages respectively. Refers to [9] for detailed theoretical analysis on storage-based scheduling. 1) Average message delay: A major performance metric of DTN is the average message delay. Fig. 5 shows the impact of different parameters on average message delay. We present our analytical results for ondemand scheme (dotted lines) and simulation results for both on-demand and storage-based schemes (solid lines). We note that the analytical results match the simulations quite well, showing the accuracy of our derived average message delay, and the on-demand strategy achieves lower delay than storage-based at all scenarios. Fig. 5(a) shows the impact of changing number of pigeons on average message delay. We can see that in on-demand strategy, the message delay decreases dramatically with the increasing of number of pigeons. This demonstrates that on-demand scheduling achieves good system scalability. However, the number of pigeons has much smaller influence on the performance
5 of 7
(a)
(b)
(c)
Figure 5. Average message delay under different parameters
(a)
(b)
(c)
Figure 6. Pigeons traveling distance under different parameters in storage-based scheme. The reason is that in storagebased scheduling, the departure of a pigeon from source depends on the time when its buffer is filled up, instead of available pigeons. Fig. 5(b) presents the impact of increasing λ (message generation rate) on average message delay. We make the following observations. First, in on-demand scheme, average message delay always increases with the increasing of λ, while it is not true for storage-based scheme. It is because that in storagebased scheme, higher message generation rate would fill up the buffer at a pigeon more quickly, which reduce the message waiting time when λ is small. With the increase of λ continues, pigeons still only carry a fixed number of messages per trip, which makes the message waiting time increasing eventually. Second, when the value of λ larger than a threshold (larger than 0.11), the average message delay remains nearly invariable in on-demand scheme, while in storage-based scheme, the average message delay increases continuously with the increasing of λ. This is because in on-demand scheduling, pigeons carry all of messages that are queueing for delivery, while in storage-based scheme as the pigeons always carry fixed number of messages per trip, higher message arrival rate would cause more messages queueing at the buffer of home node. Fig. 5(c) shows the results of average message delay as a function of pigeon speed. Obviously, the increase of pigeon speed would decrease the average message delay. We can see that with the
increase of pigeon speed continues (larger than 25 m/s), the decline of average message delay is not dramatically for both strategies. Thus we conclude that when pigeon speed is small, the increase of speed has more impact on performance enhancement than large speed case. It is obvious that the buffer capacity of pigeon (ϕ) has important effect on message delay in storage-based scheme. The effect of buffer capacity is investigated in [9]. 2) The cost of pigeon movement: Another issue we are concerning about is the cost caused by the movement of pigeon. In HoP-DTN, we assume there is a traveling cost of pigeon, such as energy consumption, mechanical deterioration on pigeon node, and which is proportional to its traveling distance. In our experiments, we look upon traveling distance as the cost of movement for pigeons. Fig. 6 demonstrates the total traveling distance of pigeons during the 12 hours simulation while varying different parameters, including number of pigeons (Fig. 6(a)), message generation rate (Fig. 6(b)) and pigeons speed (Fig. 6(c)). We can see that storage-based strategy always achieves smaller traveling distance (cost) than ondemand strategy (although it incurs worse performance). In addition, we observe that the on-demand samples almost linearly increase with the increasing of number of pigeons and the pigeons speed, while the storagebased samples nearly keep the same with the variation of parameters when the values are large enough. It is
6 of 7
Internet or other traditional networks. VI. C ONCLUSION
Figure 7. Impact of message size on message delay
because that in on-demand scheduling, pigeons have to start out immediately as soon as there are messages queueing at the source. Therefore, the pigeons would travel more times for delivering the same number of messages when they return the source more quickly. However, in storage-based scheduling, pigeons always carry fixed number of messages per trip, which makes their traveling distance always the same. Combining the observations from Fig. 5 and Fig. 6, we find that there is a tradeoff between system performance and pigeons movement cost. Tuning the parameters for achieving lower message delay would definitely incur larger traveling distance of pigeons. How to tune the parameters to balance the tradeoff is a significant issue and leaves in our future research. Also, the results demonstrate that on-demand strategy achieves higher performance (lower message delay) while storage-based strategy achieves smaller cost (smaller traveling distance) of pigeons in general. 3) The impact of message size: Finally, we are interested in the impact of message size on the performance of HoP-DTN. As on-demand strategy achieves better performance of message delay, we only present the results of on-demand scheme. Fig. 7 presents the average message delay while varying the size of messages with a large range from 8 KBytes to 4096 KBytes. We investigate the cases when message generation rate (λ) equals to 0.05, 1.05, and 2.05 respectively. From the results we can see that when λ is small (0.05 message/s), the message size does not have impact on transmission delay. Even though the λ is very large (2.05 messages/s), the message size still have little impact on transmission delay until it is larger than 256 KBytes. The reason is that in DTN, message delivery is primarily achieved through physical movement of nodes instead of real-time communication link. We conclude that except for heavy traffic cases, the size of messages have little influence on message delivery delay, which is an important characteristic of DTN that is different from
In this work we investigate homing-pigeon based delay-tolerant networks, where each node in network owns multiple dedicated messengers, named pigeons, for message delivery. Based on our analysis on the message waiting and delivery processes, the average message delay can be derived. Extensive simulations are conducted to validate our analysis and to investigate some fundamental characteristics of the system. The results demonstrate the accuracy of our analysis. In addition, two different pigeon scheduling strategies are evaluated: on-demand and storage-based. The results show that ondemand strategy achieves better performance although it incurs higher pigeons traveling cost than storage-based strategy. Besides, we conclude that the message size have little influence on message transmission delay in DTN. R EFERENCES [1] K. Fall, “A Delay-Tolerant Network Architecture for Challenged Internets,” in Proceedings of the ACM SIGCOMM, Aug. 2003. [2] A. Vahdat, and D. Becker, “Epidemic routing for partially connected ad hoc networks,” Technical Report CS-200006, Duke University, April 2000. [3] A. Lindgren, A. Doria, and O. Schelen, “Poster: Probabilistic Routing in Intermittently Connected Networks,” in Proceedings of ACM MobiHoc, June 2003. [4] T. Spyropoulos, K. Psounis, and C. Raghavendra, “Spray and wait: An efficient routing scheme for intermittently connected mobile networks,” in Proceedings of Sigcomm workshop on WDTN, 2005. [5] W. Zhao, M. Ammar, and E. Zegura, “Controlling the Mobility of Multiple Data Transport Ferries in a Delay-Tolerant Network,” in Proceedings of IEEE Infocom, 2005. [6] R. C. Shah, S. Roy, S. Jain, and W. Brunette, “Data MULEs: Modeling a three-tier architecture for sparse sensor networks,” in Proceedings of the IEEE International Workshop on Sensor Network Protocols and Applications, May 2003. [7] K. A. Harras and K. C. Almeroth, “Inter-Regional Messenger Scheduling in Delay Tolerant Mobile Networks,” in Proceedings of IEEE WoWMoM, 2006. [8] B. Burns, O. Brock, and B. N. Levine, “MV routing and capacity building in disruption tolerant networks,” in Proceedings of IEEE Infocom, 2005. [9] H. Guo, J. Li, A. N. Washington, C. Liu, M. Alfred, R. Goel, L. Burge, and P. Keiller, “Performance Analysis of Homing Pigeon based Delay Tolerant Networks,” in Proceedings of IEEE Milcom, Oct. 2007. [10] J. Bentley, “Fast algorithms for geometric traveling salesman problems,” ORSA Journal on Computing, 4:387-411, 1992. [11] M. Dorigo, V. Maniezzo, and A. Colorni, “Ant System: Optimization by a Colony of Cooperating Agents,” IEEE Transactions on Systems, Man, and Cybernetics - Part B, 26(1): 29-41, 1996. [12] C. Valenzuela, and A. Jones, “Estimating the Held-Karp lower bound for the geometric TSP,” European Journal of Operational Research, 102:157-175, 1994. [13] OPNET Technologies, Inc., http://www.opnet.com/.
7 of 7