25] R. Kininis, M. E. Shenton, G. Gerig, J. Martin, M. Anderson, D. Metcalf, C. R. G. ... 31] Zhengrong Liang, James R. MacFall and Donald P. Harrington; ...
A Rule-based Fuzzy Segmentation System with Automatic Generation of Membership Functions for Pathological Brain MR Images Chih-Wei Chang, Hao Ying, Gilbert R. Hillman, Thomas A. Kent and John Yen Abstract In this paper, we present a rule-based fuzzy segmentation system that is capable of segmenting magnetic resonance (MR) images of diseased human brains into physiologically and pathologically meaningful regions for display and measurement. We have developed a novel technique to automatically generate the membership functions for the fuzzy sets in the antecedent of the IF-THEN fuzzy rules in our system. Furthermore, our system incorporated anatomical knowledge about brain structures and lesions. More speci cally, our system used the distance between pixels and ventricle boundary as a fuzzy property of periventricular hyperintensity. Using this fuzzy system, we have performed two di�erent types of segmentation tasks: (1) segmentation of brain images without lesions into three classes (grey matter, white matter and cerebrospinal uid); and (2) segmentation of brain images with periventricular lesions into four classes. Fourteen brain images were processed by our rule-based system as well as by the standard fuzzy c-means (FCM) algorithm used for performance comparison. The results, con rmed by the medical experts, showed that the rule-based fuzzy system signi cantly outperformed the standard FCM in the segmentation of the abnormal brain images while the methods performed almost equally for the normal brain images.
1
2
I. Introduction
Magnetic resonance (MR) imaging is one of the most revolutionary technologies development in the history of medical imaging. MR imaging has many di�erent medical applications and the most important one is probably in the diagnosis of brain diseases and in the evaluation of treatment of diseased brains. MR images have been used in clinics in a qualitative manner: the medical personnel reads the MR images, applies his/her specialty knowledge on the images and then reaches subjective conclusions about the images as the diagnosis results. In the analysis of MR images, either by human experts or by computers, image segmentation is generally always an important step that classi es, according to pixel intensity, di�erent brain tissues into di�erent compartments. Many di�erent segmentation methods have been developed for MR images as well as other types of images. Manually tracking the boundaries of di�erent tissues is the most basic technique. Many computer softwares have been developed and been widely used in clinical and research environments [1] [29] [35]. Because of the lack of consistency which is due to the subjective judgments made by di�erent operators, the techniques with reproducible segmentation results are necessary. The development of automatic or semi-automatic segmentation techniques [17] [19] [25] [32] for brain tissues have been extensively conducted [6] [15] [37]. Thresholding is the simplest method. It segments the image according to the pixel intensities [26] [41] [42]. Because of the presence of the bias of intensity, it may fail to segment the images. However, this techniques can combine with human interaction or other techniques to get better results [7] [11] [27]. By applying some edge detector or operator [24] [34] [44] [40], connected edges segment the image into di�erent smaller regions. But, edge detector methods su�er the problem of sensitivity to noise. The images can be segmented according to statistics of collected images or assumed statistical distribution of the pixel intensities [12] [30] [31] [39]. It is hard or impossible to get the parameters of the correct distributions of the images. The assumed distribution may
3
be wrong, too. The statistical methods require good a priori assumptions about image properties and also requires correct adjustment of the parameters in the methods, both of which are di�cult to determine in practice. Structural information of the images, such as links and regions, are used to segment di�erent areas. Mathematical morphology is used to extract the necessary structural information [23]. Several morphological operators are widely used [20], such as erosion, dilation, opening and closing, but they depend on other techniques to provide necessary information, such as seed points. Many di�erent automatic clustering algorithms are used, such as the k-mean algorithm, neural networks and fuzzy clustering algorithms [18] [36] [45]. Neural networks require a large amount of training data and the long training process and the training must be repeated for di�erent image sets (e.g., [2]). Additionally, the pixels used for the training, which are selected manually by the expert, must be in large quantity. The selected pixels must be representative as well. It should be pointed out that it is generally di�cult even for the expert to prepare the training pixels. The fuzzy c-means algorithm (FCM) [4] [5] [14] and its variants have been used for image segmentation with encouraging results (e.g., [8] [18]). Nevertheless, preprocessing and careful selection of the parameters in the algorithms are necessary in order to achieve satisfactory results. Furthermore, FCM approaches have di�culty in incorporating knowledge useful for image segmentation (e. g. anatomical knowledge about brain structures and lesions for processing brain MR images). This kind of algorithms segment images according to the distribution of the pixel vectors in the vector space. But the distribution in the vector space may not have meaningful relation to the actual segmentation. Rule-based systems allow expert knowledge about image processing be explicitly captured in rules [43]. However, parameters in these rules often need to be manually adjusted due to the wide variations of the intensity distribution among di�erent images. Model-based system [3] [13] [21] [22] are similar to the rule-based system. The external knowledge about the brain structure or physiology are incorporated. But the tissue models are not as explicit as the rules in the rule-based system [28] [38].
4
It makes the users di�cult to develop the new tissue models for the new. In this paper, we report the development of a novel hybrid fuzzy system for segmentation of brain MR images. The membership functions of the input images could be generated automatically and applied to other images with the same pulse sequence. The major part of our system was a rule-based fuzzy system that incorporated medical expert knowledge about MR images. It classi ed most pixels in MR images into a given xed number of classes and one unclassi ed class including the pixels fail to t the fuzzy rules. If there is any unclassi ed pixel, the class ed result of the rule-based system is used to calculate the initial cluster prototypes for the later stage of the system, which is a modi ed FCM algorithm employed, in our case, to further classify the unclassi ed pixels. The motivation of our work was to take advantage of the distinct strength of the rule/knowledge-based approach and algorithm-based approach, producing fast and accurate image segmentation [9] [10] [33]. II. Materials and Methods
A. Materials { MR images
Images were acquired with a GE Signa 1.5T MRI instrument and a Technicare 0.6T instrument. T1-weighted (TR=2000ms, TE=60ms), T2-weighted (TR=2000ms, TE=60ms), and proton density (PD) images (TR=2000ms, TE=60ms) were obtained, all with 256 � 256 pixel resolution. These images were acquired in the axial plane. Cerebrospinal uid (CSF) is much brighter than brain tissue in the T2-weighted images, while pathologic hyperintensities are seen clearly in the PD, along with grey matter/white matter contrast. These two pulse sequences provided su�cient contrast to segment the images into four compartments without the use of the T1-weighted images [47]. B. Methods
1. General architecture of our fuzzy segmentation system
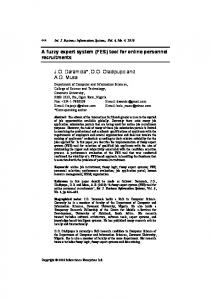
Fig. 1 shows the general architecture of our fuzzy segmentation system. The system
5
consists of two subsystems. The rst subsystem (on the right) uses representative images to compute parameters of membership functions of fuzzy sets in the antecedent of fuzzy rules. The second subsystem segments the images via a fuzzy rule-based segmentation scheme rst and the result is then further segmented by an unsupervised clustering algorithm. The motivation for developing such a system was as follow. The main advantages of rule-based image segmentation include: (1) it is capable of incorporating expert knowledge, and (2) it is fast. However, generally speaking, it is almost impossible to construct rules that can completely and accurately cover all possible situations. Complementarily, an unsupervised clustering algorithm can automatically and completely segment images purely based on distribution of pixel features in the vector space. Nevertheless, due to lack of direction of expert knowledge during segmentation, unsupervised clustering algorithms alone often produce segmentation errors that are trivial to domain expert. We propose to combine the two di�erent schemes to form a hybrid segmentation system, as shown in Fig. 1. Such a system has the distinctive advantages of the both. In addition, the unsupervised clustering algorithm provides a necessary mechanism for assuring the completion of the segmentation task whenever the rule-based scheme fails to segment the whole image. As an important consequence, the system developer can focus on the development of the rule-based scheme without worrying its potential failure. For instance, simultaneous requirement on accuracy and completeness of rule base is often con icting in practice. The use of an unsupervised clustering algorithm as the second stage would enable the developer to attempt to acquire accurate rules without being too concerned about their completeness. The principles and concepts underlying our proposed system are not only desirable but also necessary for segmentation of medical images in many applications, especially for segmentation of brain MR images with lesions. Medical images are probably the most complicate images. There are a vast number of di�erent kinds of lesions and they are di�erent in terms of both image intensity and anatomical location. A medical expert
6
identi es a lesion not only according to its intensity but, much more so, according to its position relative to other anatomical structures. Obviously, any unsupervised segmentation scheme alone fails, as reported in the literature. For rule-based approach, in theory, it can incorporate speci c medical expertise and knowledge regarding lesions and anatomical structure of organs involved. However, practically, this approach alone may not success also because rules are ine�ective in describing complex and variable intensity distribution in multi-spectral images. It is often di�cult to extract fully and accurately expert knowledge to form rule base due to the complex nature of medical images. It is easy to describe the expert knowledge symbolically, which means structure of rules can be determined with relative ease. One of the most widely used rule structure is fuzzy IF-THEN statement. However, it is much more di�cult for medical expert to precisely relate his/her expertise to speci c parameters of the fuzzy sets in the rule antecedent. To overcome this di�culty, we incorporated a parameter identi cation subsystem in our proposed system, as shown in Fig. 3. In the subsystem, number of fuzzy sets is assigned according to number of classes pre-described. The structure of membership functions of the fuzzy sets, being application speci c, is also pre-determined. The subsystem rst uses an edge detection method to compute the edge of a representative image (a typical image among the images to be segmented). The objective of producing the edge image is to obtain later the boundary intensities between two adjacent classes. The resulting edge image together with the preprocessed image are segmented by an unsupervised clustering algorithm into number of classes pre-assigned.
2. An implementation of the proposed general architecture for segmentation of brain MR images
Based on our proposed general architecture, we have constructed a segmentation system for brain MR images to detect lesions, as shown in Fig. 8. The major components of our system are (1) a preprocessing procedure, (2) a procedure for automatically identifying
7
parameters of the membership functions of the fuzzy sets in the rule antecedent, (3) a rule-based fuzzy segmentation system, and (4) a modi ed FCM clustering algorithm. The rule-based fuzzy segmentation system, being the rst stage of segmentation, was designed to achieve classi cation of a major portion of the pixels in images. The second stage segmentation is performed by a modi ed FCM algorithm on any unclassi ed pixels left by the rst stage. B.1 The preprocessing procedure As always, preprocessing is an important step in conditioning the raw images so that they are ready for further processing, such as segmentation. In our system, the preprocessing procedure includes: (1) image registration, and (2) selection of region of interest (ROI). They are shown in Fig. 2.
(1) Image registration The purpose of image registration was to make the same pixel in di�erent images, say T2-weighted and PD images, be in the same two-dimensional coordinate. This step was necessary because some of our images were not acquired simultaneously and some of the patients moved during the image acquisition. We manually registered CSF pixels in a PD image with its corresponding T2-weighted image with the help of a computer program we made. The program provided a friendly user interface for overlapping T2-weighted and PD images and for shifting the PD image in both X and Y coordinates. Once most pixels of the two images were matched, the coordinate shifts of PD images were recorded and the shifted PD image was saved as a registered image.
(2) Selection of ROI Given a MR image, a ROI needed to be selected in order to eliminate the irrelevant
8
portion of the image, making the processing of the image of interest simpler and faster. Because we were primarily interested in the intracranial area of the brain images, it was necessary to separate the scalp and skull from the rest of tissues in the images. Anatomically, the intracranial areas are separated from the skull and scalp by a layer of CSF, with a few apparent small connections where the CSF is thin. This appearance is clear in the longitudinal section and is also true in most slices in either sagittal section or coronal section, except for slices through the spine. To isolate the intracranial area from other areas, we rst manually thresholded the image. We then used a region-growing procedure to grow the empty space outside the brain to surround the intracranial area. Because the intracranial area in our study was always the largest central region in the brain images, the area could be identi ed according to its size and position. As with any region- growing procedure, the appearance of small connections between the brain and the scalp could interfere with ours. We solved this problem by applying an erosion-dilation procedure [23] to the images. The T2-weighted images were used to select the ROI in each image set. Since T2weighted and PD images were registered, we could locate the ROI in PD images according to the ROI in T2-weighted images. B.2 A multi-stage rule-based fuzzy segmentation As shown in Fig. 1, our rule-based fuzzy system consists of automatic generation of the membership functions for the preprocessed images, fuzzy rule base, and fuzzy rule-based segmentation.
(1) Automatic generation of the parameters for membership functions The intensity of each pixel was fuzzi ed by input fuzzy sets. Usually, membership function of a fuzzy set is de ned according to expert knowledge or simply assigned by the system developer. Appropriate de nition is critical in the development of any rule-
9
based fuzzy system, be it a fuzzy control system or image segmentation system. In the case of brain image segmentation, theoretically speaking, if the intensity distribution of the images does not change from patient to patient, the membership functions assigned by the medical expert can be xed and used for di�erent patients. Practically, however, intensity distributions of images acquired by di�erent MR machines, or in some cases even by the same machine with di�erent pulse sequences, are di�erent. Asking the expert to assign di�erent membership functions for di�erent patients is not only time-consuming and expensive but also impractical. To overcome this di�culty, an automatic membership function generation technique was needed, which had to be adaptive to cope with di�erent intensity distributions. We have developed such an automatic membership generation technique for the segmentation of the MR images. We used the technique to generate three membership functions for the segmentation of the normal brain images. For the abnormal brain images, in addition to these three membership functions, we yielded two more membership functions from the PD images. The procedure of identifying the parameters of membership functions is shown in Fig. 2. For the T2-weighted images acquired by our MR machines, we could distinguish three di�erent kinds of tissues: They were WM, GM and CSF. We noticed that there existed one boundary region between WM and GM and another between GM and CSF, which contained mixture of the two intersected types (i.e., WM-GM and GM-CSF) [19]. In these two regions, the pixel intensity changed gradually from one type of tissue to another. We utilized these two regions in the T2-weighted images to de ne the four slopes of the trapezoidal membership functions for the three input fuzzy sets, each of which was for one type of tissue (Fig. 4). More speci cally, the membership functions were generated in the following manner. First, we computed the edge values of all the pixels using Chen's edge detector [16]. Then, we input both T2- weighted image and its edge values to the standard FCM that was requested to classify the pixels into ve classes, namely WM, GM, CSF, WM-GM and GM-CSF. We calculated the mean intensity and variance for
10
these classes. The mean intensities, from lower to higher, was always in the order of WM, WM-GM, GM, GM-CSF and CSF. We used the mean intensities and variances to de ne three membership functions for WM, GM and CSF, respectively, as illustrated in Fig. 4. Here, �i represents the mean of class i and �i represent the varience of class i. These de nitions were intuitive and they produced satisfactory segmentation results as we will show later Fig. 13. Also, for the PD images generated by our MR machines, there existed only two dominant intensities inside the brain: One was light grey and another was dark grey. We fed the PD image along with its edge value to the standard FCM algorithm and initially asked the algorithm to make a three-class segmentation. The segmentation results showed that the very high edge values on the boundary of the brain formed an additional class. To make our membership function generation technique work properly, we instead asked the FCM algorithm to perform a four-class segmentation on the PD image and its edge values. We ignored the class with the highest intensity and used the remaining three classes to de ne two trapezoidal membership functions for the bright grey pixels and the dark grey pixels, respectively. The principle of de ning these two membership functions is the same as that of de ning the three membership functions from the T2-weighted images, as described above. The membership function is shown in Fig. 5. However, the abnormal pixels which have the periventricular hyperintensity have higher pixel intensities in the brighter class than other pixels in the same class. Therefore, we de ned another membership function, as shown in Fig. 6, to get the description of the abnormal regions. The new membership function is called \very bright". To identify periventricular hyperintensity, which often represents lesions, in the PD images, we used a fuzzy set to represent the closeness of a pixel to the boundary of the ventricle. In order to de ne the membership function for the fuzzy set, To nd the ventricle, we rst segmented the T2-weighted image, generating three regions for WM, GM and CSF, respectively. Anatomically speaking, the ventricle is always close to the center
11
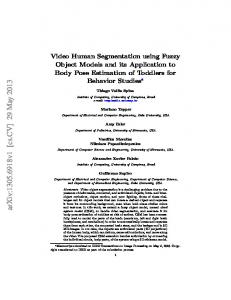
of the brain and looks like CSF in the T2-weighted image. Hence, we located the ventricle as the major connected CSF areas near the center of the brain. Once the ventricle was located, we generated the distance measure by dilating the boundary of the ventricles. A fuzzy set, named \close to the ventricle boundary" was created, whose membership function was de ned over the distance. The closer a pixel is to the boundary of the ventricle, the larger the membership is for that pixel. For the pixels on the boundary, their membership is one. The de nition of the \close to the ventricle boundary" is shown in Fig. 7.
(2) The other components of the fuzzy rule-based system Fuzzi cation is the procedure assigning the memberships to the intensity of pixels. In this study, we always used our above-mentioned membership function generation technique to generate the membership functions for the fuzzi cation of all the images processed. The generated membership functions can be used repeatedly for the images which are acquired at the same time and in the same pulse sequences, because we assumed that the distribution of pixel intensity should not be changed for those images acquired at the same time and in the same pulse sequences. We used two groups of fuzzy rules for the two di�erent objectives: We used the rst group of three rules to segment the T2-weighted images into three classes: grey matter, white matter and CSF and used the second group of four rules to identify the CMV lesions as fourth class in addition to the three classes. Here are the fuzzy rules in the rst group: IF pixel in T2 is Dark THEN pixel is White Matter; (r1-1) � IF pixel in T2 is Grey THEN pixel is Grey Matter; (r1-2) � IF pixel in T2 is Bright THEN pixel is CSF. (r1-3)
�
Becuase we did not know which class the pixels belong before the segmentation, we
12
used \Dark" instead of \White Matter", \Grey" instead of \Grey Matter" and \Bright" instead of \CSF" in the T2-weighted images. In the second group of the rules, we split the last rule in the rst group into two new rules which distinguish CSF and CMV lesion. Because CMV lesions were always located at the periventricular area, the segmentation of the T2-weighted image had to be performed before the identi cation of the lesion detection. As we mentioned in the previous section, the ventricle had to be found to de ne the preventricular area. The lesions which we wanted to identify would only located near the ventricle. These rules constructed a simple three level decision tree which is shown in Fig. 9. The rule r2-4 may not be included, because of the range of \close to the ventricle" is more restricted than \Dark-Grey", It makes almost no di�erence to exclude the rule, r2-4. The following are the rules in the second groups: IF pixel in T2 is Dark THEN pixel is White Matter; (r2-1) � IF pixel in T2 is Grey THEN pixel is Grey Matter; (r2-2) � IF pixel in T2 is Bright AND pixel in PD is Dark-Grey THEN pixel is CSF. (r2-3) � IF pixel in T2 is Bright AND pixel in PD is Very Bright AND pixel is not close to the Ventricle THEN pixel is CSF. (r2-4) � IF pixel in T2 is Bright AND pixel in PD is Very Bright AND pixel is close to the Ventricle THEN pixel is CMV Lesion. (r2-5)
�
These fuzzy rules are self-explanatory and they describe the medical expert knowledge relating pixel intensity in T2-weighted and PD images to di�erent brain tissues and CMV lesions. We used Zadeh fuzzy logic AND (Minimum operator) [46] to evaluate the ANDs in the fuzzy rules. There is a threshold imposed to the memberships generated by the
13
fuzzy rules; and the threshold we used was 0.5. Any pixel whose membership was below 0.5 was labeled as unclassi ed class. The rest of the pixels were defuzzi ed: We chose the class at which the pixel had the highest membership as the class that the pixel belonged to. In case a pixel had two same membership values for two di�erent classes, we would label it as unclassi ed, which was processed along with the other unclassi ed pixels by the next stage of our fuzzy system, FCM algorithm. B.3 Fuzzy c-Means Algorithm We modi ed the FCM algorithm [5] to be the second stage of our fuzzy segmentation system to classify all the pixels labeled as unclassi ed in the rst stage of the segmentation. The standard FCM minimizes the following objective function:
Jm(u(x); v) =
Xk X (u (x))mkx ? v km i=1 x2X
i
i
(1)
where ui(x) is the membership of the intensity x of one pixel, vi is the prototype of pixel class i, k is the number of pixel classes and m is an adjustable parameter whose value should be carefully chosen to achieve satisfactory classi cation. The ways to update the prototypes and to change the memberships are as follow: Prototype updating : Px2X (u0 (x))2x 0 vi = P (ui0 (x))2 (2) x2X i
Membership function :
u0i = Pk 1=kx ? vik 0 2 j =1 (1=kx ? vj k ) 0 2
(3)
Also, FCM requires initial prototype to run. In most applications, people used randomly assigned fuzzy partition to compute the initial prototype. In our system, we used the average of the intensity of the rst-stage-classi ed pixels for each class as the initial prototypes of the FCM algorithm. All pixels were used as the inputs. However, the
14
memberships of the classi ed pixels were normalized and xed during the procedure of the FCM. Therefore, the new error function looks like
Jm0 (u(x); v) =
Xk ( X (u (x))mkx ? v km + X (u (x))mkx ? v km) i i i i i=1 x2Xvar
x2Xfixed
(4)
Here, Xvar is the set of the unclassi ed pixels and Xfixed is the set of the classi ed pixels. We could derive that the two formulas which update the prototypes and the memberships are the same for Xvar , when we keep the memberships of Xfixed xed. Theoretically, the value of the parameter m can be any positive number. However, studies indicated that a value of one to two often yield satisfactory results. More speci cally, it was reported that m = 1:4 gave good brain MR image segmentation [8]. We experimentally trailed m = 1:4 in our study and found it worked well. B.4 Postprocessing The purpose of postprocessing was to correct a small amount of mis-classi ed CMV lesion pixels due to various factors such as slight mis-registration and noise [20]. We calculated the size of the detected lesion areas. If the size was very small, say 10 to 20 pixels, the chances that it was actually a lesion were extremely slim. Thus, we re-classi ed these pixels as CSF. C. Procedure for evaluating the performance of our hybrid segmentation system
It is extremely di�cult, if not impossible, to gain accurate and quantitative ground truth in human brain MR imaging analysis. Because of this, at present, the researchers have mainly relied on medical experts to evaluate and ultimately determine the performance of the proposed segmentation methods and systems. This is to say that there does not exist an objective approach for quantitatively evaluating outcome of any segmentation analysis, including ours. The evaluation method we used is as follow. We segmented brain MR images, with or without lesions, using our hybrid system; and, for
15
comparison purpose, we also segmented the same images using the widely used standard FCM. We did not give the number of classes in the image to our hybrid system prior to the segmentation because the fuzzy rules built in our system were designed to be capable of automatically determining how many classes. In contrast, we had to provide this information (i.e., three classes for the normal brains and four for the brains with the lesions) with the FCM before it segmented the image. To make the performance comparison as fair as possible, we supplied the images with all three pulse sequences to the FCM so that the FCM could achieve the best segmentation performance. We only provided T2-weighted and PD images to our hybrid system as they were su�cient for the segmentation task. The segmentation results produced by the two methods were randomly mixed without labeling for blind evaluation by two local brain MR imaging experts, one was a radiologist and the other neurologist. The original MR images in all the pulse sequences (T1-weighted, T2-weighted and PD) were given to the experts as well. Using their expertise, the experts scored the segmentation results in the scale of 1 to 5 with 5 being the best. The expert evaluation results were then processed. For each image set, the scores from the two experts were averaged for each segmentation method, and the averaged scores were considered as the nal judgment. In addition to the expert evaluation, we tabulated the segmentation results generated by both the methods to provide more quantitative and detailed information on the segmentation outcome. III. Results
A total of fteen image sets were segmented, three of them were brains with the CMV lesions and the remaining 12 were normal brain images. We will rst graphically show some typical segmentation results using the original and processed images to illustrate the performance of the two methods and will then summarize all the segmentation results in a numerical table to provide a global perspective. Fig. 10 shows one set of the original T1-weighted, T2-weighted and PD images with the CMV lesion. Fig. 11 exhibits the edges of the T2-weighted and PD images, which were generated by the Chens edge
16
detector. The segmented images produced by the FCM for the purpose of automatically identifying the parameters of the membership functions are displayed in Fig. 12, and the resulting membership functions are shown in Fig. 13. Since this is a diseased brain, we generated the membership function close to the ventricle boundary whose two dimensional representation is given in Fig. 14. Note that the intensity in the image represents the degree of the membership; the brighter the higher the membership. Fig. 15 demonstrates the nal segmentation outcomes, achieved by our hybrid system (Fig. 15(a)) as well as by the FCM (Fig. 15(b)). In Fig. 15(a), white pixels represent the CMV lesion, dark grey pixels CSF, grey pixels GM and light grey pixels WM whereas in Fig. 15(b) we use four di�erent grey levels to represent four di�erent types of tissue. It is important for us to point out that the FCM is an automatic and unsupervised clustering algorithm and as such one cannot label in advance, in a meaningful and relevant manner, classes in a segmented image. After segmentation, one may be able to assign physical meanings to the classes if the segmentation result is quite accurate. Comparing Fig. 15(b) with Fig. 10, one sees that any of the four gray levels does not correctly describe any of the four known classes. Consequently, the meaning of the four gray levels cannot be related to the brain tissues. This means that the FCM failed to identify the CMV lesions. As can be seen in Fig. 15, our hybrid system successfully identi ed the lesions with high precision, which was con rmed by the MR experts. We obtained similar results for the other two diseased brain image sets. In essence, the FCM grossly misclassi ed the pixels in the abnormal brain images. For the remaining 12 normal brain images, the di�erence between the segmentation results produced by our hybrid system and those by the FCM was much less dramatic than that in the cases of the diseased brains. Both of the methods accomplished the segmentation task satisfactorily but the hybrid system performed better, as con rmed by the MR experts. Fig. 16 shows one such a result. Table 1 summarizes the segmentation results for all the 15 image sets and the table is designed in a way that results obtained by our hybrid system is clearly compared to those gained by
17
the FCM. The outcomes of the expert evaluation are also given. The rst three image sets are the brains with the CMV lesions. The images shown in Fig. 10 are image set No. 1 and the images displayed in Fig. 16 are produced from the image set No. 4. As one can see from the table, our system is far better than the FCM in segmenting the abnormal brain images whereas their performance is quite comparable when processing the normal brain images. In terms of computation speed, the hybrid system was typically 10 to 20 (?) times faster than the FCM. This was because speci cally for these 15 images set, the rst stage of the hybrid system (i.e., the fuzzy rule-based subsystem) happened to classify all the pixels in the images and accomplish the segmentation task. The second stage of the system (i.e., the modi ed FCM) was on idle. IV. Discussion
These three membership functions we used were de ned according the expert knowledge to the images which we used. The de nitions of these memberships functions must be re-de ned, when other di�erent images (e.g., T1-weighted images) are used. However, these membership functions can be generated automatically. The method of determining the membership function is a general method for image processing. It considers both gradient and intensity of the images. Using the speci c properties of the images, we can estimate the membership function. We believe the techniques which are developed and used in this system can be applied to many other medical imaging problems. Fig. 18 shows the partitioning of these four classes in vector space. There are four major areas which would be determined in fuzzy rule-based system; the remaining areas would be determined by FCM. But if we use FCM alone to classify these pixels, it will be a�ected by the amount and the distribution of the CMV lesion pixels, resulting in an unpredictable classi cation. This is the reason why we can get acceptable results in 3-class segmentation by using only the FCM algorithm, but poor results in the four class segmentation case. Although we have obtained good results by using this system, there still may be aspects
18
which can be improved or enhanced. Other special measures or properties can be applied, such as texture images which have been applied to the mammogram []. Other combinations of rule-based fuzzy system and FCM can be considered, and other extensions of FCM can be considered. Although this system can accomplish fully automatic image segmentation, we still suggest incorporating an interactive user interface which enables users to adjust the membership functions. Such an interactive user interface introduces more exibility into the system. In the future, we plan to add more speci c measures and properties to our system, so that users can select the input properties of the image segmentation system for other imaging problems. V. Conclusions
We have developed a two-stage hybrid fuzzy system for the segmentation of human brain MR images with lesions. The rst stage is a rule-based fuzzy subsystem where rules are organized hierarchically and the second stage is a modi ed FCM algorithm. This two-stage architecture takes advantage of the distinct strengths of the rules/knowledgebased (supervised) approach and the algorithm-based (unsupervised) approach, resulting in a faster and more accurate image segmentation system. More importantly, we have developed a novel technique to automatically identify the parameters of the membership functions employed in the fuzzy rules. This makes our system adaptable in that the membership functions can readily be obtained for the MR images acquired in di�erent settings. To demonstrate the e�ectiveness of our system, we segmented 15 brain MR image sets, three of them with the CMV lesions. The results, con rmed by the MR experts, show that our system can quickly and accurately segment both the normal and diseased brain images. Moreover, the comparison results indicate that our two-stage hybrid system dramatically outperformed the popular FCM algorithm in the identi cation of the lesions. In addition, our hybrid system is considerably faster (typically 10 to 20 times), making it possible for clinical use. The two-stage system architecture can easily
19
be adapted to other image segmentation applications by incorporating domain-speci c knowledge in the fuzzy rules. Further, the technique that we have developed in this paper for automatic parameters identi cation of the membership functions can be generalized to automatically generate membership functions for other image processing applications using fuzzy logic. VI. Acknowledgment
Sincerely thanks go to Professor Louis C. Sheppard and the Biomedical Engineering Center of University of Texas Medical Branch at Galveston for supporting this research.
20
References [1] R. W. Albright Jr. and E. K. Fram; \Microcomputer-based Techniques for 3-D Reconstruction and Volume Measurement of Computed Tomographic Images in Part I: Phantom Studies", Investigative Radiology, Vol. 23, No. 12, pp 881-885, 1988. [2] S. C. Amatur, D. Piriano and Y. Tajkefuji; Optimalization Neural Networks for the Segmentation of Magnetic Resonance Images, IEEE Transactions on Medical Imaging, Vol. 11, pp 215-220, 1992.. [3] Louis K. Arata, Atam P. Dhawan, Joseph P. Broderick, Mary F. Gaskil-Shipley, Alejandro V. Levy and Nora D. Volkow; Three-Dimensional Anatomical Model-Based Segmentation of MR Brain Images Through Principle Axes Registration, IEEE Transactions on Biomedical Engineering, Vol. 42, No. 11, pp 1069-1078, Novemember 1995. [4] James C. Bezdek; Fuzzy Mathematics in Pattern Classi cation, Ph.D. Thesis, Cornell University, Ithaca, NY, 1973. [5] James C. Bezdek; Pattern Recognition with Fuzzy Objective Function Algorithms, Plenum Press, New York and London, 1981. [6] James C. Bezdek, Lawernace O. Hall, and L. P. Clark; Review of MR Image Segmentation Teniques using Pattern Recognition, Medical Physis, Vol. 20, pp 1033-1048, 1993. [7] David C. Bonar, Kirt A. Schaper, Jon R. Anderson, David A. Rottenberg, and Stephen C. Strother, Graphical Analysis of MR Feature Space for Measurement of CSF, Grey-Matter, and White-Matter Volumes, Journal of Computer Assisted Tomography, Vol. 17, No. 3, pp 461-470, 1993. [8] Michael E. Brandt, Jack M. Fletcher, and Timothy P Bohan; Estimation of CSF, White, and Grey Matter Volumes from MRIs of Hydrocephalic and HIV-Positive Subjects, Proceedings of the SimTec and WNN 92, pp 643-650, 1992. [9] Chih-Wei Chang, Gilbert R. Hillman, Hao Ying, Thomas A. Kent and John Yen; Segmentation of Rat Brain MR Images using a Hybrid Fuzzy System, Proceedings of NAFIPS/IFIS`94, pp 55-59, San Antonio, Dec. 1994. [10] Chih-Wei Chang, Gilbert R. Hillman, Hao Ying, Thomas A. Kent and John Yen; A Two-stage Human Brain MRI Segmentation Scheme using Fuzzy Logic, Proceedings of FUZZ-IEEE/IFES'95, pp 649-654, Yokohama, March 1995. [11] H. S. Choi, D. R. Haynor, and Y. Kim; Partial Volume Tissue Classi cation of Multichannel Magnetic Resonance Images A Mixed Model, IEEE Transactions on Medical Imaging, Vol. 10, pp 395-407, 1991. [12] H. E. Cline, W. E. Lorensen, R. Kikinis, and F. Jolesz; Three-dimensional Segmentation of MR images of the Head using Probability and Connectivity, Journal of Computing Assistant Tomography, Vol. 14, pp 1037-1045, 1990. [13] S. Dellepiane, G. Venturi, and G. Vernazza; Model Generation and Model Matching of Real Images by a Fuzzy Approach, Pattern Recognition, Vol. 25, pp 115-137, 1992. [14] J. C. Dunn; A Fuzzy Relative of the ISODATA Process and Its Use in Detecting Compact Well-Separated Clusters, Journal of Cybernetics, Vol. 3, No. 3, pp 32- 57, 1973. [15] K.S. Fu and J. K. Mui; A Survey on Image Segmentation; Pattern Recognition, 13:3-16, 1981.
21
[16] Gonzalez, Rafael C. and Woods, Richard C.; Digital Image Processing, Reading, Mass., Addison-Wesley, 1992. [17] G. Gerng, J. Martin, R. Kikinis, O. Kbler, M. Shenton, and F. A. Jolesz; Automatic Segmentation of Dualecho MR Head Data, Information Processing in Medical Imaging, A. C. F. Colchester and D. J. Hawks, Eds, Berlin; Springer-Verlag, 1991. [18] Lawrence O. Hall, Amine M. Bensaid, Laurence P. Clarke, Robert P. Velthuizen, Martin S. Silbiger, and James C. Bezdek; A Comparison of Neural Network and Fuzzy Clustering Techniques in Segmenting Magnetic Resonance Images of the Brain, IEEE Transactions on Neural Networks, Vol. 3, No. 5, pp 672-682, September, 1992. [19] Gilbert R. Hillman, Thomas A. Kent, Alan Kaye, Donal G. Brunder, and Hemant Tagare; Measurement of Brain Compartment Volumes in MR using Voxel Composition Calculations, Journal of Computer Assisted Tomography, Vol. 15, No. 4, pp 640-646, 1991. [20] Gilbert R. Hillman, Thomas A. Kent and J. M. Agris; Measurement of Brain Compartment Volumes from MRI data Using Region Growing and Mixed Volume Methods, SPIE Curves and Surfaces in Computer Vision and Graphics II, pp 372-382, Nov. 1991. [21] B. Johnston, M. S. Atkins, B. Mackiewich and M. Anderson; Segmentation of Multiple Sclerosis Lesions in Intensity Corrected Multispectral MRI, IEEE Transactions on Medical Imaging, Vol. 15, No. 2, pp 154-169, 1996. [22] Micheline Kamber, Rajjan Shinghal, Louis Collins, Gordon S. Francis, and Alan C. Evans; Model-Based 3-D Segmentation of Multiple Sclerosis Lesions in Magnetic Resonance Brain Images, IEEE Transactions on Medical Imaging, Vol. 14, No. 3, pp 442-453, September, 1995. [23] Tina Kapur; Segmentation of Brain Tissue from Magnetic Resonance Images, MIT AI Laboratory, Technical Report No. AITR-1566, January, 1995. [24] David N. Kennedy, Pauline A. Filipek and Verne S. Caviness; Anatomic Segmentation and Volumetric Calculations in Nuclear Magnetic Resonance Imaging, IEEE Transactions on Medical Imaging, Vol. 8, No. 1, pp 1-7, March 1989. [25] R. Kininis, M. E. Shenton, G. Gerig, J. Martin, M. Anderson, D. Metcalf, C. R. G. Guttmann, R. W. McCarley, W. Lorensen, H. Cline, and F. A. Jolesz, Routine Quantitative Analysis of Brain and Cerebrospinal Fuild Space with MR Imaging, Journal of Magnetic Resonance Imaging, Vol. 2, pp 619-629, 1992. [26] L. Kiar, C. Thomsen, F. Gierris, B. Mosdal, and O. Henriksen, Tissue Characterization of Intracranial Tumors by MR Imaging, Acta Radiologica, Vol. 32, pp 498-504, 1991. [27] M. I. Kohn, N. K. Tanna, G. T. Herman, S. M. Resnick, P. D. Mozley, R. E. Gur, A. Alavi, R. B. Zimmerman, and R. C. Gur, Analysis of Brain and Cerebrospinal Fluid Volumes with MR Imaging, Part I: Methods, Reliability and Validation, Radiology, Vol. 178, pp 115-123,1991. [28] Chunlin Li, Dmitry B. Goldgof, and Lawrence Hall; Knowledge-Based Classi cation and Tissue Labeling of MRI Images of Human Brain, IEEE Transactions on Medical Imaging, Vol. 12, No. 4, pp 740-750, 1993. [29] P. Lundin and G. Pedersen; pf Pituitary Macroadenomas: Assessment by MRI, Journal of Computer Assistant Tomography, Vol. 16, No. 4, pp 519-528, 1992.
22
[30] Zhengrong Liang; Tissue Classi cation and Segmentation of MR Images, IEEE Engineering in Medicine and Biology, pp 81-85, March 1993. [31] Zhengrong Liang, James R. MacFall and Donald P. Harrington; Parameter Estimation and Tissue Segmentation from Multispectral MR Images, IEEE Transactions on Medical Imaging, Vol.13, No. 3, pp 441-449, September 1994. [32] Kelvin O. Lim and Adolf Pfe�erbaum; Segmentation of MR Brain Images into Cerebrospinal Fluid Spaces, White and Grey Matter, Journal of Computer Assisted Tomography, Vol. 13, No. 4, pp 588-593, July/August 1989. [33] Young Won Lim, and Sang Uk Lee; On the Color Image Segmentation Algorithm Based on the Thresholding and the Fuzzy c-Means Techniques, Pattern Recognition, Vol. 23, No. 9, 1990. [34] D. T. Long, M. A. King and B. C. Penny; 2-D versus 3-D Edge Detection as a Basis for Volume Quantiation in SPECT, Information Processing of Medical Imaging, pp 457-471, 1991. [35] P. Maeder, A. Wirsen, M. Bajc, W. Schalen, H. Sjoholm, H. Skeidsvoll, S. Cronoqvist and D. H. Ingvar; Volumes of Chromis Traumatic Frontal Brain Lesions Measured by MR Imaging and CBF Tomography, Acta Radiologica, Vol. 32, pp 271-278, 1991. [36] Mehmed Ozkan, Benoit M. Dawant and Robert J. Maciunas; Neural-Network- Based Segmentation of MultiModal Medical Images: A Comparative and Prospective Study, IEEE Transactions on Medical Imaging, Vol. 12, No. 3, pp 534-544, September 1993. [37] Nikhil R. Pal and Sankar K. Pal; A Review on Image Segmentation Techniques, Pattern Recognition, Vol. 26, No. 9, pp 1277-1294, 1993. [38] Sai Prasad Raya; Low-Level Segmentation of 3-D Magnetic Resonance Brain Images | A Rule-Based System, IEEE Transactions on Medical Imaging, Vol. 9, No. 3, pp 740-750, 1990. [39] Tor nn Taxt and Arvid Lundervold; Multispectral Analysis of the Brain Using Magnetic Resonance Imaging, IEEE Transactions on Medical Imaging, Vol. 13, No. 3, pp 470-481, September 1994. [40] J. K. Udupa, S. Samarasekera and W. A. Barrett; Boundary Detection via Dynamic Programming, Proceedings of SPIE: Visualization in Biomedical Computing 1992, Vol. 1808, pp 33-39, Chapel Hill, NJ, 1992. [41] M. W. Vannier, R. L. Butter eld, D. L. Rickman, D. M. Jordan, W. A. Murphy, R. G. Levitt and M. Gado; Multispectral Analysis of Magnetic Resonance Images, Radiology, Vol. 154, pp 221-224, 1985. [42] M. W. Vannier, T. K. Pilgram, C. M. Speidal, L. R. Neumann, D. L. Rickman and L. D. Schertz; Validation of Magnetic Resonance Imaging (MRI) Multispectral Tissue Classi cation, Computer Medical Imaging and Graphics, Vol. 15, p217- 223, 1991. [43] G. L. Vernazza, S. B. Serpico and S. G. Dellepiane; A Knowledge-based System for Biomedical Image Processing and Recognition, IEEE Transactions on Circuits Systems, Vol. CS-34, pp 1399-1416, 1987. [44] D. Williams, P. Bland, L. Liu, L. Farjo, I. R. Francis and C. R. Meyer; Liver-tumour Boundary Detection: Human Observer versus Computer Edge Detection, Investigative Radiology, Vol. 24, No. 10, pp 768-775, October 1989. [45] Zhenyu Wu and Richard Leahy; An Optimal Graph Theoretic Approach to Data Clustering: Theory and Its Application to Image Segmentation, IEEE Transactions on Pattern Analysis and Machine Intelligence,
23
Vol. 15, No. 11, pp 1101-1113, November 1993. [46] L. A. Zadeh; Fuzzy Sets, Information Control, Vol. 8, pp 338-353, 1965. [47] Alex P. Zijdenbos, Benoit M. Dawant, Richard A. Margolin, and Andrew C. Palmer; Morphometric Analysis of White Matter Lesions in MR Images: Method and Validation, IEEE Transactions on Medical Imaging, Vol. 13, No. 4, pp 716- 724, December 1994.
24
White Matter Grey Mater CSF Evaluation Result Image No. Hybrid FCM Hybrid FCM Hybrid FCM Hybrid FCM
1 2 3 4 5 6 7 8 9 10 �11 �12 �13 14
52.70% 47.63% 55.48% 50.37% 50.42% 54.08% 50.34% 57.47% 66.32% 67.13% 49.56% 44.29% 47.01% 37.81%
54.59% 41.69% 53.93% 48.26% 54.42% 46.31% 47.55% 45.39% 40.83% 36.28% 36.77% 42.02% 39.88% 60.18%
39.90% 38.47% 31.50% 36.75% 39.62% 38.02% 43.43% 36.25% 22.04% 22.40% 48.98% 41.12% 43.56% 32.80%
41.09% 38.68% 41.94% 44.69% 41.55% 45.84% 47.12% 37.82% 33.50% 35.31% 47.43% 40.87% 35.72% 35.54%
7.40% 13.90% 13.02% 12.88% 9.96% 7.90% 6.23% 6.29% 11.65% 10.47% 14.25% 16.86% 16.57% 7.03%
4.32% 19.63% 4.13% 7.05% 4.03% 7.84% 5.33% 16.79% 25.68% 28.41% 3.04% 14.84% 17.26% 26.65%
5 4+ 4+ 5 5 5 55 5 5 54+ 55-
Table 1: Segmentation results (�: The image sets with CMV lesions).
2 2 2 2 1 1 2 1 1 11 3 0 0
25
Raw Images to be Segmented
Representative Raw Images
Preprocessing
Preprocessing Preprocessed Images
Preprocessed Images
Identify Parameters of Mambership Functions
Structures of
Membership Functions (Domain Specific) Number of Classes (Domain Specific)
Parameters Multi-Layer
Fuzzy Rules
Rule-Based Segmentation
Classified Pixels
Fuzzy Rule Base
Fuzzy Rules (Domain Specific)
Unclassified Pixels
Generate Initial Prototypes Initial Prototypes Unsupervised Segmentation
Final Segmentation Results
Fig. 1. The General Architecture of a Hybrid Fuzzy Segmentation System with Automatic Identi cation of Rule Parameters.
26
Raw PD Image
Raw T2-weighted Image
Registration Registered PD Image
Select ROI Mask of ROI
Registered & Masked PD Image
Registered T2-weighted Image
Erosion & Dilation
Select ROI Mask of ROI
Registered & Masked T2-weighted Image
Fig. 2. Preprocessing of MR Images.
27
Preprocessed Images
Edge Detector
Edge Images Number of Classes Clustering (Domain-Specific) Crisp Segmentation Calculate Mean & Variance of Pixel Intensity for Each Class Structures of Membership Functions (Domain-Specific)
Means & Variances Calculate Parameters of Membership Functions
Parameters of Membership Function Fig. 3. Identify Parameters of Membership Functions.
28
Membership
Mixture of Dark and Gray µ
Mixture of Gray and Bright µ
2
µ
3
4
1 σ Dark
σ
2
Gray σ
µ - σ2
0
2
σ
3
µ - σ3
4
Bright
3
µ + σ3 µ + σ4
3
3
255
4
Intensity
Fig. 4. Membership function of T2-weighted images.
Membership
Mixture of Bright and Dark-Gray 1 Dark-Gray
0
σ2
µ 2 - σ2
σ2
µ2
µ 2 + σ2
Bright
255
Fig. 5. Original Membership function of PD-weighted images.
Intensity
29
Membership
Mixing of Very Bright Pixels and Dark-Gray Pixels
1 Very
Dark-Gray
Bright µ 2 + σ2
0
µ3
255 Intensity
Fig. 6. Modi ed Membership function of PD-weighted images.
Membership
Boundary of the Ventricle
1 Inside the Ventricle
Outside the Ventricle
0 Distance (in pixels) 16
16 Iternation number of the dilation
Fig. 7. Membership function of \close to the ventricle".
30
Hybrid Segmentation
aw T2-weighted Images
Rule Parameter Identificati
Raw PD Images
Representative Raw T2-weighted Images
Preprocessing
Representativ
Preprocessing
cessing Stage)
Identified Parameters
T2-weighted Images
Identify Parameters of Membership Functions
d and PD Images Segment Images into Normal Tissues
Fuzzy
Rules for Classifying Normal Tissues
Rules Crisp Segmentation
e-based
mentation
Find Ventricle
st Stage)
Location of the Ventricle Calculate the Distance to the Boundary of Ventricle
Identified Parameters
Distance Segment Images into Normal Tissues & Periventricular Hyperintensity
CM
Classified Pixels
ge)
Initial
Generate Initial Prototypes
Fuzzy Rules
Unclassified Pixels
Rule for Classifying Periventricular Hyperintensity
Fuzzy Rule Base
31
Normal Tissue Segmentation
Pixel Intensity
Dark in T2-weighted images
(R1)
Grey in T2-weighted images
(R2)
White Matter
Bright in T2-weighted images
(R3)
Grey Matter Dark-Grey in PD images
Bright in PD images
(R4) CSF Close to the Ventricle
Others
(R5)
(R6) CSF
Periventricular Hyperintensity (e.g. CMV lesion)
Fig. 9. Fuzzy Decision Process.
(a)
(b)
Fig. 10. One set of the normal brain raw images: (a) T2-weighted image and (b) PD image.
32
(a)
(b)
Fig. 11. Regions of Interest: (a) T2-weighted image and (b) PD image.
(a)
(b) Fig. 12. Edge Images: (a) T2-weighted and (b) PD.
(a)
(b)
Fig. 13. FCM Segmentation results used for identi ng the parameters of the membership functions: (a) T2-weighted and (b) PD image.
33
(a)
(b)
Fig. 14. Segmentation results for one normal brain image set: (a) Our system vs. (b) standard FCM. The raw images are shown in Fig. 10.
(a)
(b)
(c)
Fig. 15. One set of abnormal bran raw images: (a) T1-weighted image, (b) T2-weighted image and (c) PD image.
Fig. 16. The distribution of the membership \Close to the Ventricle".
34
(a)
(b)
Fig. 17. Four Class Segmentations: (a) Our system and (b) FCM.