System based on majority voting that can adapt to network changes by steadily exchanging small parts of ... While traditional, signature-based IDS often lag.
Chapter 1 – INC Papers
A Self-Learning Network Anomaly Detection System using Majority Voting D.Hock and M.Kappes Department of Computer Science and Engineering, University of Applied Sciences, Frankfurt am Main, Germany e-mail: {dehock|kappes}@fb2.fh-frankfurt.de
Abstract Network traffic is constantly changing. However, many current Intrusion Detection Systems require somewhat static conditions in order to work properly. In this paper, we propose ongoing training and updating procedures and introduce a self-learning Anomaly Detection System based on majority voting that can adapt to network changes by steadily exchanging small parts of training data. We evaluate the performance of different replacement strategies for this process. Of the evaluated replacement strategies, the replace oldest strategy archived the best results.
Keywords Anomaly Detection, Self-Learning, Majority Voting, Replacement Strategies
1. Introduction As shown in recent surveys, the number of threats has continuously increased, along with their sophistication (Richardson 2011). The prevention of network intrusions and attacks is an increasingly important issue as more and more critical processes and sensitive data depend on network security. One way to detect attacks early on are Intrusion Detection Systems (IDS). Krügel et al. (2005) specified intrusion detection as "the process of identifying and responding to malicious activities targeted at computing and network resources". While traditional, signature-based IDS often lag behind todays attacks, heuristic methods are a promising alternative. Heuristic techniques are often clustered into two categories, namely Misuse Detection and Anomaly Detection (Dokas et al. 2002). Misuse detection recognizes threats by comparing them against a set of known intrusions. Anomaly Detection discovers deviations from normal behaviour. A major advantage of anomaly detection is its ability to detect even unknown and new attacks. Misuse detection can, like traditional systems, only detect attacks which are similar to attacks already known (e.g., been previously learned by the system). The common objective of each Anomaly Detection System is to report intrusive activity. However, not all anomalous activities are also intrusive. A report of an anomalous, but not intrusive activity is called false positive. The disadvantage of heuristic procedures, especially for anomaly detection, are high false positive rates. False positives occur in particular if new types of legitimate network traffic arise such as, e.g., the installation of new distributed programs, the use of new network devices or irregular backup and remote maintenance. 59
Proceedings of the Tenth International Network Conference (INC2014)
Activity Description Not intrusive and not anomalous True Negative (TN): there is no intrusive activity and the system does not report alerts. Intrusive and anomalous True Positive (TP): the activity is intrusive and is reported by the system. Intrusive but not anomalous False Negative (FN): The system fails to detect an intrusive activity, because it is to similar to the expected activity. Not intrusive but anomalous False Positive (FP): The activity is not intrusive, but different from the usual activity and reported by the system. Table 1: Definition of possible outputs For some IDS, up to 99% of alerts can be classified as false positives and are unrelated to network security issues (Pietraszek 2004). While the false negative rate can be improved by combining multiple IDS, it is not possible to reduce a large number of false positives by such means. It is a time-consuming task to distinguish between relevant and irrelevant alerts, which means a high workload for security analysts. A further problem of Anomaly Detection is the so called concept drift (Gates and Taylor 2006), the phenomenon of unexpected change in network traffic over time. Heuristic approaches usually have a learning phase and a productive phase. Anomaly Detection Systems learn the normal behavior of the network in the learning phase, that means they derive a statistical model, e.g., by collecting statistics of network traffic over a period of time, which can be compared later to the statistics of the productive network traffic. Here, we refer to this learned model as "sample". A high rate of false positives can have various causes, but many can be traced back to samples of low quality. The process of learning the typical network behaviour can be a challenging task: If the is training carried out at a bad time, the system might not capture the complete regular behaviour; if there is an attack in the sample, the system might not be able to detect this attack later; if the productive network is not accessible for the developer, he might not be able to create accurate samples. However, even when the current behaviour was captured perfectly, it is very likely that the sample will get outdated soon due to the continuous change of network software, devices and usage. Gates et al. (2006) critically examined current Anomaly Detection paradigms and identified these problems (summarized as problem domain, operational usability and training-data) as main issues concerning todays Anomaly Detection Systems. A possible solution for some of these problems are IDS which automatically adjust with the help of a dynamic update process to the changing network, so-called Self-Learning Systems. Thus, the detection model is updated so that it reflects the most recent network traffic. The continuous manual updating and testing by an operator would be a time-consuming task and cannot be outsourced to a central instance (like for virus scanners) as IDS updates need to be tailored to the environment they operate in and, in general, require detailed customization. Thus, there is a need for methods to be able to optimize and update systems automatically and locally. However, automatically updating such a system may open up new vulnerabilities if attacks are erroneously adjusted for, contaminating the Anomaly Detection System and preventing the detection of such attacks (Kloft and Laskov 2007). In this paper, we propose to solve these issues by combining a self-learning approach with majority voting: Instead of checking against a single model to 60
Chapter 1 – INC Papers
examine the network traffic, our approach compares the traffic to several models which are continuously replaced by improved and better fitting models. At the same time, the redundancy of our training data represents an advantage over noisy data and helps to stepwise replace obsolete data. The remainder of the paper is organised as follows. In the next section, we present our method and its features. We also outline some details of our update and replacement mechanisms. Last but not least, we present the evaluations of the introduced approach. The results include a comparison of performance using different replacement strategies.
2.
Related Work
Since Dorothy Denning published her initial idea about Anomaly Detection (Denning 1987), existing detection mechanisms have been continuously expanded and improved. Resulting methods include Outlier Detection (Dokas et al. 2002), Pattern Analysis (Kim et al. 2004) and Principal Component Classifier (Munz and Carle 2007). However, only few of these approaches have been adopted in productive systems. Of particular relevance to our work are methods that use multiple testing and subsequent combination of the results and methods which have gained interest especially in crowd-based image classification (Bachrach et al. 2012). Kim and Bentley (2002) tested the effect of various parameters (Sample life span, threshold) with self-updating clustering algorithms. Cretu-Ciocarlie et al. (2009) used a Self-Learning System together with n-gram analysis and a simple voting algorithm. Our approach is similar, but differs in the detection algorithm and features. Furthermore, we focused on the evaluation of replacement strategies for automatic update mechanisms. Therefore, we show more advanced strategies than full replacement.
3.
Method
In the following, we will briefly outline the rationale behind our approach. Our method is based on classifying network-traffic by assigning a value from the range [0,1] indicating its abnormality to it. Depending on the value and a threshold, the traffic is then classified as normal or abnormal. Thus, if benign and malignant network traffic receive the same values during training, the result is an area in which we cannot distinguish whether the traffic is normal or intrusive. In practice, not every value is equally often represented, for simplicity we assume for now that the values are normally distributed for sufficiently large data. Yet, the normal distribution is presented merely as an illustration, the actual distribution depends of course on the feature, the user behavior and network characteristics such as the Number of hosts and Operating Systems (e.g., Mah (1997) found that the Packet Sizes for HTTP traffic a heavy-tailed distribution).
61
Proceedings of the Tenth International Network Conference (INC2014)
Figure 1: Relation between overlapping values and ROC-curve The left part of Figure 1 shows such grey areas with the overlapping values with the corresponding Receiver Operating Characteristic (ROC). The red bell-curve (left) shows values representing normal traffic, the blue bell-curve shows values representing intrusive traffic. The p-value stands for the proportion of unambiguous values (the proportion of non-overlapping areas), that means p is the probability for a correct classification. The right side of Figure 1 shows the ratio of the ROC curve (i.e. true and false positive rate ) in relation to the size of the grey area (i.e. grey area = 1-p) for all possible thresholds in [0,1]. For a minimal threshold, all traffic is classified as normal resulting in a point (0,0) whereas for maximal threshold all traffic is classified as abnormal resulting in point (1,1). The larger the area under the ROC curve (and thus the smaller the grey area), the better is the recognition rate. The ROC curve is a measure for the performance of a classification algorithm (in this case we classify traffic as normal or anomalous) and shows the possible combinations of true positive rate TP/(TP+ FN ) and false positive rate TN /(TN + FP) . Depending on the user preferences it is possible to adjust an Anomaly Detection System a) more sensitive and report even slight deviations from the normal behaviour or b) more specific to report only deviations that are definitely intrusive. While a) leads to more false positives, b) leads to more undetected intrusive activities.
Figure 2: Threshold
62
Chapter 1 – INC Papers
Figure 2 shows the effect of the threshold. Every value on the left side of the threshold is classified as not intrusive while every value on the right side is classified as intrusive – the ambiguous values in the overlapping area included. The ROC-Cuve shows the corresponding True and False Positive Rates for this Threshold position. A ROC curve close to the diagonal line indicates a random detection rate. values close to the diagonal represent a same true and false positive rate, which corresponds to the expected detection rate of a random process. The ideal ROC curve first rises vertically to true positive rate close to 1, while false positive error rate initially remains close to 0 before the false positive rate increases. We aim to reduce the grey area by using several samples simultaneously. Thus, noise is smoothed and the influence of outliers is reduced. The following part of this paper introduces a simple algorithm derived from Packet Header Anomaly Detection (PHAD) (Mahoney and Chan 2001) and some features introduced in our earlier papers which focused on a correlation analysis and outlier detection (Hock and Kappes 2013). Our method and features may be also a valid approach detect a wide range of anomalies in practise, but our rationale for this approach is to evaluate the practical use of majority voting and Self-Learning. 3.1. The Anomaly Detection Method In our system, traffic is classified taking into account the following features: 1.
IP.src.Entropy and Dst.Port.Entropy show the probability for the observed distribution of IP Source Addresses and Destination Ports. For example, a Port scan with nmap, that calls 50.000 different ports a single time, generates very small entropy values. Number of Packets to port i valuei = Number of Packets n
Entropy= ∑ p (valuei )log p (valuei ) i=1
2.
Mean.Packet.Size is the mean-value of all packet sizes over a certain time. It can distinguish certain IP Protocols and detect some attacks with unusual small or large packet size. n
Mean. Packet . Size=
1 ∑ Packet . Sizei n i=1
3.
Utilization is the number of packets over time. It can be another evidence for Denial of Service, because many DoS depend on resource exhaustion and therefore generate a lot of network traffic. Number of Packets Utilzation= Time Using these features, PHAD determines the probability of an anomaly, called “anomaly score”, based on the number and last time of previous occurrences of values. The traditional PHAD algorithm looks at the values of Packet Header fields to assign an anomaly score to each Packet. We look at the values of custom features 63
Proceedings of the Tenth International Network Conference (INC2014)
and assign an anomaly score to each Time Window instead. PHAD calculates a probability for the observation of each value and then sums all values to an Anomaly Score. We further use a logarithm to adjust the score to a range between 0 and 1. After the anomaly score was calculated for each sample is applied majority voting. Majority voting can improve the probability of a correct result when there is an initial probability higher than 50% (i.e. random). The new probability majority voting assumes all examples are equally good. Let “p” denote the probability for a correct decision for a sample and assume that p is equal for all samples. The decision accuracy of majority voting method with n completely independent samples is given
ni = Number of times the value was seen in training ri = Unique values in training ti = Time since last occurence featurei =
ti ni ri
score = 0.1log10 featurei by the binomial formula: ((n− 1 )/2)
P Total =
∑
i= 0
n! n− i i p (1− p) i! (n− i) !
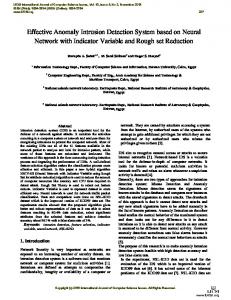
P Total is the probability for the correct classification using majority voting Figure 3 shows the total probability for a correct decision in relation to the quality and the number of samples.
Figure 3: Theoretical improvement of quality through increase of samples In summary, our productive phase can be broken down into three simple steps. At first, we derive our features for the current network traffic. Then we calculate the anomaly score using each of the learned samples. Each anomaly score higher then a 64
Chapter 1 – INC Papers
threshold votes for “anomalous” and each score smaller then the threshold votes for “normal”. The majority of these votes reveals whether the final decision for this time window is “anomalous” or “normal” in form of a value from range [0,1].
FinalDecision =
AnomalousVote AnomalousVote + NormalVote
As seen in Figure 3, the theoretical improvement of the quality, calculated with the binomial formula, diminishes with the number of samples used. For practical purposes, we therefore, we use this amount of samples and if there are more than 15 models, the one with most false positives is deleted to keep resources and time consumption of our method acceptable. 3.2. Update Anomaly Detection Systems need to adept to the environment to deal with the continuously changing network traffic, the so-called concept drift. The manual definition and evaluation of adopted samples would be time consuming tasks. There is the need for an automatic update mechanism. However, a full replacement of the learned sample might lead to several problems such as an decrease of the detection performance due to outlier, noise or the unnoticed learning of attacks. Therefore, our approach evaluates different replacement strategies to update the Anomaly Detection System step by step. The Self-Learning Process first adds a new sample generated from the current traffic and then selects a deletes one of the sample to keep the original number of samples. The selection parameter is defined by the replacement strategy. Some common replacement strategies are: Strategy Replace worst Replace random Replace most similar Replace oldest
Description Deletes the sample that performed worst over an evaluation period. Replaces a random sample, if the new sample fulfils a minimum performance. Calculates a similarity measure and replaces one of the two most similar. Replace the sample added first.
Parameter Performance Performance Similarity chronological order
Table 2: Overview of Replacement Strategies Depending on the replacement strategy, we need to calculate the performance of one or several samples or the similarity between two samples. We consult the correlation as similarity measure: n
corr x, y = xi x yi y / i=1
n
n
x x y y 2
i
i=1
2
i
i=1
65
Proceedings of the Tenth International Network Conference (INC2014)
The performance of a sample is approximated with the proportion of values included in the sample. Therefore, there is the need to perform an evaluation phase and compare the values from the evaluation phase with the values included in the sample: Performance=
4.
Number of values captured by sample Number of total values
Results
In order to test the replacement strategies, we set up an experiment in which network traffic was monitored over a total period of 5 hours. The features, as listed in section 2.1, were calculated for traffic representing a 10 second time window. Samples were created using the features from 15 time windows. The normal network traffic has been created using a Windows PC in a test network with an Internet connection. In addition to the generated traffic from Windows (e.g. ARP, DHCP, ..) we executed typical user activities such as web radio, video streaming, browsing and e-mail. Every 100 seconds an IPv6 Router Advertisement Flood was carried out as proxy for denial of service attacks. A new sample for replacement strategies was offered once
Figure 4: Anomaly Scores over Time 15 new time windows with Anomaly score < 0.5. were available. 66
Chapter 1 – INC Papers
Figure 4 shows two exemplary chosen replacement strategies over the course of time. The x-axis shows the course of time in the form of the score numbers (the traffic is rated in time slots of 10 seconds), the y-axis indicates the probability for a anomaly (given by the majority voting). The upper part of the Figure, is the plot without the exchange of samples, and the lower part shows the same experiment when the oldest sample is replaced. While the black circles show the score for normal traffic (should always be assessed with 0), the red triangles show attacks (should always be assessed with 1). The recognition rate in the upper diagram abruptly decreases after about half the time (the black cloud of points is suddenly more dense in the upper part of the plot). This behaviour usually occurs when the network behaviour changes and the samples get deprecated. The lower diagram with the replace oldest strategy shows a period of adjustment where the deprecated samples get replaced by more fitting samples. After this adaptation phase, the detection rate is again better. The detailed performance of all strategies is shown as a ROC Curve (see Figure 5). As already described in section 2, the result of classification methods (i.e. anomaly detection as well), is always a compromise of detection rate and error rate. This compromise can be generally adjusted by a threshold value. A ROC curve shows all possible combinations of recognition rate and error rate and thereby provides a better view as a single value. We use the area under curve (AUC) as a numerical quality measure (see Table 2). An AUC of 1 represents perfect detection while an AUC of 0.5 represents completely random results. The experiment without replacement achieved, as expected, the worst results. "replace oldest" archived the best results. The replace worst strategy might perform better with another measure for the sample performance.
Figure 5: Experimental Results for Different Replacement Strategies This could be archived by an additional evaluation of each new sample over a period of time or feedback by humans. The influence of additional parameters such as sample size, replacement frequency or recognition method has not been tested here. However, it is evident that the replacement strategy can have, independent from other parameter, significant impact on the quality of the anomaly detection.
67
Proceedings of the Tenth International Network Conference (INC2014)
Replacement Strategy AUC No Replacement 0.692 Oldest 0.825 Worst 0.797 Random 0.735 Most Similar 0.731 Table 3: Area under Curve
5.
Conclusion and Future Work
In this paper, we evaluated Anomaly Detection in combination with majority voting by using several, dynamically updated traffic samples. Our results strongly indicate that multiple samples reduce noise and outliers. Furthermore, majority voting decreases false positives through adapting the system by self-learning. Our long-term goal is to develop and field-test a modern Anomaly Detection System based on the methods outlined in this paper. We focused on the evaluation of replacement strategies to for automatic update mechanisms and showed that the replacement strategy has impact on the quality and can prevent concept drift. The replace oldest strategy archived the best results in our experiments. This work was supported in part by the German Federal Ministry of Education and Research in scope of grant number 03FH005PA2. Responsible for the content are the authors.
6.
References
Bachrach, Y., Graepel, T., Kasneci, G., Kosinski, M. and Gael, J. (2012), "Crowd IQ Aggregating Opinions to Boost Performance", In Proc. of the 11th International Conference on Autonomous Agents and Multiagent Systems, Vol. 1, pp535-542. Cretu-Ciocarlie, G.F., Stavrou, A., Locasto, M.E. and Stolfo, S.J. (2009), "Adaptive Anomaly Detection via Self-Calibration and Dynamic Updating", In Proc. Recent Advances in Intrusion Detection, Springer, pp41-60. Denning, D.E. (1987), "An intrusion-detection model", IEEE Transactions on Software Engineering, pp222-232. Dokas, P., Ertoz, L., Kumar, V., Lazarevic, A., Srivastava, J. and Tan, P. (2002), "Data mining for network intrusion detection", In Proc. NSF Workshop on Next Generation Data Mining, pp21-30. Gates, C. and Taylor, C. (2006), "Challenging the anomaly detection paradigm: a provocative discussion", In Proc. of the 2006 workshop on New security paradigms, ACM, pp21-29. Hock, D. and Kappes, M. (2013), "Using R for anomaly detection in network traffic", In Proc. ITA 13, Fifth International Conference on Internet Technologies and Applications. Kim, J. and Bentley, P.J. (2002), "Towards an Artificial Immune System for Network Intrusion Detection - An Investigation of dynamic Clonal Selection", In Proc. of the 2002 Evolutionary Computation CEC'02, IEEE, Vol. 2, pp1015-1020.
68
Chapter 1 – INC Papers Kim, M., Kong, H., Hong, S., Chung, S. and Hong, J.W. (2004), "A flow-based method for abnormal network traffic detection", In Proc. NOMS 2004, A Network Operations and Management Symposium, IEEE/I-FIP, Vol. 1, pp599-612. Kloft, M. and Laskov, P. (2007), "A poisoning attack against online anomaly detection", In Proc. NIPS Workshop on Machine Learning in Adversarial Environments for Computer Security. Kruegel, C., Valeur, F. and Vigna, G. (2005), "Intrusion detection and correlation: challenges and solutions", Springer, Vol. 14. Mah, B.A. (1997), "An empirical model of HTTP network traffic", In Proc. INFOCOM'97, IEEE, Vol. 2, pp592-600. Mahoney, M. and Chan, P.K. (2001), "PHAD: Packet header anomaly detection for identifying hostile network traffic", Florida Institute of Technology technical report, pp1-17. Munz, G. and Carle, G. (2007), "Real-time analysis of flow data for network attack detection", In Proc. IM'07, 10th IFIP/IEEE International Symposium on Integrated Network Management, IEEE, pp100-108. Pietraszek, T. (2004), "Using adaptive alert classification to reduce false positives in intrusion detection", In Proc. Recent Advances in Intrusion Detection, Springer, pp102-124. Richardson, R. (2011), "CSI computer crime and security survey"
69