Abstract: In this paper, we introduce the Java Anomaly Detection (JAD) library which provides a ... Firestorm NIDS, require extensive knowledge of attack signatures which must be entered ..... der: Tech Law and Policy in the Digital Age, 2011.
JAD: A generic Framework for Network Anomaly Detection using Java Denis Hock, Manuel Grob, Martin Kappes Faculty of Computer Science and Engineering University of Applied Sciences Nibelungenplatz 1 60318 Frankfurt am Main {dehock,manuel.grob,kappes}@fb2.fh-frankfurt.de Abstract: In this paper, we introduce the Java Anomaly Detection (JAD) library which provides a convenient way for the statistical analysis of network traffic for anomalies and intrusions. JAD provides a fully documented generic Java class library with Application Programming Interfaces (APIs) to handle data and heuristic methods for network anomaly detection. The library uses GNU R in the background and thus offers a powerful toolset of well-known statistical methods. Here, we present the salient features of the library and showcase its functionality with examples. Abstract: Supported by: Federal Ministry of Economics and Technology on the basis of a decision by the German Bundestag.
1 Introduction In recent years, IT-systems and their underlying networks have pervaded business and private life and are ubiquitously used in virtually every area. As critical processes depend upon them, their security and reliability is of paramount importance. However, the complexity of networks has increased significantly in their complexity, rendering some of the classical protection mechanisms in some cases as nearly useless. Moreover, attacks on the IT have become more sophisticated. Therefore, network intrusion and network anomaly detection methods have become important components of the IT security infrastructure. Traditional IDS, e.g., Snort, Suricata and Firestorm NIDS, require extensive knowledge of attack signatures which must be entered manually by experts into a database. Hence, novel attacks cannot be detected. Another problem is the time delay from the publication to implementation of an attack signature. For these reasons, the interest in intrusion and anomaly detection techniques based on statistical methods akin to data mining increased over the last years [YE12]. The methods employed by such systems fall into the categories of misuse detection and anomaly detection. Misuse detection concentrates on the direct detection of attacks, e.g., through classification and pattern matching. In principle, such systems act analogously to tradi2198
tional intrusion detection systems but the detection models are generated in a learning process. Well known systems such as IDES, Computer Watch, NIDX, P-BEST and ISOA, use expert systems to perform a signature analysis. STAT, USTAT and NetSTAT are systems that perform a state transition analysis. However, like in traditional systems, only previously trained attacks are detected, novel attacks cannot be found with such methods. Anomaly detection aims at detecting deviations from normal system behavior. Known systems for anomaly detection include Minds, which uses outlier analysis, and Anida [BBK99], a transaction-based system. The most important advantage of anomaly detection is its capability to detect novel and unexpected attacks. However, anomaly detection may lead to false positives, e.g., when new types of legitimate data traffic arise. Legitimate deviations from normal operation is to expected, for example, during a remote maintenance [BBK99][DEK+ 02]. However, most if not all of the systems mentioned above have severe limitations with respect to the integration and evaluation of new intrusion detection methods. Most are heavyweight applications with high configuration effort and many unneeded features. Although many IDS offer an API to develop custom plugins, creating extensions often results in difficulties. Moreover, many systems use black box approaches where algorithms, underlying context information and resulting data are inaccessible for verification. In contrast, our developement includes everything from definition and preparation of features to the implementation of algorithms. Therefore, we created the library JAD. JAD enables its users, e.g., research groups, to build flexible, modular applications to analyse network traffic, easily extend existing IDS/ADS or build lightweight intrusion or anomaly detection systems for research purposes. It allows for a fine-grained analysis of the implemented methods as individual components of a processing pipeline can be split into small tasks (e.g., data cleaning, data transformation, data selection, analysis, etc.) with complete access to the results of the individual steps. Hence, individual steps of an analysis can be verified, checked and validated. Moreover, a roll back of such intermediate steps of the data pre-processing and analysis process is possible. In JAD, common datasets and well-known anomaly detection tasks are predefined and ready to use. Also, several heuristical components can be used. While several other well-known data mining libraries such as, e.g., java-ml, mulan, libsvm, rapidminer, weka and openforecast exist, they are either limited to a very specific tasks (i.e. supporting vector machines or time series only) or are intended for interactive use only. In contrast to these programs, JAD is oriented towards developers that want to leverage a wide range of data pre-processing and -analysis algorithms in their own programs. Regarding the content of the library, JAD’s focus differs somewhat from those of other libraries as it is aimed at network anomaly and intrusion detection. Network traffic has unique characteristics which are often difficult to model with general purpose machine learning libraries. One example is the delay of network traffic. Delay is usually measured by observing differences in Round Trip Time (RTT). However, classic RTT packets (e.g. ICMP) are sometimes manipulated or discarded by network devices, in turn affecting measurement accuracy. JAD already implements field-tested procedures to calculate well-known properties of network traffic, such as delay, jitter, symmetry or throughput.
2199
Common anomaly detection tasks are automated in JAD and would require scripting or user interface interaction to be set up in general machine learning packages such as Weka or Rapid-Miner. In general, the statistical methods used in both intrusion detection and anomaly detection are similar. Therefore we decided to implement a library supporting both anomaly as well as intrusion detection by statistical methods. The remainder of the paper is organised as follows. In the next section, we present our library, its features and architecture. We also outline some details of our implementation. Then, we present some evaluations showcasing how well-known anomaly and intrusion detection methods can be implemented with JAD. We conclude our paper in Section 4.
2 Overview Intrusion detection systems often suffer from not detecting novel attacks. As a matter of fact, IDS require regularly updated databases containing information to somehow describe intrusions. Anomaly detection systems try to fill that gap by detecting abnormal behaviour but may be fooled by disguising attacks into ordinary traffic or ignore attacks because they mistakenly learned poisoned “normal” traffic. In our approach, both types of systems can be viewed as two sides of the same coin: They consist of a set of techniques which can be performed by using statistical methods such as, e.g., correlation analysis or outlier detection as described later on. JAD aims to simplify the development of new anomaly detection methods and is designed for use in many systems. Common anomaly detection tasks have been automated in JAD that generally require scripting or user interface interaction to setup in a general machine learning package such as Weka or Rapid-Miner. The JAD library is implemented on top of GNU R. The R-Project [Rip01] is an statistical environment, distributed under the Open Source GNU GPL (General Public License). It comes with a powerful suite of tools for statistical analysis needed for practical applications, e.g. linear modelling, non-linear regression modelling, time-series analysis or clustering. These tools can be easily extended and shared via interoeperable packages. The usage of R allows a much easier integration of new anomaly detection methods in the JAD library. The access to R is realised via Rserve. Rserve is a server that enables other programs to connect via TCP/IP to an already running instance of R. It allows to use the software from various languages without the need to initialise or link to R. The developer of Rserve states that the main concerns of developing Rserve were speed and ease of use [Urb03]. Some anomaly detection systems already use R for isolated tasks. Several programs are using Rserve to integrate powerful statistical analysis methods into their software. Some projects [HHKA12, Bie12] use Rserve for QoS and resource utilisation forecast with time series analysis. The Bot-Miner detection framework [GPZ+ 08] uses R in combination with Java programs to perform clustering and correlation analysis 2200
on logs to detect bot nets. Statnet [HHB+ 08] is using R in conjunction with custom C programs to perform a statistical network analysis. A network anomaly detection system is a software that analyses network traffic in order to make decisions on the base of heuristic algorithms. Hence, statistical methods are taken into account to distinguish normal from abnormal behaviour. A simple architecture for such statistical-based systems consisting of three steps: Data collection and pre-processing, classification and decision as pointed out in [HLMS90]. However, a single module that does most of the data collection and processing alone leads to many shortcomings, i.e. it may be a bottleneck for the whole system. As a consequence the limited scalability may cause problems. In addition, the handled throughput of the intrusion detection system will be further reduced by logging and capturing activities from different sensors as well as the usage classification algorithms [BGFI+ 98]. A more modern solution is a system with distributed data collection, processing and and monitoring as for example used in distributed intrusion detection systems [SBD+ 91]. Other researches explain the challenge of combining data and information from numerous distributed sensors and offers a more detailed description of the operating principals of intrusion detection systems [Bas00]. Working with Rserve as a bridge between Java and R enables interacting with the R program in a transparent way. Using a TCP/IP connection opens the possibility to perform calculations in R independently from the actual machine both R and JAD is running on. Realising a distributed system of independent sensors gathering information from different places within the network and providing them to a central R appliance is possible in a convenient manner and less effort. As outlined in ealier researches, we can not proceed on the assumption of the availability of complete and clean data for the purpose of intrusion detection [PP07]. There are a plenty of factors to consider like noise in the audit data, mobility of the nodes, and the large amount of data generated by the network itself. Therefore, we need data cleaning to perform checks to insure the collected data is correct and consistent. Furthermore, selected variables often need transformation to improve the differentiability or interpretability for certain statistical models. Taking all of the above mentioned considerations into account, the JAD library has to handle data pre-processing as well as decision making. Also it ought to be used as a distributed system where sensors prepare, e.g., by reducing, data before they transmit it to a central server which summarises and analyses the previously adjusted information. Desired properties of the library are performance, reliability and security. It is usually simpler to develop a performant, reliable and secure application if all subsystems also meet these requirements. There have already been formulated some general characteristics for such systems (e.g. independent of user interaction, fail-safe error recovery or no impact on the operating system) [BGFI+ 98]. Mapping these requirements to our approach, the system must not be heavily supervised. Thus, runtime errors have to be prevented by using features of the programming language such as exception handling or the like. Furthermore, the system has to be inherently type
2201
safe and predictable as well as independent in starting and stopping and transaction safe. JAD defuses the precarious communication to R with type-safe functions. The user can develop with functions and constants instead of directly sending Strings. In case of exceptions, JAD is capable to check and restart all the dependencies, such as Rserve. To not disrupt the normal operation of the system is, in case of JAD, equivalent to high performance and conserving resources. This may partly be achieved within the library, for example with efficient algorithms and support for parallel computations. R is a good tradeoff between performance and available algorithms, the TCP/IP connection via Rserve opens the additional possibility to perform calculations on several different instances of R or even different machines. In contrast to the requirements mentioned earlier, the library has the additional requirement of portability. Since JAD is intended to be used with a wide range of intrusion detection system and different technologies, it should run on embedded hardware as well as on multi-processor workstations with Linux or Windows. This requirement is also fulfilled by Java and R. Further important aspects of the functionality can be gathered from existing intrusion detection systems. They include a wide range of different methods for misuse and anomaly detection. The software Minds uses outlier analysis [EEL+ 04]. Others use neural networks [LC00, RLM98, GS99] or clustering [GPZ+ 08] and correlation analysis or support vector machines [HLV03, MJS02]. However, to support these methods, we do not solely need the statistical methods and models but also the required data pre-processing and evaluation methods. Data pre-processing is widely recognised as an important stage in anomaly detection and has a large impact on the accuracy and capability of network anomaly detection systems [DC11]. Data pre-processing can be divided into three parts: data cleaning, transformation and selection. Data Cleaning summarises the treatment of raw data. In example to correct measurement errors, missing values and check ranges and limits. But also to merge data from different sources, that might have different formats, datatypes and variable names. Data Transformation can be used to improve the differentiability or interpretability of data. One example for data transformation is a normalisation, to remove units (i.e. byte and kilobyte) and center the data to a mean of zero and standard deviation of one. Transformations such as logarithm and square root can improve the linearity, so that a simple linear regression models can be used. Data Selection is the step to reduce or simplify the data to the relevant information required to describe the data accurately. That can be archived by new calculated values, joining, splitting or summarising columns or more complex techniques such as the projection to the principal components.
2202
3 Evaluation of Usage and Usability For evaluating our prior mentioned approaches we used the 1999 DARPA intrusion detection dataset [HFKD00]. The evaluation set consists of training and test data containing network traffic over several weeks. However, for the sake of simplicity we extracted data of a specific attack and without any attack over a time of five minutes each. We chose the Denial of Service (DoS) attack “Ping of Death” which is an attack of oversized ICMP Echo Request packets. Ping of Death attacks can be determined by identifying IP packets greater than 65,536 bytes. Common tools usually exploit the attack by sending ICMP Echo Request (Ping) packets with a payload greater than 64,000 bytes. The DARPA datasets includes known shortcomings such as low traffic rates, the lack of realistic background noise, and, since the simulator is not published, the lack of validation [SOC+ 09]. Furthermore, Mahoney [MC03] argued that the lack of realistic background noise results in particular from a small range of remote client addresses, TTL, TCP options and TCP window size, the lack of IP fragments, garbage data in unused TCP fields, bad checksums, and malformed payloads. Also, the traffic contains deprecated protocols such as FTP and Telnet. Moreover, attacks in the DARPA set are probably obsolete today because the captured data is about ten years old and thus perhaps outdated. Other researches showed that since the invention of computers and networks the number as well as the sophistication of the attacks increased [HH03]. Despite of all inadequacy of the DARPA’99 set, the dataset allows us a sophisticated way to test JAD against certain attack patterns. However, traffic sets such as CAIDA [cai06] or NLANR [McG99] provide traces with attacks and intrusions like worms or Denial of Service attacks but the amount of covered intrusions is limited to four worms and only a few Denial of Service attacks. Furthermore, the documentation of the prior mentioned datasets is rather incomplete and therefore the data has to be selected manually to ensure proper attack patterns [MGL+ 06]. For evaluating JAD, our focus lies on creating statistical models and hence on clean training data. Reports such as the CSI Computer Crime Survey 2011 [Ric11] include statistics on attacks interesting for network anomaly detection such as Denial of Service, Probes or Remote-toLocal-Attacks. As expected the type of network attacks and corresponding tools changed over time. Nevertheless, these kind of attacks are important nowadays as well. Furthermore some of the attacks used in the DARPA dataset are still included in penetration testing suites like Kali Linux1 or its predecessor Backtrack [Lin11]. Modern attacks such as Low Orbit Ion Cannon [Bri11], THC-SSL-DOS [Bho12] or IPv6 Router Advertisement Flooding [HG12] are based on more or less the same methods than older Denial of Services attacks. They either bring a system to consume resources by triggering processes or flood the system with packets. A new factor are the many sourceaddresses. If not sent from botnets then tools likley include options for IP-spoofing to simulate a distributed attack. On the other hand, the attacks are very similar to older Denial of Service versions. The IPv6 Router Advertisement Flooding is one of the newest available methods and does even use another version of the IP protocol. However, the 1 http://www.kali.org.
2203
characteristics of the attack are rather similar between e.g. SYN flooding and Advertisement Flooding. The ratio between incoming and outgoing packets changes. There is an unusual high amount of packets from a certain type (ICMPv6). The exact same indications can be drawn from Ping of Death or SYN-Flood Attacks. Despite all of its shortcomings, the DARPA set can be considered useful as a base line for research. One of the great features of DARPA is the comparability between the different evaluations using this dataset. During researches which tested different IDS using DARPA concluded the bad evaluation results are due to limitations of the systems, not of the dataset itself [TSB08]. Moreover, an IDS cannot claim any more performance on the real network traffic. One of the criticism [MC03] about DARPA states that problems with the DARPA dataset are mainly related to the background traffic and proposed a possible solution by mixing in real background traffic. However, during the evaluation of JAD we did not make huge efforts to mix in real background traffic since our proposed anomaly detection method does not use the effected fields. According to the definitions described above, we selected the properties of network traffic mentioned in table 1. frame.len packet count icmp packet count symmetry
Mean of Frame Length per IP Total packets per IP Total ICMP packets per IP Balance between incoming and outcoming packets Table 1: Properties of network traffic
The properties are used to evaluate our library on anomaly and misuse detection. The former is based on a Local Outlier Detection method mentioned later in this paper. The latter uses the Euclidean Distance to measure the similarity to an attack. Listing 1 shows how to import data in JAD. A sniffer is not part of the library. For simplicity, we chose to read a CSV file in this example. It is also possible to pass the data directly from java as matrix or array. Listing 1: Data Cleaning 1 2 3 4 5 6 7
/ ∗ C r e a t e a new d a t a f r a m e ∗ / D a t a W r a p p e r d a t a f r a m e = new D a t a W r a p p e r ( ) ; / ∗ Read P i n g o f D e a t h s a m p l e a t t a c k from CSV f i l e ∗ / d a t a f r a m e . c r e a t e D a t a F r a m e f r o m C S V ( SAMPLFILE POD ) ; /∗ Replace missing values with 0 ∗/ D a t a T r a n s f o r m t = new D a t a T r a n s f o r m ( d a t a f r a m e ) ; t . replaceNaN ( ”0” ) ;
The next step to generate the network properties for the outlier detection. It is possible to get these values with a single with a single command as shown in Listing 2. However, some user might need to calculate other properties that are not implemented. This can be easily achieved by using filter as shown in Listing 3 Listing 2: Data Selection 1
A r r a y L i s t f i e l d s = new A r r a y L i s t ( ) ;
2204
2 3 4 5
f i e l d s . add ( E O u t p u t P e r I p F i e l d s . IcmpCount ) ; f i e l d s . add ( E O u t p u t P e r I p F i e l d s . MeanIcmpSize ) ; F e a t u r e G e n e r a t o r f g = new F e a t u r e G e n e r a t o r ( d a t a f r a m e ) DataWrapper p r o p e r t i e s = fg . g e n e r a t e ( f i e l d s )
Listing 3: Data Selection 1 2 3 4 5 6 7 8 9 10 11 12 13 14 15 16 17 18 19 20 21 22 23
/ ∗ D e r i v e some p r o p e r t i e s o f t h e n e t w o r k t r a f f i c ∗ / A r r a y L i s t f i e l d s = new A r r a y L i s t ( ) ; f i e l d s . add ( E O u t p u t P e r I p F i e l d s . IcmpCount ) ; f i e l d s . add ( E O u t p u t P e r I p F i e l d s . MeanIcmpSize ) ; / ∗ C r e a t e empty d a t a f r a m e w i t h t h e f e a t u r e s d e f i n e d i n f i e l d s ∗ / out . createEmptyDataFrame ( f i e l d s ) ; /∗ Return l i s t with unique IP s o u r c e a d d r e s s ∗/ S i m p l e O p e r a t i o n s s o 1 = new S i m p l e O p e r a t i o n s ( t ) ; A r r a y L i s t u n i q u e I p s = s o 1 . u n i q u e ( E I n p u t F i e l d s . i p s r c ) ; /∗ C a l c u l a t e p r o p e r t i e s f o r each IP ∗/ f o r ( S t r i n g elem : u n i q u e I p s ) { D a t a T r a n s f o r m i p S c r = new D a t a T r a n s f o r m ( t ) ; /∗ F i l t e r f o r p a c k e t s of each IP ∗/ i p S c r . f i l t e r E q u a l s ( E I n p u t F i e l d s . i p s r c , elem ) ; / ∗ Get mean f r a m e l e n g t h and p a c k e t c o u n t ∗ / S i m p l e O p e r a t i o n s s o = new S i m p l e O p e r a t i o n s ( i p S c r ) ; S t r i n g mean = S t r i n g . v a l u e O f ( s o . mean ( E I n p u t F i e l d s . f r a m e l e n ) ) ; S t r i n g count = S t r i n g . valueOf ( ipScr . getObservationCount ( ) ) ; / ∗ Add row t o o u p u t d a t a f r a m e ∗ / S t r i n g [ ] o u t p u t = { c o u n t , mean } ; o u t . a d d O b s e r v a t i o n ( o u t p u t ) ; }
To calculate the mentioned outlier factors, the method needs the distance to the k-nearest neighbours where A is the current value, B is a neighbour value and n denotes the number of used neighbours. distance denotes a euclidian distance between a value and a neighbour whereby Bi specifies the current neighbour taken into account. Pn distance(Bi ) md = i=1 (1) n rd (A, B ) = max (md, distance(A, B))
(2)
However, the LOF takes not only the distance but also the density of the k-nearest neighbours into account. Namely the Local Reachability Density. 1
lrd (A) = Pn
(3)
Bi rd(A,Bi ) i=1 n
Overall the final factor is calculated by the following formular: LOF (A) =
lrd(Bi ) i=1 lrd(A)
Pn
(4)
n
JAD can return the factors as ArrayList as shown in Listing 4. 2205
1200 1000 800 600
Frame length in bytes
400 200
0
200
400
600
800
1000
Packet count per IP
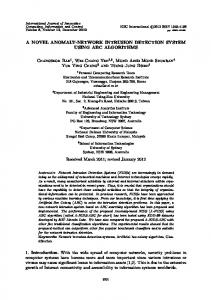
Figure 1: Traffic sample without attack
Listing 4: Local Outlier Detection 1 2
O u t l i e r D e t e c t i o n o u t l i e r = new O u t l i e r D e t e c t i o n ( o u t ) ; A r r a y L i s t r e s u l t = o u t l i e r . l o f ( ) ;
To visualise the results of our implementation we use plots generated by R. These plots show the scattering of the observations. The x-axis shows the number of packets per IP whereas the y-axis determine the length of each frame in bytes. Every point represents the properties of a unique IP address. To better distinguish each value different symbols are used to outline more significant observations. A circle including a cross means highest, a triangle mid-level and a circle least significance. Unfortunately, using the raw data of the properties introduced in table 1 leads to unexpected results. Due to the fact the sample of the attack mostly contains data about the specific intrusion the calculation of the Local Outlier Factor cannot clearly distinguish between normal and abnormal packets. This behaviour can be proven in figures 1 and 2, where are no significant differences between normal (fig. 1) and abnormal (fig. 2) traffic can be distinguished. In other words there are no values with a high significance i.e. circles including a cross. The solution to this problem is normalisation. In general, normalisation means to subtract the mean from each feature and divide the values of each feature by the standard deviation. As a result the values of each feature in the data have zero-mean and unit-variance. center (x ) =
x − mean(x ) sd(x)
(5) 2206
1500 1000
Frame length in bytes
500
0
100
200
300
400
500
600
Packet count per IP
2 1 0 −1
Centered frame length in bytes
3
Figure 2: Traffic sample with attack
0
1
2
3
Centered packet count per IP
Figure 3: Centered traffic without attack
2207
4
5
3 2 1
Centered frame length in bytes
0 −1
0
1
2
3
Centered packet count per IP
Figure 4: Centered traffic including attack
If we use the mean value and standard deviation of sampled normal traffic instead of the local mean value and standard deviation, then we can see the difference to the expected normal traffic. The outlier detection will now return low outlier factors for normal traffic and high values for everything different to the sampled normal traffic. Figure 3 and 4 show the visualisation of the centralised factors. Now, the outlier analysis of the sample including normal traffic does not contain any remarkable values whereas the LOF of the one including the attack shows a highly significant observation. As mentioned earlier, one important requirement of the library is to roll back complex operations. This can be archived by using the DataTransform class. By creating a DataTransform, JAD will create a copy of the dataset in R and not alter the original data frame. So it is possible to implement the command-pattern for sets of data preparation tasks. Listing 6 shows how to normalise a column in a data frame. Listing 5: Data Transformation 1 2 3 4 5 6 7 8 9 10 11
/ ∗ C e n t e r i n g t h e d a t a r e s u l t s i n a mean v a l u e o f z e r o and a s t a n d a r d ∗ d e v i a t i o n of 1 ∗/ D a t a W r a p p e r n o r m a l D a t a = new D a t a W r a p p e r ( ) ; n o r m a l D a t a . createDataFrameFromCSV ( SAMPLEFILE NORMAL ) ; D a t a T r a n s f o r m n o r m a l = new D a t a T r a n s f o r m ( n o r m a l D a t a ) ; Double mean = n o r m a l . mean ( E I n p u t F i e l d . f r a m e l e n ) ; Double s d = n o r m a l . s d ( E I n p u t F i e l d . f r a m e l e n ) ; / ∗ We u s e mean and s d o f t h e n o r m a l s a m p l e ∗ / D a t a W r a p p e r a t t a c k D a t a = new D a t a W r a p p e r ( ) ; a t t a c k l D a t a . readDataFrameFromCSV ( SAMPLEFILE ATTACK ) ;
2208
12 13
D a t a T r a n s f o r m a t t a c k = new D a t a T r a n s f o r m ( a t t a c k D a t a ) ; a t t a c k . s t a n d a r d i s e ( E I n p u t F i e l d s . f r a m e l e n , sd , mean ) ;
As an example for misuse detection we chose to calculate the similarity to the properties of a traffic sample. Therefore, we have a sample containing only packets of a Ping of Death attack and another sample containing the Ping of Death attack and additional normal traffic from other IP addresses. As similarity measure we used the Euclidean Distance. v u n uX dist(A, B ) = t (Ai − Bi )2
(6)
i=1
As for the outlier detection, we summarised the properties of a specific IP address by deriving the number of ICMP packets, frame length, symmetry and packet count. Furthermore, we centered each record with the mean and standard deviation of the PoD sample. Table 2 shows the Euclidean Distance between the properties of the attack and the properties of the packets of each IP address. The distance to the IP address sending the PoD is much more less than the distance to any other IP address. Distance 1453.509 1444.446 1427.933 1403.346 1369.513 1432.745 1383.084 1.632 1454.011 916.019 916.019
IP Address 208.253.77.185 172.16.112.50 172.16.112.20 192.168.1.20 172.16.116.44 192.168.1.10 207.103.80.104 135.13.216.191 172.16.115.5 207.103.80.104
Sample Type Normal Normal Normal Normal Normal Normal Normal Ping of Death Normal Normal Normal
Table 2: Results of the Euclidean Distance Listing 6: Distance 1 2 3 4 5 6 7 8 9 10 11 12 13
/ ∗ C e n t e r i n g t h e d a t a r e s u l t s i n a mean v a l u e o f z e r o and a s t a n d a r d ∗ d e v i a t i o n of 1 ∗/ D a t a W r a p p e r d a t a f r a m e = new D a t a W r a p p e r ( ) ; / ∗ Read d a t a f r a m e w i t h n o r m a l t r a f f i c and a t t a c k ∗ / d a t a f r a m e . createDataFrameFromCSV ( SAMPLEFILE ATTACK ) ; /∗ Generate p r o p e r t i e s ∗/ A r r a y L i s t f i e l d s = new A r r a y L i s t ( ) ; f i e l d s . add ( E O u t p u t P e r I p F i e l d s . IcmpCount ) ; f i e l d s . add ( E O u t p u t P e r I p F i e l d s . P a c k e t C o u n t ) ; f i e l d s . add ( E O u t p u t P e r I p F i e l d s . Symmetry ) ; f i e l d s . add ( E O u t p u t P e r I p F i e l d s . MeanFrameLength ) ; F e a t u r e G e n e r a t o r f g = new F e a t u r e G e n e r a t o r ( d a t a f r a m e ) ;
2209
14 15 16 17 18
DataWrapper p r o p e r t i e s = fg . g e n e r a t e ( f i e l d s ) ; / ∗ C a l c u l a t e t h e d i s t a n c e t o V e c t o r POD TRAINING f o r e a c h row ∗ / S i m p l e O p e r a t i o n s s o = new S i m p l e O p e r a t i o n s ( p r o p e r t i e s ) ; Double [ ] d i s t = s o . d i s t a n c e ( POD TRAINING )
The JAD library is released under GNU GPL license and already used by several projects. The project is on GitHub as a binary or source distribution available and maintained by the Research Group for network security, information security and privacy. A website along with a well-maintained wiki contains online documentation with user oriented sections, such a ’Getting Started’ and ’Examples’, as well as developer-oriented sections, such as ’Architecture’ and ’Contributors Guide’. The project adepts the policies of the Open Maturity Models to ensure a qualitative open source project management.
4 Conclusion and Future Work In this paper we introduced JAD, an Open Source library to implement intrusion detection and anomaly detection systems. By using Rserve as a client/server system between Java and GNU R via TCP/IP connections we are able to easily develop distributed systems for statistical analysis of network traffic. JAD offers an easy way to develop cross-platform applications by using Java and R which both are supported on many platforms. By evaluating JAD with two examples of anomaly and misuse detection we showed the application of Local Outlier Factors and Euclidean Distance to perform both techniques used in intrusion and anomaly detection systems. Deriving variables like delay or symmetry is an easy task within JAD to detect outliers or calculate distances for intrusion detection. Future work includes developing more methods for both anomaly and misuse detection. Furthermore we will implement multivariate data analysis techniques for more meaningful extracting information. The library has been field tested and therefore is already used in various research projects. Moreover, we especially put the focus on productive environments and hence take the weaknesses of the DARPA test set into account.
References [Bas00]
Tim Bass. Intrusion detection systems and multisensor data fusion. Communications of the ACM, 43(4):99–105, 2000.
[BBK99]
R. B¨uschkes, M. Borning, and D. Kesdogan. Transaction-based anomaly detection. In Proceedings of the Workshop on Intrusion Detection and Network Monitoring (USENIX Assosiation, 1999.
[BGFI+ 98] Jai Sundar Balasubramaniyan, Jose Omar Garcia-Fernandez, David Isacoff, Eugene Spafford, and Diego Zamboni. An architecture for intrusion detection using au-
2210
tonomous agents. In Computer Security Applications Conference, 1998. Proceedings. 14th Annual, pages 13–24. IEEE, 1998. [Bho12]
Sukalp Bhople. Server based DoS vulnerabilities in SSL/TLS Protocols. 2012.
[Bie12]
Tillmann Carlos Bielefeld. Online performance anomaly detection for large-scale software systems. Master’s thesis, Department of Computer Science, University of Kiel, Germany, 2012.
[Bri11]
Peter Bright. Anonymous speaks: The inside story of the HBGary hack. Law & Disorder: Tech Law and Policy in the Digital Age, 2011.
[cai06]
CAIDA: Cooperative association for internet data analysis, 2006.
[DC11]
Jonathan J Davis and Andrew J Clark. Data preprocessing for anomaly based network intrusion detection: A review. Computers & Security, 30(6):353–375, 2011.
[DEK+ 02] P. Dokas, L. Ertoz, V. Kumar, A. Lazarevic, J. Srivastava, and P.N. Tan. Data mining for network intrusion detection. In Proc. NSF Workshop on Next Generation Data Mining, pages 21–30, 2002. [EEL+ 04]
Levent Ertoz, Eric Eilertson, Aleksandar Lazarevic, Pang-Ning Tan, Vipin Kumar, Jaideep Srivastava, and Paul Dokas. Minds-minnesota intrusion detection system. Next Generation Data Mining, pages 199–218, 2004.
[GPZ+ 08] Guofei Gu, Roberto Perdisci, Junjie Zhang, Wenke Lee, et al. BotMiner: Clustering analysis of network traffic for protocol-and structure-independent botnet detection. In Proceedings of the 17th conference on Security symposium, pages 139–154, 2008. [GS99]
Anup K Ghosh and Aaron Schwartzbard. A study in using neural networks for anomaly and misuse detection. In Proceedings of the 8th USENIX Security Symposium, volume 8, pages 141–152. Washington DC: ASME Press, 1999.
[HFKD00] Joshua W. Haines, David J. Fried, Jonathan Korba, and Kumar Das. The 1999 DARPA off-line intrusion detection evaluation. Computer Networks, 34:579–595, 2000. [HG12]
Erwin Hoffmann and Manuel Grob. What is wrong with the IPv6 RA protocol? University of Applied Sciences Frankfurt am Main, IPv6-Kongress Frankfurt am Main, 2012.
[HH03]
Simon Hansman and R Hunt. A taxonomy of network and computer attack methodologies. Retrieved March, 22:2007, 2003.
[HHB+ 08] Mark S Handcock, David R Hunter, Carter T Butts, Steven M Goodreau, and Martina Morris. statnet: Software tools for the representation, visualization, analysis and simulation of network data. Journal of Statistical Software, 24(1):1548, 2008. [HHKA12] Nikolas Roman Herbst, Nikolaus Huber, Samuel Kounev, and Erich Amrehn. Workload Classification and Forecasting. Master’s thesis, Department of Informatics Institute for Program Structures and Data Organization, Karlsruhe Institute of Technology, Germany, 2012. [HLMS90] Richard Heady, George Luger, Arthur Maccabe, and Mark Servilla. The architecture of a network-level intrusion detection system. Department of Computer Science, College of Engineering, University of New Mexico, 1990. [HLV03]
Wenjie Hu, Yihua Liao, and V Rao Vemuri. Robust support vector machines for anomaly detection in computer security. In Proc. 2003 International Conference on Machine Learning and Applications (ICMLAˆa03), 2003.
2211
[LC00]
Richard P Lippmann and Robert K Cunningham. Improving intrusion detection performance using keyword selection and neural networks. Computer Networks, 34(4):597– 603, 2000.
[Lin11]
Backtrack Linux. Backtrack Linux-Penetration Testing Distribution. BackTrack Linux, 2011.
[MC03]
Matthew V Mahoney and Philip K Chan. An analysis of the 1999 DARPA/Lincoln Laboratory evaluation data for network anomaly detection. In Recent Advances in Intrusion Detection, pages 220–237. Springer, 2003.
[McG99]
Tony McGregor. NLANR active measurement project. In Proceedings of Measurement and Analysis Collaborations Workshop, 1999.
[MGL+ 06] Frederic Massicotte, Francois Gagnon, Yvan Labiche, Lionel Briand, and Mathieu Couture. Automatic evaluation of intrusion detection systems. In Computer Security Applications Conference, 2006. ACSAC’06. 22nd Annual, pages 361–370. IEEE, 2006. [MJS02]
Srinivas Mukkamala, Guadalupe Janoski, and Andrew Sung. Intrusion detection using neural networks and support vector machines. In Neural Networks, 2002. IJCNN’02. Proceedings of the 2002 International Joint Conference on, volume 2, pages 1702– 1707. IEEE, 2002.
[PP07]
Animesh Patcha and Jung-Min Park. Network anomaly detection with incomplete audit data. Computer Networks, 51(13):3935–3955, 2007.
[Ric11]
Robert Richardson. CSI computer crime and security survey, 2011.
[Rip01]
Brian D Ripley. The R project in statistical computing. MSOR Connections. The newsletter of the LTSN Maths, Stats & OR Network, 1(1):23–25, 2001.
[RLM98]
Jake Ryan, Meng-Jang Lin, and Risto Miikkulainen. Intrusion detection with neural networks. In Advances in neural information processing systems, pages 943–949. MORGAN KAUFMANN PUBLISHERS, 1998.
[SBD+ 91] Steven R Snapp, James Brentano, Gihan V Dias, Terrance L Goan, L Todd Heberlein, Che-Lin Ho, Karl N Levitt, Biswanath Mukherjee, Stephen E Smaha, Tim Grance, et al. DIDS (distributed intrusion detection system)-motivation, architecture, and an early prototype. In Proceedings of the 14th National Computer Security Conference, pages 167–176. Citeseer, 1991. [SOC+ 09] Benjamin Sangster, T OˆaConnor, Thomas Cook, Robert Fanelli, Erik Dean, William J Adams, Chris Morrell, and Gregory Conti. Toward instrumenting network warfare competitions to generate labeled datasets. In Proc. of the 2nd Workshop on Cyber Security Experimentation and Test (CSETˆa09), 2009. [TSB08]
Ciza Thomas, Vishwas Sharma, and N Balakrishnan. Usefulness of DARPA dataset for intrusion detection system evaluation. In SPIE Defense and Security Symposium, pages 69730G–69730G. International Society for Optics and Photonics, 2008.
[Urb03]
Simon Urbanek. Rserve–A Fast Way to Provide R Functionality to Applications. In PROC. OF THE 3RD INTERNATIONAL WORKSHOP ON DISTRIBUTED STATISTICAL COMPUTING (DSC 2003), ISSN 1609-395X, EDS.: KURT HORNIK, FRIEDRICH LEISCH & ACHIM ZEILEIS, 2003 (HTTP://ROSUDA. ORG/RSERVE. Citeseer, 2003.
[YE12]
Ahmed Youssef and Ahmed Emam. NETWORK INTRUSION DETECTION USING DATA MINING AND NETWORK BEHAVIOUR ANALYSIS. International Journal of Computer Science, 3, 2012.
2212