Sep 18, 2008 - that there exists a sufficient statistic across models. The accuracy of the approximation to the posterior probabilities can be further improved by ...
ABC methods for model choice in Gibbs random fields Application to protein 3D structure prediction by
Aude Grelaud, Christian P. Robert, Jean-Michel Marin, Fran¸cois Rodolphe and Jean-Fran¸cois Taly
Research Report No. 18 September 2008
Statistics for Systems Biology Group Jouy-en-Josas/Paris/Evry, France http://genome.jouy.inra.fr/ssb/
ABC methods for model choice in Gibbs random fields Application to protein 3D structure prediction Aude Grelaud?,†,‡ , Christian P. Robert?,† , Jean-Michel Marin§,† , Fran¸cois Rodolphe‡ and Jean-Fran¸cois Taly‡ ‡
INRA, unit´e MIG, 78350 Jouy en Josas, France
?
CEREMADE, Universit´e Paris Dauphine, 75775 Paris cedex 16, France
†
CREST, INSEE, 92145 Malakoff cedex, France
§
INRIA Saclay, Projet select, Universit´e Paris-Sud, 91400 Orsay, France
Abstract Gibbs random fields are polymorphous statistical models that can be used to analyse different types of dependence, in particular for spatially correlated data. However, when those models are faced with the challenge of selecting a dependence structure from many, the use of standard model choice methods is hampered by the unavailability of the normalising constant in the Gibbs likelihood. In particular, from a Bayesian perspective, the computation of the posterior probabilities of the models under competition requires special likelihood-free simulation techniques like the Approximate Bayesian Computation (ABC) algorithm that is intensively used in population Genetics. We show in this paper how to implement an ABC algorithm geared towards model choice in the general setting of Gibbs random fields, demonstrating in particular that there exists a sufficient statistic across models. The accuracy of the approximation to the posterior probabilities can be further improved by importance sampling on the distribution of the models. The practical aspects of the method are detailed through two applications, the test of an iid Bernoulli model versus a first-order Markov chain, and the choice of a folding structure for a protein of Thermotoga maritima implicated into signal transduction processes.
Keywords: Approximate Bayesian computation, model choice, Markov random fields, Bayes factor, protein folding.
1
SSB - RR No. 18
1
A. Grelaud et al.
Introduction
Gibbs random fields are probabilistic models associated with the likelihood function f (x|θ) =
1 exp{θ T S(x)} , Zθ
(1)
where x is a vector of dimension n taking values over X (possibly a lattice), S(·) is the potential function defining the random field, taking values in Rp , θ ∈ Rp is the associated parameter, and Zθ is the corresponding normalising constant. When considering model selection within this class of Gibbs models, the primary difficulty to address is the unavailability of the normalising constant Zθ . In most realistic settings, the summation Zθ =
X
exp{θ T S(x)}
x∈X
involves too many terms to be manageable and numerical approximations like path sampling [2], pseudo likelihood or those based on an auxiliary variable [7] are not necessarily available. Selecting a model with potential S0 taking values in Rp0 versus a model with potential S1 taking values in Rp1 depends on the Bayes factor corresponding to the priors π0 and π1 on each parameter space Z BFm0 /m1 (x) = Z
�
exp{θ T 0 S0 (x)}/Zθ 0 ,0 π0 (dθ 0 )
exp{θ T 1 S1 (x)}/Zθ 1 ,1 π1 (dθ 1 )
but this is not directly achievable. One faces the same difficulty with the posterior probabilities of the models since they depend on those unknown constants. To properly approximate those posterior quantities, it is thus necessary to use likelihood-free techniques such as ABC [8] and we show in this paper how ABC is naturally tuned for this purpose by providing a direct estimator of the Bayes factor. A special but important case of Gibbs random fields where model choice is particularly crucial is found with Markov random fields (MRF). Those models are special cases of Gibbs random fields used to model the dependency within spatially correlated data, with applications in epidemiology [3] and image analysis [4], among others. In this setting, the potential function S takes values in R and is associated with a neighbourhood structure denoted by i ∼ i0 . It means that the conditionnal density on xi only depends on the xi0 such that i and i0 are neighbours. For instance, the potential function of a Potts model is S(x) =
X i0 ∼i
2
I{xi =xi0 } ,
SSB - RR No. 18
where
P
i0 ∼i
A. Grelaud et al.
indicates that the summation is taken over all the neighbours pairs. In that case, θ is
a scalar. The potential function therefore monitors the number of likewise neighbours over X . For a fixed neighbourhood, the unavailability of Zθ complicates inference on the scale parameter θ, but the difficulty is increased manifold when several neighbourhood structures are under comparison on the basis of an observation from (1). In this paper, we will consider the toy example of an iid sequence [with trivial neighbourhood structure] tested against a Markov chain model [with nearest neighbour structure] as well as a biophysical example aimed at selecting a protein 3D structure.
2
Methods
2.1
ABC
As noted above, when the likelihood is not available in closed form, there exist likelihood-free methods that overcome the difficulty faced by standard simulation techniques via a basic acceptancerejection algorithm. The algorithm on which the ABC method [introduced by [8] and expanded in [1] and [6]] is based can be briefly described as follows: given a dataset x0 associated with the sampling distribution f (·|θ), and under a prior distribution π(θ) on the parameter θ, this method generates a parameter value from the posterior distribution π(θ|x0 ) ∝ π(θ)f (x0 |θ) by simulating a value θ∗ from the prior, θ∗ ∼ π(·), then a value x∗ from the sampling distribution x∗ ∼ f (·|θ∗ ) until x∗ is equal to the observed dataset x0 . The rejection algorithm thus reads as Algorithm 1. Exact rejection algorithm: • Generate θ∗ from the prior π. • Generate x∗ from the model f (·|θ∗ ). • Accept θ∗ if x∗ = x0 . This solution is not approximative in that the output is truly simulated from the posterior distribution π(θ|x0 ). In many settings, including those with continuous observations x0 , it is however impractical or impossible to wait for x∗ = x0 to occur and the approximative solution is to introduce a tolerance in the test, namely to accept θ∗ if simulated data and observed data are close enough, in the sense of a distance ρ(.), given a fixed tolerance level �. The �-tolerance rejection algorithm is then
3
SSB - RR No. 18
A. Grelaud et al.
Algorithm 2. �-tolerance rejection algorithm: • Generate θ∗ from the prior π. • Generate x∗ from the model f (·|θ∗ ). • Accept θ∗ if ρ(x∗ , x0 ) < �. This approach is obviously approximative when � 6= 0 and it amounts to simulating from the prior when � → ∞. The output from the algorithm 2 is thus associated with the distribution π(θ|ρ(x∗ , x0 ) < �). The choice of � is therefore paramount for good performances of the method. If � is too large, the approximation is poor while, if � is sufficiently small, π(θ|ρ(x∗ , x0 ) < �) is a good approximation of π(θ|x0 ) but the acceptance probability may be too low to be practical. It is therefore customary to pick � as an empirical quantile of ρ(x∗ , x0 ) when x∗ is simulated from the marginal distribution, and the choice often is the corresponding 1% quantile (see [1]). The data x0 usually being of a large dimension, another level of approximation is enforced within the ABC algorithm, by replacing the distance ρ(x∗ , x0 ) with a corresponding distance between summary statistics ρ(S(x∗ ), S(x0 )) [1]. It is straightforward to see that, when S(.) is a sufficient statistic, this step has no impact on the approximation but it is rarely the case that a sufficient statistic of low dimension is available when implementing ABC. As it occurs, the setting of model choice among Gibbs random fields allows for such a beneficial structure, as will be seen below. In the general case, the output of the ABC algorithm is therefore a simulation from the distribution π(θ|ρ(S(x∗ ), S(x0 )) < �). The algorithm reads as follows:
Algorithm 3. ABC algorithm: • Generate θ∗ from the prior π. • Generate x∗ from the model f (·|θ∗ ). • Compute the distance ρ(S(x0 ), S(x∗ )). • Accept θ∗ if ρ(S(x0 ), S(x∗ )) < �.
4
SSB - RR No. 18
2.2
A. Grelaud et al.
Model choice via ABC
In a model choice perspective, we face M Gibbs random fields in competition, each one being associated with a potential function Sm (0 ≤ m ≤ M − 1), i.e. with corresponding likelihood � T � fm (x|θm ) = exp θm Sm (x) Zθm ,m , where θm ∈ Θm and Zθm ,m is the unknown normalising constant. Typically, the choice is between P m m 0 I{x =x 0 } . M neighbourhood relations i ∼ i0 (0 ≤ m ≤ M − 1) with Sm (x) = i∼i i i From a Bayesian perspective, the choice between those models is driven by the posterior probabilities of the models. Namely, if we consider an extended parameter that includes the model index −1 M defined on the parameter space Θ = ∪M m=0 {m} × Θm , we can define a prior distribution on the
model index π(M = m) as well as a prior distribution on the parameter conditional on the value m of the model index, πm (θm ), defined on the parameter space Θm . The computational target is thus the model posterior probability Z P(M = m|x) ∝
fm (x|θm )πm (θm ) dθm π(M = m) , Θm
i.e. the marginal of the posterior distribution on (M, θ0 , . . . , θM −1 ) given x. Therefore, if S(.) is a sufficient statistics for the joint parameters (M, θ0 , . . . , θM −1 ), P(M = m|x) = P(M = m|S(x)) . Each model has its own sufficient statistic Sm (·). Then, for each model, the vector of statistics S(·) = (S0 (·), . . . , SM −1 (·)) is obviously sufficient (since it includes the sufficient statistic of each model). Moreover, the structure of the Gibbs random field allows for a specific factorisation of the distribution fm (x|θm ). Indeed, the distribution of x in model m factorises as 1 2 fm (x|θm ) = fm (x|S(x))fm (S(x)|θm ) 1 = f 2 (S(x)|θm ) n(S(x)) m 2 (S(x)|θ ) is the distribution of S(x) within model m [not to be confused with the distriwhere fm m
bution of Sm (x)] and n(S(x)) = ] {˜ x ∈ X : S(˜ x) = S(x)} is the cardinal of the set of elements of X with the same sufficient statistic, which does not depend on m (the support of fm is constant with m). The statistic S(.) is therefore also sufficient for the joint parameters (M, θ0 , . . . , θM −1 ). 5
SSB - RR No. 18
A. Grelaud et al.
That the concatenation of the sufficient statistics of each model is also a sufficient statistic for the joint parameters (M, θ0 , . . . , θM −1 ) is obviously a property that is specific to Gibbs random field models. For Gibbs random fields models, it is then possible to apply the above ABC algorithm in order to produce an approximation with tolerance factor �:
Algorithm 4. ABC algorithm for model choice (ABC-MC): • Generate m∗ from the prior π(M = m). ∗ from the prior π ∗ (·). • Generate θm ∗ m ∗ ). • Generate x∗ from the model fm∗ (·|θm ∗
• Compute the distance ρ(S(x0 ), S(x∗ )). ∗ , m∗ ) if ρ(S(x0 ), S(x∗ )) < �. • Accept (θm ∗
For the same reason as above, this algorithm results in an approximate generation from the joint posterior distribution � π (M, θ0 , . . . , θM −1 )|ρ(S(x0 ), S(x∗ )) < � . When it is possible to achieve � = 0, the algorithm is exact since S is a sufficient statistic. We have thus derived a likelihood-free method to handle model choice. i∗ , mi∗ ) (1 ≤ i ≤ N ) is generated from this algorithm, a Once a sample of N values of (θm i∗
standard Monte Carlo approximation of the posterior probabilities is provided by the empirical frequencies of visits to the model, namely � b P(M = m|x0 ) = ]{mi∗ = m} N , where ]{mi∗ = m} denotes the number of simulated mi∗ ’s equal to m. Correlatively, the Bayes factor associated with the evidence provided by the data x0 in favour of model m0 relative to model m1 is defined by P(M = m0 |x0 ) π(M = m1 ) BFm0 /m1 (x0 ) = P(M = m1 |x0 ) π(M = m0 ) R fm0 (x0 |θ0 )π0 (θ0 )π(M = m0 )dθ0 π(M = m1 ) =R . fm1 (x0 |θ1 )π1 (θ1 )π(M = m1 )dθ1 π(M = m0 )
6
SSB - RR No. 18
A. Grelaud et al.
The previous estimates of the posterior probabilities can then be plugged-in to approximate the above Bayes factor by BF m0 /m1 (x0 ) = =
ˆ P(M = m0 |x0 ) π(M = m1 ) × ˆ P(M = m1 |x0 ) π(M = m0 ) ]{mi∗ = m0 } π(M = m1 ) × , ]{mi∗ = m1 } π(M = m0 )
but this estimate is only defined when ]{mi∗ = m1 } = 6 0. To bypass this difficulty, the substitute i∗ d m /m (x0 ) = 1 + ]{m = m0 } × π(M = m1 ) BF 0 1 1 + ]{mi∗ = m1 } π(M = m0 )
is particularly interesting because we can evaluate its bias. (Note that there does not exist an unbiased estimator of BFm0 /m1 (x0 ) based on the mi∗ ’s.) Indeed, assuming without loss of generality that π(M = m1 ) = π(M = m0 ), if we set N0 = ]{mi∗ = m0 }, N1 = ]{mi∗ = m1 } and conditionally on N = N0 + N1 , N1 is a binomial B(N, p) rv with probability p = (1 + BFm0 /m1 (x0 ))−1 . It is then straightforward to establish that (see Appendix) � � N +2 N0 + 1 1 − (1 − p)N +1 . N = BFm0 /m1 (x0 ) + E N1 + 1 p(N + 1) p(N + 1) d m /m (x0 ) is thus {1 − (N + 2)(1 − p)N +1 }/(N + 1)p, which goes to The bias in the estimator BF 0 1 zero as N goes to infinity.
2.3
Two step ABC
d m /m (x0 ) is rather unstable (i.e. suffers from a large variance) when The above estimator BF 0 1 BFm0 /m1 (x0 ) is very large since, when P(M = m1 |x0 ) is very small, ]{mi∗ = m1 } is most often equal to zero. This difficulty can be bypassed by a reweighting scheme. If the choice of m∗ in the ABC algorithm is driven by the probability distribution P(M = m1 ) = % = 1 − P(M = m0 ) rather than by π(M = m1 ) = 1 − π(M = m0 ), the value of ]{mi∗ = m1 } can be increased and later corrected by considering instead i∗ g m /m (x0 ) = 1 + ]{m = m0 } × % . BF 0 1 1 + ]{mi∗ = m1 } 1 − %
d m /m (x0 ), the Therefore, if a first run of the ABC algorithm exhibits a very large value of BF 0 1 0 g estimate BF m /m (x ) produced by a second run with 0
1
� %∝1
ˆ P(M = m1 |x0 )
7
SSB - RR No. 18
A. Grelaud et al.
d m /m (x0 ). In the most extreme cases when no mi∗ is ever will be more stable than the original BF 0 1 equal to m1 , this corrective second is unlikely to bring much stabilisation, though. Note, however, that, from a practical point of view, obtaining a poor evaluation of BFm0 /m1 (x0 ) when the Bayes factor is very small (or very large) has limited consequences since the poor approximation also leads to the same conclusion about the choice of model m0 .
3
Results
3.1
Toy example
Our first example compares an iid Bernoulli model with a two-state first-order Markov chain. Both models are special cases of MRF and, furthermore, the normalising constant Zθm ,m can be computed in closed form, as well as the posterior probabilities of both models. We thus consider a sequence x = (x1 , .., xn ) of n binary variables (n = 100). Under model M = 0, the MRF representation of the Bernoulli distribution B(1/{1 + exp(−θ0 )}) is f0 (x|θ0 ) = exp θ0
n X
! I{xi =1}
� {1 + exp(θ0 )}n ,
i=1
associated with the sufficient statistic S0 (x) = (1 +
eθ0 )n .
Pn
i=1 I{xi =1}
and the normalising constant Zθ0 ,0 =
Under a uniform prior θ0 ∼ U(−5, 5), the bound ±5 being the phase transition value
for the Gibbs random field, the posterior probability of this model is available since the marginal when S0 (x) = s0 (s0 6= 0) is given by � s0 −1 � i 1 X s0 − 1 (−1)s0 −1−k h (1 + e5 )k−n+1 − (1 + e−5 )k−n+1 , 10 k n−1−k k=0
by a straightforward rational fraction integration. Model M = 1 is chosen as a Markov chain (hence a particular MRF in dimension one with i and i0 being neighbours if |i − i0 | = 1) with the special feature that the probability to remain within the same state is constant over both states, namely � P(xi+1 = xi |xi ) = exp(θ1 ) {1 + exp(θ1 )} . We assume a uniform distribution on x1 and the likelihood function for this model is thus ! n X � 1 f1 (x|θ1 ) = exp θ1 I{xi =xi−1 } {1 + exp(θ1 )}n−1 , 2 i=2
8
0.0
0.4
^ P(M=0|x)
0.4 0.0
^ P(M=0|x)
0.8
A. Grelaud et al.
0.8
SSB - RR No. 18
0.0
0.4
0.8
0.0
P(M=0|x)
0.4
0.8
P(M=0|x)
b Figure 1: (left) Comparison of the true P(M = 0|x0 ) with P(M = 0|x0 ) over 2, 000 simulated sequences and 4.106 proposals from the prior. The red line is the diagonal. (right) Same comparison
!10 !5
0
^ BF01
0 !5
^ BF01
5
5
10
when using a tolerance � corresponding to the 1% quantile on the distances.
!40
!20
0 10
!40
BF01
!20
0 10
BF01
d m /m (x0 ) (in logarithmic scales) Figure 2: (left) Comparison of the true BF m0 /m1 (x0 ) with BF 0 1 over 2, 000 simulated sequences and 4.106 proposals from the prior. The red line is the diagonal. (right) Same comparison when using a tolerance corresponding to the 1% quantile on the distances.
9
SSB - RR No. 18
with S1 (x) =
Pn
i=2 I{xi =xi−1 }
A. Grelaud et al.
being the sufficient statistic in that case. Under a uniform prior
θ1 ∼ U(0, 6), where the bound 6 is the phase transition value, the posterior probability of this model is once again available, the likelihood being of the same form as when M = 0. We are therefore in a position to evaluate the ABC approximations of the model posterior probabilities and of the Bayes factor against the exact values. For this purpose, we simulated 1000 datasets x0 under each model, using parameters simulated from the priors and computed the exact posterior probabilities and the Bayes factors in both cases. Here, the vector of summary statistics is composed of the sufficient statistic of each model, S(.) = (S0 (.), S1 (.)), and we use an euclidian distance. For each of those datasets x0 , the ABC-MC algorithm was run for 4.106 loops, meaning that ∗ , x∗ ) were simulated and a random number of those were accepted when S(x∗ ) = 4.106 sets (m∗ , θm ∗
S(x0 ). (In the worst case scenarios, the number of acceptances was 12!) As shown on the left graph of Figure 1, the fit of posterior probabilities is very good for all values of P(M = 0|x0 ). When we introduce a tolerance � equal to the 1% quantile of the distance, the results are very similar when P(M = 0|x0 ) is close to 0, 1 or 0.5, and we observe a slight difference between these values. We also evaluated the approximation of the Bayes factor (and of the subsequent model choice) against the exact Bayes factor. As clearly pictured on the left graph of Figure 2, the fit is very good in the exact case (� = 0), the poorest fits occurring in the limiting cases when the Bayes factor is either very large or very small and thus when the model choice is not an issue, as noted above. In the central zone when log BF m0 /m1 (x0 ) is close to 0, the difference is indeed quite small, the few diverging cases being due to occurrences of very small acceptance rates. Once more, using a tolerance � equal to the 1% quantile does not bring much difference in the output, the approximative Bayes factor being slightly less discriminative in that case (since the slope of the cloud is less than the even slope of the diagonal). Given that using the tolerance version allows for more simulations to be used in the Bayes factor approximation, we thus recommend using this approach.
3.2
Application to protein 3D structure prediction
In Biophysics, the knowledge of the tridimensional structure, called folding, of a protein provides important information about the protein, including its function. There exist two kinds of methods that are used to find the 3D structure of a protein. Experimental methods like spectroscopy provide accurate descriptions of structures, but these methods are time consuming, expensive, and sometimes unsuccessful. Alternatively, computational methods
10
SSB - RR No. 18
A. Grelaud et al.
have become more and more successful in predicting 3D structures. These latter methods mostly rely on homology (two sequences are said to be homolog if they share a common ancestor). If the protein under study, hereafter called the query protein, displays a sufficiently high sequence similarity with a protein of known structure, both are considered as homologous with similar structures. Then, a prediction based on the structure of its homolog can be built. As structures are more conserved over time than sequences, methods based on threading have been developed when sequence similarity is too low to assess homology with sufficient certainty. Threading consists in trying to fold the query protein onto all known structures; a fitting criterion is computed for each proposal and the structures displaying sufficiently high criterion values, if any, are chosen. The result is a list of alignments of the query sequence on different structures. It may happen that some of those criterion values are close enough to make a decision difficult. From a statistical perspective, each structure can be represented by a graph such that a node of this graph is one amino-acid of the protein and an edge between two nodes of the graph indicates that both amino-acids are in close contact in the folded protein. This graph can thus be associated with a Markov random field (1) if labels are allocated to each node. When several structures are proposed by a threading method, algorithm 4 is then available to select the most likely structure. In the example we discuss in this section, labels are associated with the hydrophobic properties of the amino-acids, i.e. they are classified as being either hydrophobic or hydrophilic, based on Table 1. Since, for a globular protein in its native folding, hydrophobic amino-acids are mostly buried inside the structure, and hydrophilic ones are exposed to water, using hydrophobia as the clustering factor does make sense. Hydrophilic
Hydrophobic
KERDQNPHSTG
AYMWFVLIC
Table 1: Classification of amino acids into hydrophilic and hydrophobic groups. The dataset is built around a globular protein sequence of known structure (this one will be called the native structure) 1tqgA corresponding to a protein of Thermotoga maritima involved into signal transduction processes. We used FROST [5], a software dedicated to threading, and MODELLER [9] to build candidate structures. (All proteins we use are available in the Protein Data Bank at http://www.rcsb.org/pdb/home/home.do). These candidates thus correspond to the same sequence (the query sequence) folded on different structures. We used two criteria to qualify the similarity between the candidates and the query : the percentage of identity between query and candidate sequences (computed by FROST) and the similarity of the topologies of candidate 11
SSB - RR No. 18
A. Grelaud et al.
structures with the native structure (assessed with the TM-score, 11). Among those, we selected candidates covering the whole spectrum of predictions that can be generated by protein threading, from good to very poor as [10] and described in Table 2. % seq . Id.
TM-score
FROST score
1i5nA (ST1)
32
0.86
75.3
1ls1A1 (ST2)
5
0.42
8.9
1jr8A (ST3)
4
0.24
8.9
1s7oA (DT)
10
0.08
7.8
Table 2: Summary of the characteristics of our dataset. % seq . Id.: percentage of identity with the query sequence. TM-score.: similarity between a predicted structure and the native structure. A score larger than 0.4 implies a structural relationship between 2 structures and a score less than 0.17 means that the prediction is nothing more than a random selection from the PDB library. FROST score: quality of the alignment of the query onto the candidate structure. A score larger than 9 means that the alignment is good, while a score less than 7 means the opposite. For values between 7 and 9, this score cannot be used to reach a decision.
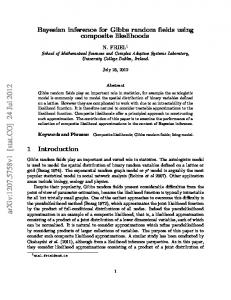
Figure 3: Superposition of the native structure (grey) with the ST1 structure (red.), the ST2 structure (orange), the ST3 structure (green), and the DT structure (blue). We took three cases for which the query sequence has been aligned with a structure similar to the native structure. For ST1 and ST2, alignment is good or fair and the difference relies on the percentage of identity between the sequences. The ST1 sequence is homolog with the query sequence, (% seq. Id. > 20%), while we cannot be sure for ST2. ST3 is certainly not an homolog 12
SSB - RR No. 18
A. Grelaud et al.
NS/ST1
NS/ST2
NS/ST3
NS/DT
d BF
1.34
1.22
2.42
2.76
b P(M = NS|x0 )
0.573
0.551
0.708
0.734
Table 3: Estimates of the Bayes factors between model NS and models ST1, ST2, ST3, and DT, and corresponding posterior probabilities of model NS based on an ABC-MC algorithm using 1.2 106 simulations and a tolerance � equal to the 1% quantile of the distances. of the query and the alignment is much poorer. For DT, the query sequence has been aligned with a structure that only share few structure elements with the native structure. It must be noted that alignments used to build ST2, ST3, and DT were scored in the FROST uncertainty zone, that is to say we cannot choose between these predictions based only on the results given by FROST as shown in Table 2. Differences between the native structure and the predicted structures are illustrated on Figure 3. Using ABC-MC, we then estimate the Bayes factors between the model NS corresponding to the true structure and the models ST1, ST2, ST3, and DT, corresponding to the predicted structures. Estimated values and posterior probabilities of model NS are given for each case in Table 3. All Bayes factors are estimated to be larger than 1 so this indicates that data are always in favour of the native structure, when compared with one of the four alternatives. Moreover, the value is larger when models are more different. Note that the posterior probability of model NS is larger when the alternative model is ST2 than when the alternative model is ST1.
Acknowledgments The authors’ research is partly supported by the Agence Nationale de la Recherche (ANR, 212, rue de Bercy 75012 Paris) through the 2005 project ANR-05-BLAN-0196-01 Misgepop and by a grant from Region Ile-de-France.
References [1] Beaumont, M., W. Zhang, and D. Balding. 2002. Approximate Bayesian Computation in Population Genetics. Genetics 162: 2025–2035. [2] Gelman, A. and X. Meng. 1998. Simulating normalizing constants: From importance sampling to bridge sampling to path sampling. Statist. Science 13: 163–185. 13
SSB - RR No. 18
A. Grelaud et al.
[3] Green, P. and S. Richardson. 2002. Hidden Markov models and disease mapping. J. American Statist. Assoc. 92: 1055–1070. [4] Ibanez, M. and A. Simo. 2003. Parametric estimation in Markov random fields image modeling with imperfect observations. A comparative study. Pattern Recognition Letters 24: 2377–2389. [5] Marin, A., J. Pothier, K. Zimmermann, and J. Gibrat. 2002. FROST: a filterbased fold recognition method. Proteins 49: 493–509. [6] Marjoram, P., J. Molitor, V. Plagnol, and S. Tavar´e. 2003. Markov chain Monte Carlo without likelihoods. Proc. National Acad. Sci. USA 100(26): 15324–15328. [7] Moeller, J., A. Pettitt, R. Reeves, and K. Berthelsen. 2006. An efficient MCMC algorithm method for distributions with intractable normalising constant. Biometrika 93: 451–458. [8] Pritchard, J. K., M. T. Seielstad, A. Perez-Lezaun, and M. W. Feldman. 1999. Population growth of human Y chromosomes: a study of Y chromosome microsatellites. Mol. Biol. Evol. 16: 1791–1798. [9] Sali, A. and T. Blundell. 1993. Comparative protein modelling by satisfaction of spatial restraints. J. Mol. Biol. 234: 779–815. [10] Taly, J., A. Marin, and J. Gibrat. 2008. Can molecular dynamics simulations help in discriminating correct from erroneous protein 3D models? BMC Bioinformatics 9: 6. [11] Zhang, Y. and J. Skolnick. 2004. Scoring function for automated assessment of protein structure template quality. Proteins 57: 702–710.
14
SSB - RR No. 18
4
A. Grelaud et al.
Appendix: Binomial expectations
First, given X ∼ B(N, p), we have : � � � � � � N −X +1 N +2 X +1 E = E −E X +1 X +1 X +1 � � 1 = (N + 2)E −1 X +1 and � E
1 1+X
� =
=
=
= = = =
N X
� � N k 1 p (1 − p)N −k 1+k k k=0 � �� �k+1 N p (1 − p)N +1 X 1 N p k+1 k 1−p k=0 p � � Z N 1−p (1 − p)N +1 X N xk dx k p 0 k=0 p � � Z N (1 − p)N +1 1−p X N k x dx p k 0 k=0 Z p (1 − p)N +1 1−p (1 + x)N dx p 0 � � p (1 − p)N +1 (1 + x)N +1 1−p p N +1 0 � 1 1 N +1 1 − (1 − p) . N +1p
Then � � N +2 E X +1
= −−−−−→ N →∞
N +2 1� 1 − (1 − p)N +1 N +1 p 1 p
15