SOUTHEAST EUROPE JOURNAL OF SOFT COMPUTING Available online at www.scjournal.com.ba
Application of Ensemble Machines of Neural Networks to Chromosome Classification
M. Can a, S. Gagula Palalić b a
Faculty of Engineering, International University of Sarajevo, Hrasnička Cesta 15, 71200 Sarajevo Bosnia and Herzegovina,
[email protected] b Faculty of Engineering, International University of Sarajevo, Hrasnička Cesta 15, 71200 Sarajevo Bosnia and Herzegovina, sadina@ ius.edu.ba
Abstract— This work presents approaches to the automatic classification of metaphase chromosomes using several perceptron neural network techniques on neural networks function as committee machines. To represent the banding patterns, only chromosome gray level profiles are exploited. The other inputs to the ensemble machines of the network are the chromosome size and centromeric index. It is shown that, without much effort, the classification performances of the four networks are found to be similar to the ones of a well-developed parametric classifier. Four parallel networks trained for the four different aspects of the data set, the gray level profile vector, Fourier coefficients of gray level profiles, 3D data of chromosome length – centromeric index – total gray levels, and 4D data obtained by the addition of average gray levels. Then the classification results of differently trained neural networks (i.e., experts), are combined by the use of a genuine ensemble-averaging to produce an overall output by the combiner. We discuss the flexibility of the classifier developed, its potential for development, and how it may be improved to suit the current needs in karyotyping. Keywords— Chromosome classification, context free classification, ensemble machines, perceptron.
31
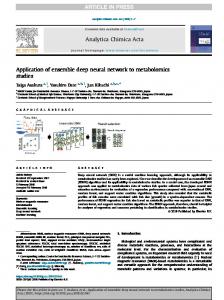
INTRODUCTION For detecting genetic abnormality, investigation of chromosomes in human cell nuclei is an essential procedure in many fields of research, damage due to environmental factors, or diagnosis of cancer are a few of them (Errington 1993). In particular, for clinical purposes, a karyotype cells is required in which chromosomes must be assigned to one of 24 classes (Paris Standardization Conference 1971). Although this task of classification is highly skilled in recent years, automated karyotyping systems are developed, a number of such systems are available commercially and in use in clinical laboratories (Lundsteen, and Martin 1989), it still contains substantial expert human work of tedious and repetitive nature. The main part in automated systems is the classification of chromosomes based on features that can be measured from the digitized cell image, such as that in Figure 1.
Chromosome size and overall density vary significantly between cells, but these differences can be compensated in a straightforward manner by certain normalizations. The banding patterns also vary considerably in their details in chromosomes of the same class from different cells. To accommodate these differences, in this article averaging, and, Fourier analysis of gray level profiles are found to be useful along the implementation of ensemble machine neural networks. Neural network classifiers have been shown to be highly adaptable and capable of generalizing to decide about classes of chromosomes based on training data (Baum 1998; Haykin 1994). They have been applied in classification tasks where classical pattern recognition methods have not been applied or have been unsuccessful (Can, et.al. 2011a, Can, et.al. 2011b, Savatić et.al. 2011, Selman et. al. 2011, Jamak et.al. 2012). In applying an ensemble machines network to chromosome classification, we have the opportunity to develop a novel and potentially superior classifier of committee machines. We also compared the performance of this neural network with that of a more conventional classifiers in this well-studied domain. ENSAMBLE MACHINES AS A NEURAL NETWORK CLASSIFIER
FIG. 1. Digital image of a metaphase cell showing G-banded chromosomes
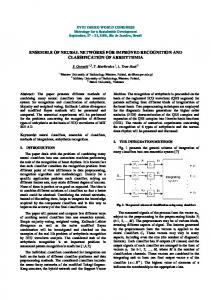
In approaches to automatic chromosome classification in addition to using the important features of chromosome size and centromere position, some representation of the chromosome banding pattern, often in the form of a density profile projected onto the chromosome's centre line are used as in Figure 2.
As the base topology of artificial neural network committee machines ARE used in this work. In committee machines approach, a complex computational task is solved by dividing it into a number of computationally simple tasks and then combining the solutions to those tasks. In supervised learning, computational simplicity is achieved by distributing the learning task among a number of experts, which in turn divides the input space into a set of subspaces. The combination of experts is said to constitute a committee machine. Basically, it fuses knowledge acquired by experts to arrive at an overall decision that is supposedly superior to that attainable by anyone of them acting alone. The network structure considered therein consisted of a layer of elementary perceptrons followed by a vote-taking perceptron in the second layer. Committee machines are universal approximators. They may be classified into two major categories: 1. Static structures. In this class of committee machines, the responses of several predictors (experts) are combined by means of a mechanism that does not involve the input signal, hence the designation "static." This category includes the ensemble averaging, where the outputs of different predictors are linearly combined to produce an overall output. 2. Dynamic structures. In this second class of committee machines, the input signal is directly involved in actuating the mechanism that integrates the outputs of the individual experts into an overall output, hence the designation "dynamic."
0.6 0.5 0.4 0.3 0.2
Ensemble Averaging
0.1
0
20
40
60
80
100
120
140
FIG. 2. Digitized chromosome image and density profile projected onto the chromosome's centre line
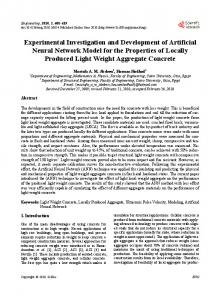
Figure 3 shows a number of differently trained neural networks (i.e., experts), which share a common input and whose individual outputs are somehow combined to produce
32
an overall output. In this research the outputs of the experts are scalar-valued. Such a technique is referred to as an ensemble averaging method. The motivation for its use is two-fold: • If the combination of experts in Fig. 3 were replaced by a single neural network, we would have a network with a correspondingly large number of adjustable parameters. The training time for such a large network is likely to be longer than for the case of a set of experts trained in parallel. • The risk of overfitting the data increases when the number of adjustable parameters is large compared to cardinality (i.e., size of the set) of the training data. In any event, in using a committee machine as depicted in Fig. 3, the expectation is that the differently trained experts converge to different local minima on the error surface, and overall performance is improved by combining the outputs in some way.
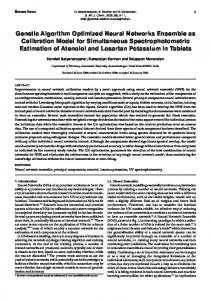
Fig. 4. 108 dimensional input vector with components of 106 gray levels, chromosomes length, and centromere position
Network Training and Testing 2200 data in the set is divided into two equal parts. Half the data was used for training the network. The other half was later used as unseen test data. The roles of the training and test data partitions were exchanged in subsequent experiments. Classification values for both experiments were then averaged to produce a mean classification error rate for training and test data for all of the data set. The following four expert training phases were conducted to deal with the four different aspects related to the chromosomes. Expert 1: Training by the gray level profiles of chromosomes
Fig. 3. Block diagram of a committee machine based on ensemble-averaging.
In our sample, the 2200 input vectors x are 108 dimensional with components chromosomes length, centromere position, and 106 gray levels. This data is delivered to each of the four committee machines as shown in the signal flow graph in Figure 3.
The training data set for Expert 1 consists of 1100 data gray level profile with 106 components. Shorter chromosomes are completed to this size by padding zeroes to the tail. To train the neural network, we averaged 50 data vectors in each of 22 chromosome types. To classify the test data chromosomes, the Euclidean distance to these 22 mean vectors of 22 chromosomes types are used. In Figure 5, the mean of the gray level data for type 5 chromosomes are given as an example. 5
4
CLASSIFICATION OF CHROMOSOME DATA For our classification experiments we have used the Copenhagen database of annotated measurements from Gbanded chromosomes that have been used in previous classification studies (Granlund 1973, 1976; Granum 1980, 1982; Goren 1989). In data set, the data for an individual chromosome consists of up to 106 grey level profile samples taken along the medial axis of the chromosome (see Fig. 2). This is supplemented with values for each chromosome's length and centromere position. It is seen that some profiles were sampled backwards, due in part to incorrect centromere location and in part to variation in the centromere position of meta-centric chromosomes. Manual correction of orientations was not applied.
3
2
1
20
40
60
80
100
Fig. 5. The mean of the gray level data for type 5 chromosomes
The Euclidean squared distances of a test chromosome to the means of the gray level training data chromosomes are computed. The chromosome from which this test data extracted is classified as of type to which the distance is smallest. In Fig. 6, the test chromosome is classified as a type 5 chromosome, since its distance to the mean training vector of type 5 chromosomes is 300, the smallest.
33
600
4
500
3
400 2
300 1
200
0
5
10
15
5
10
15
20
20
Fig. 6. The Euclidean squared distance of a test chromosome to the mean of the gray level training data chromosomes. The distance to type 5 chromosomes’ mean is 300, the smallest. Therefore the chromosome from which this test data is extracted, is classified as of type 5.
Correct classification rates of this expert are 76.45% in training, and 73.36% in testing. The success of this method may be improved. Expert 2: Fourier transform of the averaged training set The training data set for Expert 2 consists of 1100 data of gray level profiles with 106 components. Shorter chromosomes are padded to this size by adding zeroes. To train the neural network, we averaged 50 data vectors in each of 22 chromosome types. And then computed the 106 Fourier coefficients for each of the 22 average vectors. To classify the test data chromosomes, the Euclidean distance to these 22 Fourier coefficients vectors of 22 chromosomes types are used. In Figure 7, the Fourier coefficients of the gray level data for type 5 chromosomes are given as an example.
Fig. 8. The Euclidean squared distance of the Fourier coefficients of a test chromosome to the mean of the Fourier coefficients of the gray level training data chromosomes. The distance to the Fourier coefficients of the type 5 chromosomes Fourier coefficients is 0.2, the smallest. Therefore the chromosome, from which this test data is extracted, is classified as of type 5.
Correct classification rates of this expert are 73.68% in training, and 70.91% in testing. The success of this method is also needs to be improved. Expert 3: Neural Fuzzy Model for Chromosome Lengths The training data set for Expert 3 consists of frequency distribution matrix of chromosome lengths in each training class. There are 22 bins for each chromosome types. Then the mean and variance of each row is calculated, and each chromosome types are represented by a Gaussian fuzzy membership function. 1.0
0.8 1.0
0.6
0.5
20
40
60
80
100
-0.5
0.4
-1.0 -1.5
0.2
-2.0 -2.5
0
20
40
60
80
100
120
Fig. 9. 22 Gaussian fuzzy membership functions representing 22 types Fig. 7. The Fourier coefficients of the mean of the gray level data of type 5 chromosomes
Then the Euclidean squared distances of the Fourier coefficients of a test chromosome to the Fourier coefficients of the means of the gray level training data chromosomes are computed. The chromosome from which this test data extracted is classified as of type to which the distance is smallest. In Fig. 8, the test chromosome is classified as a type 5 chromosome, since its distance to the Fourier coefficients of the mean training vector of type 5 chromosomes is 0.2, the smallest.
To classify a test data chromosome, the length of the test chromosome substituted into those 22 fuzzy membership functions. The type of test chromosome is the number of the membership function which gives the highest membership value to this chromosome. Correct classification rates of this expert are 35.82% in testing. The success of this method can be improved. Expert 4: Neural Fuzzy Model for Chromosome Centromere Positions The training data set for Expert 4 consists of frequency distribution matrix of chromosome centromeric positions in
34
each training class. There are 16 bins for each chromosome types. Then the mean and variance of each row is calculated as done before the chromosome lengths, and each chromosome types are represented by a Gaussian fuzzy membership function.
Granlund GH (1976) Identification of human chromosomes using integrated density profiles. IEEE Trans Biomed Eng BME 23: pp 183- 192. Granlund GH (1973) The use of distribution functions to describe integrated density profiles of human chromosomes. J Theor Bioi 40: pp 573-589. Granum E (1980) Pattern recognition aspects of chromosome analysis: Computerized and visual interpretation of banded human chromosomes. PhD thesis, Technical University of Denmark.
1.0
0.8
Granum E (1982) Application of statistical and syntactical methods of analysis to classification of chromosome data. In: Pattern Recognition Theory and Application, Kittler J, Fu KS, Pau LF (eds). NATO ASI (Oxford), Reidel, Dordreht: pp 373-398.
0.6
0.4
Groen FCA (1989) Ten Kate TK, Smeulders AWM, Young IT: Human chromosome classification based on local band descriptors. Pattern Recognition Letters 9: pp 211-222.
0.2
Haykin S (1994) Neural Networks: A Comprehensive Foundation. Macmillan, New York. 0
10
20
30
40
50
60
Fig. 10. 22 Gaussian fuzzy membership functions representing 22 types
To classify a test data chromosome, the length of the test chromosome substituted into those 22 fuzzy membership functions. The type of the test chromosome is the number of the membership function which gives the highest membership value to this chromosome. Correct classification rates of this expert are 31.64% in testing. The method is promising but success of this method must be improved. COMBINATION OF THE INDIVIDUAL RESULTS At that stage we collect the votes of the experts, and decide about the identities of the test chromosomes, each of which are experts about a certain aspect of the chromosome set. Since the last two experts could not contribute much, the overall correct classification performance of our classifier could not go far beyond of the success level of the first expert which is 73.36% in testing.
Jamak A., A. Savatić, and M. Can (2012) Principal Component Analysis For Authorship Attribution, Central Europe Journal of Operations Research, (accepted for publication). Paris Conference (1971) Standardization in Human Cytogenetics. Original Article series, 8:7. National Foundation, New York, 1972. Savatić, A., A. Jamak, and M.Can (2011) Detecting the Authors of Texts by Boosting Neural Network Committee Machines, Proceedings of the 2nd International Scientific and professional Conference of Graphic Technology and Design, 9-11 June 2011, Kselajak, BiH: pp 223-232. Selman S., K. Turan, and A. O. Kuşakçı (2011) Distinction of the Authors of Texts Using Multilayered Feedforward Neural Networks, 9th International Conference on Knowledge, Economy & Management Proceedings: pp 1419-1429.
RESULTS It is seen that the last two structures we have chosen for classification do not help much, the neural fuzzy techniques for chromosome classification is rather new and needs to be elaborated. REFERENCES Baum E.B (1988) On the capabilities of multilayer perceptrons. Journal Complexity 4: pp 193-215. Can M., A. Jamak, and A. Savatić (2011) Teaching Neural Networks to Detect the Authors of Texts Using Lexical Descriptors, 9th International Conference on Knowledge, Economy & Management Proceedings, ISBN: pp 3607-3624. Can M., K.K. Hadžiabdić, N. M. Demir (2011) Teaching Neural Networks to Detect the Authors of Texts, Using Lexical Descriptors, 9th International Conference on Knowledge, Economy & Management Proceedings, pp 1393-1402, 2011.
35