parametric maximum likelihood estimator, Optimal ... In this paper, we propose a calibration estimator ..... significance of the Monte Carlo bias of the variance.
ASA Section on Survey Research Methods
Calibration estimation using empirical likelihood in survey sampling Jae Kwang Kim Abstract: Calibration estimation, which can be roughly described as a method of adjusting the original design weights to incorporate the known population totals of the auxiliary variables, has become very popular in sample surveys. The calibration weights are chosen to minimize a given distance measure while satisfying a set of constraints related with the auxiliary variable information. Under simple random sampling, Chen and Qin (1993) suggested that the calibration estimator maximizing the constrained empirical likelihood can make efficient use of the auxiliary variables. We extend the result to unequal probability sampling and propose an algorithm to implement the proposed procedure. Asymptotic properties of the proposed calibration estimator are discussed. Results from a limited simulation study are presented. Key Words: Generalized regression estimator, Nonparametric maximum likelihood estimator, Optimal regression estimator, Weighting procedure.
1.
Introduction
In the samples selected from a finite population, auxiliary variables with known population totals are often observed. The known population totals usually come from external sources such as administrative data or census. Calibration estimation, which can be roughly described as a method of adjusting the original design weights to incorporate the known population totals of the auxiliary variables, has become very popular in sample surveys. Generally speaking, the calibration procedure chooses the adjusted weights that minimize a distance between the original weights and the adjusted weights, while satisfying a set of constraints related with the auxiliary variable information. Fuller (2002) provides a comprehensive overview of the calibration procedure in sample surveys. In a purely mathematical point of view, the calibration estimation problem is a standard optimization problem with constraints and, given the same constraints, the choice of the objective function Department of Applied Statistics, Yonsei University, Seoul, 120-749, Korea.
3195
determines the properties of the resulting estimator. The classical regression estimator described in Cochran (1977) uses a Euclidian distance function. Deville and S¨arndal (1992) gave conditions for the distance functions to produce the calibration estimators that are asymptotically equivalent to the regression estimator. In addition to the above interpretation of minimizing a distance function, the calibration estimator can also be viewed as a maximum likelihood estimator in some cases. Anderson (1957) derived the regression estimator as a solution to the maximum likelihood estimation under the bivariate normal distribution assumption. Hartley and Rao (1968) used a multinomial distribution for distinct sample values and proposed a scale-load estimator that can be obtained through a constrained maximum likelihood estimation. The empirical likelihood, termed by Owen (1988), is essentially the likelihood of the multinomial distribution used in Hartley and Rao (1968), where the parameters are the point masses assigned to the distinct sample values. Under simple random sampling, Chen and Qin (1993) proposed a calibration estimator that maximizes the empirical likelihood with constraints. Chen and Sitter (1999) extended the method to unequal probability sampling designs but, as discussed in Section 2, the Chen-Sitter estimator lacks the maximum likelihood interpretation. One advantage of having a maximum likelihood interpretation is that the resulting estimator will be asymptotically optimal. In this paper, we propose a calibration estimator that preserves the maximum likelihood interpretation under unequal probability sampling. The objective function we consider is different from that of Chen and Sitter (1999) and thus has different asymptotic properties. The paper is organized as follows. In Section 2, the basic setup is introduced and the proposed method is described. In Section 3, asymptotic properties of the proposed estimator are discussed. Variance estimation is also discussed in Section 4. In section 5, results from a simulation study are presented.
ASA Section on Survey Research Methods
2.
Empirical method
likelihood
calibration
subject to n X
We begin by introducing the notion of empirical likelihood in a simple setup. Let y1 , y2 , · · · , yn be the outcomes of the independently and identically distributed random variables from a continuous distribution function F0 ∈ F. We consider a class F1 ⊂ F of distribution functions that have support on the convex hull of {y1 , y2 , · · · , yn }. Thus, the elements in F1 can be written as Fw (x) =
n X
wi I (yi ≤ x)
(1)
i=1
Pn with i=1 wi = 1 and wi ≥ 0, where I (yi ≤ x) takes the value one if yi ≤ x and takes the value zero otherwise. The parameter wi is the amount of point mass that unit yi represents in the population. That is, wi = F0 (yi ) − F0 (yi −). Note that Fw (y) is a distribution function, not an estimator, indexed by the set of parameters w1 , w2 , · · · , wn . For any parameter of the form θ = θ (F ), the estimator Fˆ of F0 can ³ ´ ˆ ˆ be used to estimate θ by θ = θ F . For a parameter θ linear in y in the population, the estimator θˆ using the class of distributions (1) leads to a linear estimator that is linear in y in the sample. Linear estimation is very popular in sample surveys because it provides internal consistency between estimators for several items. The empirical distribution function, defined for wi = n−1 in (1), given no ties, is the nonparametric maximum likelihood estimator (NPMLE) of F0 , since it maximizes the following likelihood function, L (w) =
n Y
wi
(2)
i=1
Pn over all wi ’s satisfying i=1 wi = 1 and wi ≥ 0. Note that if the wi are known functions of a fixed number of unknown constants then (2) is the usual parametric likelihood function. For any parameter of the form θ = θ (F ), the NPMLE Fˆ of F0³can ´ be used to compute the NPMLE of θ by θˆ = θ Fˆ . If we observe the auxiliary variable xi in the sample and the population mean of xi is known, denoted by µx , the additional information of µx can be used to construct a constrained NPMLE of F0 . Chen and Qin (1993) proposed computing the constrained NPMLE of F0 by solving maximize
n X
log (wi )
(3)
i=1
wi xi = µx and
i=1
wi = 1.
(4)
i=1
The constrained NPMLE for the population total of y is n X Yˆcm = wi∗ yi , i=1
wi∗
where is the solution to the optimization problem in (3) and (4). Also, the constrained NPMLE for the p-th quantile of the distribution of y is n o ˆ cm,y (p) = inf x; Fˆcm,y (x) ≥ p Q where Fˆcm,y (x) =
n X
wi∗ I (yi ≤ x) .
i=1
We now consider an extension of the constrained NPMLE to samples selected from a finite population with unequal selection probabilities. Assume that unit i is selected with known probability πi . Recall that wi in (1) is a parameter value, so the distribution function (1) indexed by w does not depend on the sampling design. However, under unequal probability sampling, the empirical likelihood will be different from (2) because the amount that the i-th unit represents has been changed by unequal probability sampling. We suggest the empirical likelihood à ! n Y πi wi Pn L (w) = , (5) j=1 πj wj i=1 Pn with i=1 wi = 1 and wi ≥ 0. The maximum likelihood estimator of wi using the empirical likelihood (5) is π −1 wi∗ = Pn i −1 , (6) j=1 πj which reduces to the H´ajek estimator of the population mean. Using the likelihood function (5), the empirical likelihood calibration estimator can be derived as a constrained NPMLE for the distribution function of the finite population. The constrained maximization problem can be formulated as maximizing (5) subject to the constraints in (4). Using the Lagrange multiplier method, the objective function to be minimized is à n ! n X X Q (w) = log (πi wi ) − n log πi wi i=1
+λ1
Ã
n X i=1
3196
n X
! wi − 1
i=1
+ λ2
à n X i=1
! wi xi − µx
.
ASA Section on Survey Research Methods
Setting the partial derivative of Q with respect to wi equal to zero gives ∂Q 1 nπi = − Pn + λ1 + λ2 xi = 0. ∂wi wi i=1 πi wi Pn Using i=1 wi (∂Q/∂wi ) = 0, we have 1 wi = , λ1 πi + λ2 (xi − µx )
i
and
(7)
where the λi , i = 1, 2, are the solutions to g1 (λ1 , λ2 ) =:
n X i=1
1 =1 λ1 πi + λ2 (xi − µx )
(8)
xi − µx = 0. λ1 πi + λ2 (xi − µx )
(9)
and g1 (λ1 , λ2 ) =:
n X i=1
The notation A =: B means that B is defined to be equal to A. A modified Newton-Raphson method can be used to solve the nonlinear equations (8) and (9). See Appendix A. Chen and Sitter (1999) also considered unequal probability sampling and proposed the pseudo empirical likelihood estimator. Instead of maximizing (5), they proposed maximizing L (w) =
n X 1 log (wi ) , π i=1 i
(10)
subject to the same constraints (4). The resulting pseudo empirical maximum likelihoodP estimator n (PEMLE) for the mean of y is y¯P EM LE = i=1 wi yi where 1 wi = (11) πi (λ1 + λ2 xi ) where λ1 and λ2 satisfy (4). Because the Chen and Sitter (1999) method lacks the maximum likelihood interpretation, we expect that our method is more efficient in large samples. Efficiency will be investigated further in the next section.
3.
for some positive constants K1 and K2 , where N is the number of elements in the finite population. Let ui = xi − µx and assume that ³ ´ max |ui | = op n−1/2 (13)
Asymptotic Properties
We now study the asymptotic properties of the calibration NPMLE estimator of the population mean. To discuss the asymptotic properties of the empirical likelihood estimator, assume a sequence of finite populations with finite fourth moments of as defined in Isaki and Fuller (1982). Assume the sampling mechanism satisfies © ª K1 < max n−1 N πi < K2 (12) i
3197
Pn ³ ´ πi−1 ui −1/2 = O n . Pni=1 −1 p 2 i=1 πi ui
(14)
Although assumptions (13) and (14) can be derived from the existence of the second moment and from the consistency of the Horvitz-Thompson estimator, we state them for convenience in the derivation. Under assumptions similar to (12) - (14), Chen and Sitter (1999) proved that their pseudo empirical likelihood estimator is asymptotically equivalent to the generalized regression (GREG) estimator y¯GREG , where ˆ y¯GREG = x ¯π + (µx − x ¯π ) B
(15)
and (¯ xπ , y¯π ) =
à n X i=1
ˆ= B
Pn
!−1 πi−1
n X
πi−1 (xi , yi )
i=1
πi−1 (xi − x ¯π ) (yi − y¯π ) . Pn 2 −1 ¯π ) i=1 πi (xi − x
i=1
The following theorem states some asymptotic properties of the calibration NPMLE using the weights in (7) with (8). Theorem 1 Under the assumptions (12)-(14), the NPMLE of the mean of y is asymptotically equivalent to ˆ∗ y¯opt = y¯π + (µx − x ¯π ) B (16) where ˆ∗ = B
Pn
πi−2 (xi − µx ) (yi − y¯π ) . Pn 2 −2 i=1 πi (xi − µx )
i=1
Here, (¯ xπ , y¯π ) is defined after (15). The proof of the Theorem is given in Appendix B. ˆ in the GREG estiRoughly speaking, the B mator (15) estimates the population slope for the regression of y on x. On the other hand, in ˆ ∗ in (16) estimates many sampling designs, the B −1 [V ar (¯ xπ )] Cov (¯ xπ , y¯π ), which leads to the ‘optimal’ estimator discussed by Rao (1994). Zhong and Rao (2000) also derived an optimal estimator very similar to (16) under stratified random sampling. The idea of using πi−2 to compute the regression coefficient also appears in Isaki and Fuller (1982).
ASA Section on Survey Research Methods
4.
Variance estimation
For variance estimation, we use the linearization method of Binder (1983). When the parameter of interest is the population mean, the NPMLE can be written as the solution to the estimating equation U1 (θ, λ1 , λ2 ) ≡
n X i=1
di yi −θ =0 λ1 + λ2 di ui
(17)
where di = πi−1 and (λ1 , λ2 ) is the solution to the simultaneous estimating equation : U2 (θ, λ1 , λ2 ) ≡
n X i=1
di −1=0 λ1 + λ2 di ui
Pn Pn Let Vˆ = i=1 j=1 Ωij be the design unbiased Pn variance estimator of N −1 i=1 di yi . Using (21), a “plug-in” variance estimator can be derived as ·³ ³ ´ ´ ³ ´0 ¸ −1 ˆ ˆ ˆ ˆ ˆ ˆ V θ = A11 I, −B12 ΣU I, −B12 Aˆ−1 11 , (24) ˆ12 = Aˆ12 Aˆ−1 , and Aˆ12 and Aˆ22 where Aˆ−1 = 1, B 11 22 are derived from (22)³and (23), respectively, with ´ ˆ ˆ (λ1 , λ2 ) replaced by λ1 , λ2 . Since the component ΣU should represent the sampling variance of ˆ U be computed as U terms only, we propose that Σ
(18)
ˆU = Σ
n X n X
Ωij hi h0j
(25)
i=1 j=1
and U3 (θ, λ1 , λ2 ) ≡
n X i=1
di ui = 0. λ1 + λ2 di ui
(19)
where hi = (yi , 1, ui ). Therefore, combining (24) and (25), we have n X n ³ ´ X Vˆ θˆ = Ωij ei ej
Using the linearization method of Binder (1983), ³ ´0 ˆλ ˆ1, λ ˆ 2 can be the variance-covariance matrix of θ, written
¡ ¢0 J −1 ΣU (θ, λ1 , λ2 ) J −1
(20)
where
∂U1 /∂θ J = ∂U2 /∂θ ∂U3 /∂θ
∂U1 /∂λ2 ∂U2 /∂λ2 ∂U3 /∂λ2
∂U1 /∂λ1 ∂U2 /∂λ1 ∂U3 /∂λ1
and ΣU (θ, λ1 , λ2 ) is the variance-covariance matrix 0 of (U1 , U2 , U3 ) treating θ, λ1 , λ2 as constants. Using ∂U2 /∂θ = ∂U3 /∂θ = 0, we have µ −1 ¶ A11 −A−1 A12 A−1 −1 11 22 J = . 0 A−1 22 where A11 = ∂U1 /∂θ, A12 = (∂U1 /∂λ1 , ∂U1 /∂λ2 ) and à ! ∂U2 ∂λ1 ∂U3 ∂λ1
A22 =
∂U2 ∂λ2 ∂U3 ∂λ2
Thus, after some algebra, we have ³ ´ £ 0¤ −1 V θˆ = A11 (1, −B12 ) ΣU (θ, λ1 , λ2 ) (1, −B12 ) A−1 11 . (21)
where A11 = −1, B12 = A12 A−1 22 and A12 = −
n X
2
i=1
A22 = −
di
n X
(λ1 + λ2 di ui )
µ
di 2
i=1
(λ1 + λ2 di ui )
(1, di ui ) yi 1 ui
di ui di u2i
0 where ei = yi − yˆi with yˆi = Aˆ12 Aˆ−1 22 (1, ui ) . In some calibration literature, this method has been called the residual technique because the standard variance estimator is applied to the residuals. The only difference here is that the regression coefficients are computed differently.
5.
Simulation Studies
To study the properties of the proposed calibration estimator, we performed a limited simulation study. In the simulation study, four artificial finite populations for (xi , yi , zi ) of size N = 10, 000 are generated. The populations are [A] zi ∼ χ2 (2) xi yi
.
(22)
¶ . (23)
3198
(26)
i=1 j=1
= ai + 0.5zi + 2 √ = 1 + 0.5 (xi − 3) + ei
[B] (xi , zi ) are the same as in population [A] and 2 yi = (xi − 3) + ei [C] zi ∼ χ2 (2) + 2 xi yi
= ai + 0.5zi + 1 √ = 1 + 0.5 (xi − 3) + ei
[D] (xi , zi ) are the same as in population [C] and 2 yi = (xi − 3) + ei
ASA Section on Survey Research Methods
where ai ∼ N (0, 1), independent of zi , and ei ∼ N (0, 1), independent of (ui , ai , zi ), in the four populations. From each of the finite population generated above, Probability Proportional to Size (PPS) samples of size n = 200 and n = 500 are generated where the probability of selecting a single element pi is proportional to zi . We assume that the population mean of xi is known and is used for the calibration. From each sample, four estimators of the population mean of y are computed. The estimators are the Hansen-Hurwitz (HH) estimator for the −1 −1 −1 PPS sampling ³P using ´ weight di = N n pi , where N pi = zi / i=1 zi , the GREG estimator defined in (15), the pseudo empirical likelihood estimator (PEMLE) of Chen and Sitter (1999) defined in (11), and the proposed NPMLE defined in (7). Variance estimators are also computed for the last two point estimators. The variance estimator for the PEMLE estimator, derived using the same arguments in Section 4, is computed by the residual method with the residual ei = yi − yˆi 0 where yˆi = Aˆ12 Aˆ−1 22 (1, ui )
Aˆ12 = −
n X
³ i=1
Aˆ22 = −
n X i=1
di ˆ1 + λ ˆ 2 ui λ
di ³ ´2 ˆ1 + λ ˆ 2 ui λ
1 ui
ui u2i
3. In population A and B, the NPMLE shows better performance than the other calibration estimators. Note that the two empirical likelihood estimators can be written θˆP EM LE
=
n X i=1
θˆN P M LE
=
n X i=1
di yi λ1 + λ2 ui di yi . λ1 + λ2 di ui
Thus, the PEMLE will be efficient if yi ∝ d−1 i xi , while the NPMLE will be efficient if yi ∝ xi . If the design weights di are highly, the PEMLE can be very inefficient. Therefore, the NPMLE will be less sensitive to extreme design weights. 4. In population D, where the design weights are relatively homogeneous and the linear relationship between y and x does not hold, the calibration estimators do not improve the efficiency of the HH estimator. In population B, the NPMLE is more efficient than the HH estimator because the efficiency of the HH estimator is mitigated by the extreme weights.
´2 (1, ui ) yi µ
2. In population C, the three calibration estimators show similar performances because the weights are relatively homogeneous. The ratio of the variance of the calibration estimator to the variance of the HH estimator is about 0.5, which is consistent with the theory because the population correlation between x and y is equal √ to 0.5.
¶ .
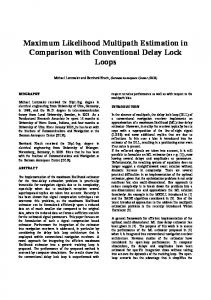
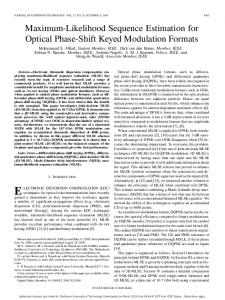
The variance estimator for the NPMLE is computed using the residual method described in (26). Table 1 reports the simulation results of the four point estimators. Table 2 reports the relative biases and the t-statistics of the two variance estimators. The relative bias is the Monte Carlo bias divided by the Monte Carlo variance of the point estimator. The t-statistic is the statistic used to test the significance of the Monte Carlo bias of the variance estimator. From the results in Table 1 and in Table 2, we have the following conclusions. 1. The HH estimators in population A and B have bigger variances than those in population C and D. Since the z-variables are highly variable in population A and B, the resulting sampling weights for the HH estimator are also highly variable and increase the variances of the resulting HH estimators.
3199
5. The variance estimator for the NPMLE shows good performances in terms of the relative biases. The variance estimator for PEMLE shows significant biases for population B. Roughly speaking, when some of the design weights are extremely large, the condition (14) does not hold and the second order term in the Taylor linearization is no longer negligible unless linear relationship between the study variable and the control variable holds.
Appendix A. Algorithm We propose solving the nonlinear equations (8) - (9) by a modified Newton-Raphson method as follows: (0)
[Step 1] Set λ1 set γ = 1.
=
Pn i=1
(0)
πi−1 and λ2
= 0. Also,
ASA Section on Survey Research Methods
[Step 2] Compute the updated values of λ’s iteratively as h i−1 ³ ´ λ(k+1) = λ(k) + γ ∆(k) g∗ − g(k) ³ ´0 (k) (k) , ∆(k) is a 2×2 matrix where λ(k) = λ1 , λ2
Let γi = δπi−1 ui . The numerator part of (A.3) can be written µ ¶ n X yi γi2 −1 N 1 − γi + π 1 + γi i=1 i = N −1
0
of ∂gi /∂λj evaluated at λ = λ(k) , g∗ = (1, 0) , h ³ ´ ³ ´i0 and g(k) = g1 λ(k) , g2 λ(k) . (k+1)
(k+1)
[Step 3] If λ1 π i + λ2 (xi − µx ) < 0 for some i = 1, 2, · · · , n, then set γ = γ/2 and go to Step 2. ¯ ¯ ¯ (k+1) (k) ¯ [Step 4] If maxi ¯λi − λi ¯ < ² for sufficiently small ² > 0, stop and compute the final weights from (7) using λ(k+1) . Otherwise, set k = k + 1 and γ = 1, and go to Step 2. Step 2 essentially describes a Newton-Raphson solution to the nonlinear equations (8) through (9). Step 3 guarantees that the resulting calibration weights be always positive. If we further want to restrict the weights to be wi ∈ [Lw , Uw ] for given Lw and (k+1) Uw values, it is enough to check Uw−1 ≤ λ1 πi + (k+1) −1 (xi − µx ) ≤ Lw in Step 3. See also Chen et λ2 al (2002). B. Proof of Theorem 1 First note that the two constraints, (8) and (9), can be written n X
wi
= 1
(A.1)
wi ui
= 0.
(A.2)
i=1 n X i=1
The NPMLE of the population mean of y can be written ¢−1 −1 Pn ¡ N −1 i=1 1 + δπi−1 ui πi y i y¯N P M LE = ¡ ¢−1 −1 P n −1 N −1 i=1 1 + δ πi ui πi (A.3) where δ = λ2 /λ1 and N is the size of the finite population. By (A.2), the δ satisfies n X i=1
πi−1 ui = 0. 1 + δπi−1 ui
(A.4)
Using the argument of Owen ¡ (1990, ¢ p 100-101), it can be shown that δ = Op n−1/2 and δ=
à n X i=1
!−1 πi−2 u2i
n X
´ ³ πi−1 ui + op n−1/2 (A.5)
i=1
3200
n ³ ´ X yi (1 − γi ) + op n−1/2 . π i=1 i
Similarly, the denominator part can be written µ ¶ n X 1 γi2 −1 N 1 − γi + π 1 + γi i=1 i =
N −1
n ³ ´ X 1 (1 − γi ) + op n−1/2 . πi i=1
Hence, the NPMLE is asymptotically equivalent to Pn yi πi−1 (1 − γi ) Pi=1 n −1 i=1 πi (1 − γi ) and is also asymptotically equivalent to (16).
References Anderson, T. W. (1957). Maximum likelihood estimates for a multivariate normal distribution when some observations are missing. Journal of the American Statistical Association, 52, 200203. Chen, J. and Sitter, R. R. (1999). A pseudo empirical likelihood approach to the effective use of auxiliary information in complex surveys. Statistica Sinica, 9, 385-406. Chen, J., Sitter, R.R., and Wu, C. (2002). Using empirical likelihood methods to obtain range restricted weights in regression estimator for surveys. Biometrika, 89 230-237. Chen, J. and Qin, J. (1993). Empirical likelihood estimation for finite populations and the effective usage of auxiliary information. Biometrika, 80, 107-116. Cochran, W.G. (1977). Sampling Techniques, 3rd ed. New York: Wiley. Deville, J. C. and S¨arndal, C. E. (1992). Calibration estimators in survey sampling. Journal of the American Statistical Association, 87, 376-382. Isaki, C. and Fuller, W. A. (1982). Survey design under the regression superpopulation model. Journal of the American Statistical Association, 77, 89-96.
ASA Section on Survey Research Methods
Hartley, H. O. and Rao, J.N.K. (1968). A new estimation theory for sample surveys, Biometrika, 55, 547-55. Fuller, W. A. (2002). Regression estimation for sample surveys. Survey Methodology, 28, 5-23. Owen, A. B. (1988). Empirical likelihood ratio confidence intervals for a single functional. Biometrika, 75, 237-249. Owen, A. B. (1990). Empirical likelihood ratio confidence regions. The Annals of Statistics, 18, 90120.
Table 1: Monte Carlo Biases, Variances, and Mean squared errors of the point estimators for the sample, based on 5,000 samples. n
Rao, J.N.K. (1994). Estimating totals and distribution functions using auxiliary information at the estimation stage. Journal of Official Statistics, 10, 153-165. Wu, C. and Sitter, R.R. (2001). A model-calibration approach to using complete auxiliary information from survey data. Journal of the American Statistical Association, 96, 185-193.
Pop’n A
B
200 C
Zhong, B. and Rao, J.N.K. (2000). Empirical likelihood inference under stratified random sampling using auxiliary population information. Biometrika, 87, 929-938.
D
A
B
500 C
D
3201
Estimator HH GREG PEMLE NPMLE HH GREG PEMLE NPMLE HH GREG PEMLE NPMLE HH GREG PEMLE NPMLE HH GREG PEMLE NPMLE HH GREG PEMLE NPMLE HH GREG PEMLE NPMLE HH GREG PEMLE NPMLE
Bias 0.00 0.00 0.00 0.00 0.01 -0.08 0.05 -0.01 0.00 0.00 0.00 0.00 0.00 -0.02 0.01 0.00 0.00 0.00 0.00 0.00 0.00 -0.04 0.03 -0.01 0.00 0.00 0.00 0.00 0.00 -0.01 0.01 0.00
MSE 0.0522 0.0183 0.0188 0.0179 0.2877 0.1872 0.3860 0.0972 0.00926 0.00612 0.00612 0.00615 0.0414 0.0537 0.0546 0.0459 0.01905 0.00840 0.00850 0.00804 0.4911 0.0873 0.1718 0.0427 0.00359 0.00236 0.00236 0.00236 0.0161 0.0211 0.0212 0.0179
ASA Section on Survey Research Methods
Table 2: Monte Carlo relative bias and the tstatistics of the variance estimators for the sample, based on 5,000 samples. n
Pop’n A B
200 C D A B 500 C D
Estimator PEMLE NPMLE PEMLE NPMLE PEMLE NPMLE PEMLE NPMLE PEMLE NPMLE PEMLE NPMLE PEMLE NPMLE PEMLE NPMLE
Rel. Bias 0.012 -0.005 1.561 -0.054 -0.030 -0.035 0.046 -0.014 0.035 -0.016 1.693 -0.009 0.010 0.008 0.029 0.007
t-statistic 0.41 -0.08 8.55 -1.49 -1.51 -1.79 2.26 -0.68 1.62 -0.42 7.12 -0.24 0.52 0.38 1.48 0.34
3202