Plant Science Today (2016) 3(3): 258-266 http://dx.doi.org/10.14719/pst.2016.3.3.242
258
ISSN: 2348-1900
Plant Science Today http://horizonepublishing.com/journals/index.php/PST
Research Article
Classical Single Factor Optimisation of Parameters for Phenolic Antioxidant Extraction from Tamarind Seed (Tamarindus indica) Atreyi Sarkar and Uma Ghosh* Department of Food Technology and Biochemical Engineering, Jadavpur University, Kolkata – 700032, India Article history Received: 5 June 2016 Accepted: 27 June 2016 Published: 1 July 2016 © Sarkar and Ghosh (2016) Editor K K Sabu
Publisher Horizon e-Publishing Group
Corresponding Author Uma Ghosh
[email protected]
Abstract Presently the work deals with outreaching and exhaustive investigations involving single factor optimisation method, to optimise the parameters for phenolic antioxidant extraction from the seeds of Tamarindus indica. At first the characterization of the seeds has been performed by estimating the total calorie value, carbohydrate, protein, fat, Total Polyphenol Content (TPC), moisture (%), total ash (%), total solid (%), volatile solid (%), fixed carbon (%), bulk density (%), pH and solubility. The effects of solid to solvent ratio (1:10 - 1:30 w/v), ethanol concentration (25 - 100% v/v), extraction time (1 24 hours) and extraction temperature (25 - 60°C) have been investigated to optimise the extraction of Total Polyphenol Content (TPC) and Antioxidant capacity determined by Folin - Ciocalteu and FRAP analyses respectively. The solvent extraction conditions have been optimised at solid to solvent ratio of 1:20 w/v, 50% ethanol as solvent and 3 hours of shaking at 40°C. Keywords Optimisation; characterisation; total polyphenol content; FRAP Sarkar, A and U. Ghosh. 2016. Classical Single Factor Optimisation of Parameters for Phenolic Antioxidant Extraction from Tamarind Seed (Tamarindus indica). Plant Science Today 3(3): 258-266. http://dx.doi.org/10.14719/pst.2016.3.3.242
Introduction
Food industries mostly utilise synthetic antioxidants to prevent oxidation of processed foods (Li et al., 2014). Though the use of synthetic additives are effective in maintaining the shelf life of processed foods, the need of substituting synthetic additives with natural antioxidants are gradually increasing day by day considering the food safety they offer (Ortiz et al., 2012; Karre et al., 2013). The biotechonomy frame and liability of modern food industries towards maintaining a sustainable environment are leading towards imposing greater emphasis on valorising food by products as a source of antioxidant in food formulations. Moreover, the fast growing population and demand for re-usable resources ISSN: 2348-1900
have triggered the use of food residues or by products as the newly emerging sources of natural antioxidants for the production of value added food. Tamarind seeds are rich sources of natural polyphenolic antioxidants (Tsuda et al., 1994; Reis et al., 2016). The fruits or pods of T. indica contains 1-10 seeds which are irregular in shape with flattened or rhomboid structure and reddish or purplish brown in colour (Akajiaku et al., 2014). The mean length, breadth and thickness of the seeds have been reported as 1.44±0.17, 1.05±0.09 & 0.63±0.08 cm respectively with an average weight of 0.69±0.15 g per seed (Bhattacharya et al., 1991). India is a major producer of Tamarind in the world, producing 191750 tonnes of tamarind in the year 2013- 14 and the pulp of the ripe fruit is extensively Horizon e-Publishing Group
259
Plant Science Today (2016) 3(3): 258-266
used in Indian cuisine as a condiment (Spices Board India) generating large amount of seeds as the underutilized by-product of the tamarind pulp industry (Kumar and Bhattacharya, 2008). Though various valorisations of these seeds are possible (Sudjaroen et al., 2005), antioxidant property is presently being considered as the subject of study. Many antioxidant compounds with high nutraceutical properties, such as 2-Hydroxy3΄,4΄Dihydroxyacetophenone, 3,4 – Dihydroxyphenyl acetate, (-) Epicatechin (Tsuda et al., 1994), (+) catechin, taxifolin, apigenin, eriodictyol, luteolin and naringenin (Sudjaroen et al., 2005) have been isolated from the seeds of Tamarindus indica, making it a valuable source for recovery of natural antioxidants. But the extraction process of these compounds from the seed is crucial since their application and stability in food system depend on the extraction parameters in use. The aim of extraction is to provide good yield of target substances but most importantly to retain highest quality and most of the activity the seeds actually have. In the present study, optimisation of extraction parameters for solvent extraction using binary mixture of ethanol and water has been adopted. The two most commonly used optimisation studies are the single-factor experiments and response-surface methodology (RSM). In this study single-factor experiments also known as (One Factor at a Time OFAT study) have been used to optimise the extraction of total phenolics and antioxidants. Correlation analyses on the responses have been studied to judge the suitability of the assays used in the optimisation studies. Solid to solvent ratio, solvent concentration, shaking time and extraction temperature have been investigated as these have shown profound influence on antioxidant property in the previous studies (Pinelo et al., 2005; Yim et al., 2012). The aim of this study has been to optimise the effect of solid to solvent ratio, ethanol concentration, extraction time and extraction temperature for the extraction of phenolic antioxidant from the seeds of Tamarindus indica.
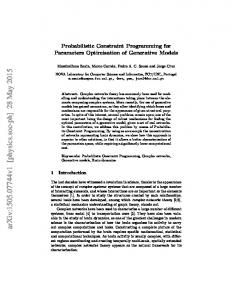
Preparation of sample The whole seeds have been graded & sorted and cleaned. Further, they have been sun dried for 7 hours for 4 consecutive days bearing an average atmospheric temperature of about 390 C to remove the extraneous moisture and stirred occasionally to prevent mold infestation. The seeds have been stored in air-tight containers till they were ground to obtain average sized particle for further investigation (Figure 1).
Materials and methods Collection of sample Tamarind seeds have been collected from the local markets of Jadavpur near Jadavpur University Campus, a densely populated area of Kolkata, India due to their profound availability. 2 Kg of sample has been procured from fruit sellers for the entire study to maintain uniformity in composition and characteristic properties throughout. Sample collection required very low or negative cost including the transit charges from the collection point to work place.
Experimental design Single-factor experiments have been used for solvent extraction in the present study. Four factors, namely, solid to liquid ratio (w/v), ethanol concentration, extraction time and temperature have been studied. The levels for each independent variable have been chosen based on two responses of the crude extracts: the total phenolic content (TPC) and total antioxidant content (FRAP). The solid to liquid ratio has been investigated at five levels: 1:10, 1:15, 1:20, 1:25 and1:30. The ethanol concentration has been varied by adjusting the ethanol composition as 25 %, 50 %, 75% and 100% (v/v) in the ethanol–water
Horizon e-Publishing Group
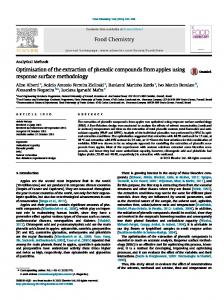
Chemicals and reagents All analytical grade chemicals have been used for experimental purposes and distilled water has been essentially used to make the reagents. The materials which have been used for the purpose of study were procured from Merck (Germany) except for Gallic Acid, from S.d fine chem. Ltd. (Mumbai, India), 2,4,6-Tri(2-pyridyl)-S-triazine (TPTZ), from Himedia (Mumbai, India) and Anthrone Reagent, from Qualigens (Mumbai, India). Extraction of sample Extraction of phenolic antioxidants from the sample has been a three step process, namely – extraction in ethanol, defatting and filtering. Figure 2 shows the sequential and progressive steps for obtaining a phenolic antioxidant rich extract from the sample. The dried sample, at first has been subjected to solvent extraction in a temperature-controlled water bath shaker (manufactured by Sicco Instruments Pvt. Ltd., Calcutta, India) at a constant speed of 60 rpm for the various times at variable temperatures. Then the crude extracts have been defatted using hexane as fat solvent in a separating funnel and the ethanolic layer has been collected. This extract has been further filtered using filter paper (Whatman International Ltd., England) of pore size 41 microns and directly used for estimation of phenolic compounds and assessment of antioxidant capacities by various chemical assays. Duplicate runs have been taken for each extraction process and all the analyses have been performed with 3 times reproducibility.
ISSN: 2348-1900
Plant Science Today (2016) 3(3): 258-266
binary mixture. The extraction times studied ranged from 1 -24 hour (1,3,5,9,12,24 hours) and the ranges in temperature variation have been 25°C, 30°C, 40°C, 50°C. •
•
Antioxidant components have been extracted using the best solid to solvent ratio selected at the first step, keeping all other parameters constant, i.e 50% (v/v) ethanol concentration, 25°C temperature and 3 hours of shaking time. Using the best solid to liquid ratio selected at first step, phenolic compounds have been extracted at various solvent concentrations keeping the other two parameters constant. The best solvent
260
Analytical methods Characterisation of sample Total calorie value estimation was done using Karas-Simek bomb calorimeter according to the method described by Das and Mondal, 2013. Analysis of total carbohydrate, protein and fat, moisture content (MC) and ash content have been estimated using standard AOAC methods 1975. Volatile solids (VS) and fixed carbon (FC) have been determined according to the standard methods stated by ASTM D3172; Briefly, VS has been estimated by heating the sample for 7 mins in a muffle furnace at 925°C. FC has been estimated by deducting the sum of moisture content (%), ash content (%) and volatile solid (%) from
Figure 1. Grinding of whole tamarind seed to homogenous average sized particles
Figure 2 (a) Extraction of phenolic antioxidant by temperature controlled shaker water bath Figure 2. Extraction of phenolic antioxidants from the sample by a three step process – (a) extraction by heat and agitation (b) de-fatting (c) filtering to obtain phenolic antioxidant rich ethanolic extract.
• •
concentration has been determined at the second step. The best extraction time has been selected by considering the best solid to liquid ratio and solvent concentration Finally the optimal temperature has been determined.
ISSN: 2348-1900
100(%). Total solid (%) has been determined by deducting MC from 100(%). Bulk density of the sample has been measured in a graduated cylinder (Blake, 1965). pH estimation has been done using single electrode pH meter (Elico LI 120, Hyderabad, India) and solubility test has been done according to the methods described
Horizon e-Publishing Group
261
Plant Science Today (2016) 3(3): 258-266
Figure 2 (b) Separation of lipid and ethanol soluble layer in separating funnel Figure 2 contd. Extraction of phenolic antioxidants from the sample by a three step process – (a) extraction by heat and agitation (b) de-fatting (c) filtering to obtain phenolic antioxidant rich ethanolic extract.
in FSSAI Lab condiments.
Manual
for
spices
and
Determination of total polyphenolic content (TPC) TPC extracts has been determined by the method described by Malik and Singh, 1980 with some modifications. Briefly, 0.75 ml of different concentrations of the extracts have been taken, to which 3 ml of distilled water and 0.5 ml of Folin- ciocalteu reagent (diluted to 1:1 with water) and 1 ml of 20% Na 2 CO 3 have been added. After 120 minutes the absorbance has been read by spectrophotometer (Hitachi U- 2000) at 760 nm wavelength and plotted in a standard calibration curve of Gallic Acid. These results have been expressed as Gallic Acid Equivalents per gram of dry sample. Determination of total antioxidant content (FRAP assay) The FRAP assay has been carried out according to Benzie & Strain, 1996. Briefly, the FRAP reagent has been prepared from sodium acetate buffer (300 mM, pH 3.6), 10 mM TPTZ solution (dissolved in 40 mM HCl) and 20 mM
Horizon e-Publishing Group
iron(III) chloride solution in a ratio (v/v) of 10:1:1, respectively. The FRAP reagent has been prepared freshly and warmed to 37°C in a water bath before use. 100 µl of the sample solution has been added to 3 ml of the freshly prepared FRAP reagent. The absorbance has been measured at 593 nm using spectrophotometer after 4 min and plotted in a standard calibration curve of FeSO 4 solution. The results have been expressed as µmol Fe (II)/g dry sample. Statistical Analysis Results have been expressed as mean ± standard deviation of triplicate assays and analysed by Microsoft Excel 2007. Pearson correlations between variables have been established using MINITAB (version 17). Significant levels of correlation have been defined using the values p < 0.05. Results and discussions Profound nutritional and nutraceutical properties of tamarind seeds have been observed from the selective and mutually exclusive characterization of the sample. Carbohydrate, protein and fat content of the
ISSN: 2348-1900
Plant Science Today (2016) 3(3): 258-266
262
Figure 2(c) Filtration of Ethanol soluble layer to collect crude extract Figure 2 contd. Extraction of phenolic antioxidants from the sample by a three step process – (a) extraction by heat and agitation (b) de-fatting (c) filtering to obtain phenolic antioxidant rich ethanolic extract.
seed have collectively contributed to the gross calorie content of 4.95 kcal g -1 (Table 1) and it has been observed that tamarind seeds are an important source of phenolic antioxidant. The pH of the sample has been noted as 5.80± 0.43 and it has been found to be 70% soluble in cold water and 89.7 % in 80% ethanol. In the earlier literatures, researchers reported acetone, methanol, ethanol (Zhou and Yu, 2004; Turkmen et al., 2006) and water (Triantaphyllou, 2001) as the most effective solvents for extraction of antioxidant components. In the present study, the experimental work primarily deals with water and ethanol as aqueous - organic phase for extracting antioxidant components from the sample. Effect of solid to solvent ratio At solid to solvent ratio of 1:20, the highest TPC of 33 mg GAE g -1 and total antioxidant activity ISSN: 2348-1900
of 210 µmol Fe (II) g -1 have been recorded. Figure 3 shows the successive rise in the phenolic antioxidant content with solid to solvent ratio upto the value of 1:20, which justifies the requirement of high solid-tosolvent ratio as a favourable factor in extraction of phenolic compounds. The rate of mass transfer from dissolved particle to liquid solvent depends on various factors; few being –liquid mass transfer coefficient, the total solid – liquid interfacial area and the concentration driving force (Chisti, 2007). The result indicates that a high solid-to-solvent ratio acts as a driving force to increase the concentration gradient, resulting in an increase of diffusion of extractives into the solvent giving a greater extraction. Previous studies also reported larger concentration gradient to be favourable for mass transfer across solid-liquid interface for better antioxidant extraction (Landbo and Meyer, 2001; Al-Farsi and Lee, 2008).
Horizon e-Publishing Group
263
Plant Science Today (2016) 3(3): 258-266
Figure 3 Variation of TPC and Antioxidant activity with varying solid to solvent ratio
Figure 4 Variation of TPC and Antioxidant activity with varying solvent concentration
However the phenomenon of the static trend in phenolic antioxidant extraction after the ratio of 1:20 can be explained by Fick’s Second Law of Diffusion where it is stated that no rise in extraction is possible after an equilibrium is achieved (Zhang et al., 2007), indicating the solid to solvent ratio of 1:20 as the equilibrium point and hence the optimised condition for total phenol and antioxidant extraction from the sample. A significant and strong correlation association (p