... via Genetic Programming. Thomas Haynes & Dale Schoenefeld ..... 7] Thomas Haynes, Roger Wainwright, Sandip Sen, and Dale Schoenefeld. Strongly typed.
Clique Detection via Genetic Programming Thomas Haynes & Dale Schoenefeld Department of Mathematical & Computer Sciences The University of Tulsa 600 South College Avenue Tulsa, OK 74104{3189 e{mail: [haynes,dschoen]@euler.mcs.utulsa.edu (918) 631{[3234,3140] Abstract
Genetic programming is applied to the task of nding all of the cliques in a graph. Nodes in the graph are represented as tree structures, which are then manipulated to form candidate cliques. The intrinsic properties of clique detection complicates the design of a good tness evaluation. We analyze those properties, and show the clique detector is found to be better at nding the maximum clique in the graph, not the set of all cliques.
Category: Genetic Programming
1 Introduction
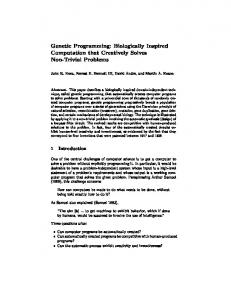
Determining whether an undirected graph contains a clique of size � k is NP complete. In this paper, Genetic Programming (GP) [10] techniques are utilized to nd cliques in a graph. A pure Genetic Algorithm (GA) approach was considered, but natural encodings resulted in variable length chromosomes. GPs are ideal for representing variable length chromosomes. A collection of cliques in a graph can be represented as a list of a list of nodes which, in turn, can be represented by a tree structure, as in Figure 1. Since a collection of cliques can be cast into a tree structure, it is easy to represent in a GP system. The trick is that the GP S{expression is a data structure rather than a program.
1.1 De nition of Clique
Given a graph G = (V; E )1, our goal is to obtain the set of all cliques of G. A subgraph G0 of G is a clique if G0 = (V 0; E 0) where V 0 � V; 1
We assume that G is undirected.
1
ExtCon C3 ExtCon
IntCon
C1
C2
IntCon
IntCon
3
IntCon
1 1
IntCon
2
2
2
1
1
Figure 1: Example S{expression for 6 node graph.
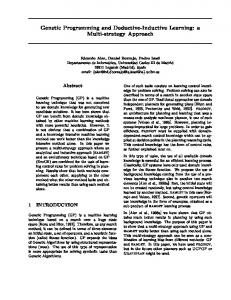
E 0 � E; and V 0 � V 0 ? f(vi; vi) j vi 2 V 0g = E 0: Less formally, a clique of G is a complete subgraph of G. We denote a clique by the set of vertices in the complete subgraph. Our goal is to nd all cliques of G. Since the subgraph of G induced by any subset of the vertices of a complete subgraph of G is also complete, it is su�cient to nd all maximal complete subgraphs of G. We refer to a maximal complete subgraph of G as a maximal clique. Figure 2 shows a graph with 6 nodes. The maximal cliques are f1,2,3,4,6g and f3,4,5g. 1 6 2
4
3
5
Figure 2: Example graph.
2 Genetic Programming Holland's work on adaptive systems [8] produced a class of biologically inspired algorithms known as genetic algorithms (GAs) that can manipulate and develop solutions to optimization, learning, and other types of problems. In order for GAs to be e�ective, the candidate solutions should be represented as n{ary strings (though some recent work has shown that GAs can be adapted to manipulate real-valued features as well). Though GAs are not guaranteed to nd optimal solutions, they still possess some nice provable properties (optimal allocation of trials to substrings, evaluating exponential number of schemas with linear number of string evaluations, etc.), and have been found to be useful in a number of practical applications [4]. Koza's work on Genetic Programming [10] was motivated by the representational constraint, i.e. xed length encodings, in traditional GAs. He claims that a large number of 2
apparently dissimilar problems in arti cial intelligence, symbolic processing, optimal control, automatic programming, empirical discovery, machine learning, etc. can be reformulated as the search for a computer program that produces the correct input{output mapping in any of these domains. To facilitate this search, he uses the traditional GA operators for selection and recombination of individuals from a population of structures, and applies the operators on structures represented in a more expressive language than used in traditional GAs. The representation language used in GPs are computer programs represented as Lisp S{expressions. GPs have attracted a large number of researchers because of the wide range of applicability of this paradigm, and the easily interpretable form of the solutions that are produced by these algorithms [9, 11].
3 Encoding of the Problem
3.1 Representation Scheme
Each S{expression in a GP pool will represent sets of candidate maximal cliques. The function and terminal sets are F = fExtCon, IntCong and T = f1: : : #nodesg. ExtCon \separates" two candidate maximal cliques, while IntCon \joins" two candidate cliques to create a larger candidate clique. Graphs are encoded in the DIMACS Challenge le format, which can be found at [14].
3.2 Fitness Measure
The tness evaluation will be composed of two parts: a reward for clique size and a reward for the number of cliques in the tree. Since we want to gather the maximal complete subgraphs, we want the reward for size to be greater than that for the number of cliques. We also want to make sure that we do not reward for a clique either being in the tree twice or being subsumed by another clique. The rst will falsely in ate the tness of the individual, while the second will invalidate the goals of the problem. The algorithm for the tness evaluation is: 1. Parse the S{expression into a sequence of candidate maximal cliques, each represented by an ordered list of vertex labels. 2. Throw away any duplicate candidate maximal cliques and any candidate maximal cliques that are subsumed by other candidate maximal cliques. 3. Throw away any candidate maximal cliques that are not cliques. The formula for measuring the tness is:
F = �c +
Xc n ; i
i=1
where c = # of valid candidate maximal cliques and ni = # nodes in cliquei: Both � and are con gurable by the user. Note that has to be large enough so that a large clique 3
1
2
3
4
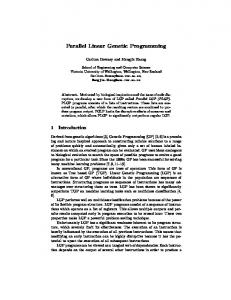
Figure 3: Example four node graph. contributes more to the tness of one S{expression than a collection of proper subcliques contributes to the tness of a di�erent S{expression. For example, consider the graph in Figure 3. It is clear that there is only one maximal clique: C4 = f1; 2; 3; 4g: However, there are four subcliques of cardinality three: C3 = ff1; 2; 3g; f1; 2; 4g; f1; 3; 4g; f2; 3; 4gg: The various resultant tnesses, as is varied, and � is held constant, are visually shown in Figure 4. Note that it is not until is larger than the cardinality of the clique that the desired result is found, see Table 1. Simply put, with the current tness function, must be chosen to respect the cardinality of maximum cliques in a graph. With other choices for � and , our tness function is more suited to determining the largest maximal clique in a graph, rather than the set of all maximal cliques. 11000 Fc Fc3
10000
4
9000 8000
Fitness
7000 6000 5000 4000 3000 2000 1000 0 1
2
3
4
5
β
6
7
8
9
10
Figure 4: Fitness for four node graph.
4 Example Encodings
The encoding presented as Figure 1 is interpreted to produce C = ff1; 2; 3gg as the set of candidate maximal cliques as follows. There are two problems in this S{expression. First, the candidate maximal clique denoted by C 1 = f1; 2g is subsumed in the candidate maximal clique C 3 = f1; 2; 3g and, hence, C 1 is thrown away. Second we eliminate duplication of node 1 and assume that C 2 = f1; 2g. As with C 1, C 2 is thrown away since C 2 is subsumed by C 3. With � = 50 and = 10 the tness for this chromosome is 1050. The S{expression corresponding to generation 0 for the 10 node graph presented in Figure 5 is presented in Figure 6. The set of candidate maximal cliques represented by this 4
�
F C4
1 1 2 1 2 17 1 3 81 1 4 257 1 5 626 1 6 1297 1 10 101001
FC 3
5 36 112 260 504 868 4004
Table 1: Fitness for both the clique of cardinality four and four connected sets of cardinality three, for di�erent . chromosome is: C = ff6g; f2g; f4; 7; 8gg: With � = 50 and = 10 the tness for this chromosome is 1050.
5 Experimental Results The clique detection problem was implemented in a modi ed version of GPengine [7], a Strongly Typed Genetic Programming system. Speci cally, the problem of ExtCon functions having to have either a parent which is an ExtCon function or be the root, was addressed. In the next subsections, we will present some contrived graphs to illustrate properties of our maximal clique detector. We have performed experiments with sample test cases from the DIMACS repository [14]. For the johnson16{2{4.clq graph, with 120 nodes and a largest clique of size 8, we were able to detect cliques of size 7. For the hamming8-2.clq graph, with 64 nodes and a largest clique of size 4, we were able to detect cliques of size 4. It should be realized that these graphs are intended for a di�erent problem, i.e. nding the largest clique.
5.1 Example Graph I
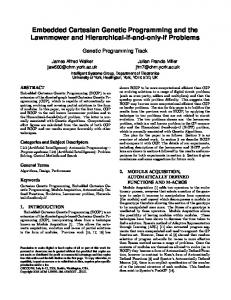
Figure 5 is a ten node graph that was used to test the clique detection system. The best and average tness per generation are plotted in Figure 7. The system steadily improves after generation 100, and the global optimum is found around generation 375. By generation 500, it is evident that a plateau has been reached, and that the average tness is only increasing slightly. S{expressions for the candidate maximal cliques corresponding to generations 0, 100, 200, 300, and 400 can be found in [6]. The resultant maximal cliques for generations 0, 100, 200, 300, and 400 are shown in Table 2. Notice the steady addition of cliques of cardinality three. Clearly by generation 400, all of the maximal cliques have been found.
5.2 Example Graph II
Figure 8 is a ten node graph that was used to test the e�ect of varying on the clique detection. From the discussion on � and in Section 3.2 and since Cmax = 4, the proposed 5
0
1
3
2
4
5
7
6
8
9
Figure 5: Example graph net10b.dat. ExtCon
ExtCon
IntCon
6
2
IntCon
4
7
8
Figure 6: S{expression for generation 0's best chromosome. optimal value for is 5. In this section, we examine values of = 10 and = 5 on the graph in Figure 8. The best and average tness per generation are plotted in Figure 9 for = 10. The system is stuck in a local optimum until about generation 500, at which point the average tness makes a dramatic jump, and then steadily improves. The largest maximal clique is found in generation 0. The resultant candidate maximal cliques for generations 0, 100, 200, 300, 400, 500, and 600 are shown in Table 3. The best and average tness per generation is plotted in Figure 10 for = 5. The system does not get stuck in a local optimum, but has a steady increase in tness. The shape of 12000 Best Average 10000
Fitness
8000
6000
4000
2000
0 0
100
200
300
400 Generation
500
600
700
800
Figure 7: Best and Average tnesses for graph net10b.dat. 6
Generation Fitness # of Snodes List of Candidate Maximal Cliques 0 1054 9 ff6g,f2g,f4,7,8gg 100 2400 481 ff0,3,4g,f3,7g,f5g,f0,1,4g, f6g,f8g,f1,2gg 200 6300 157 f4,5,8g,f0,3,4g,f1,2,5g, f9g,f3,4,7g,f4,7,8g, f0,1,4gg 300 9600 277 f4,5,8g,f0,1,4g,f1,2,5g, f2,5,6g,f1,4,5g,f0,3,4g, f4,7,8g,f6,9g,f3,4,7g, f5,8,9gg 400 10500 439 f5,6,9g,f3,4,7g,f1,2,5g, f4,7,8g,f4,5,8g,f0,3,4g, f1,4,5g,f0,1,4g,f2,5,6g, f5,8,9gg
Table 2: Cliques detected for 10 Node graph. 0
1
2
3
4
5
8
6
7
9
Figure 8: Example graph net10a.dat. the curve is more like Figure 7 than Figure 9. The step{like increases between generations 100 and 300 indicate the incremental learning of di�erent cliques. The resultant candidate maximal cliques for generations 0, 100, 200, 300, and 400 are shown in Table 4. With = 5, it would have been nice if the candidate maximal cliques C7;8;9 = ff7; 8g; f7; 9g; f8; 9gg; had coalesced into the clique C = f7; 8; 9g: The di�erence between the two clique sets with = 10 and = 5 is that the larger value of rewards for nding larger cliques. With too high a value of , the clique detection system is actually hampered in the attempt to nd all of the cliques in a graph.
6 Conclusions In general, it is observed that the clique detector is better at discovering a large clique rather than all of the cliques in a graph. As was shown in Table 2, the largest clique is quickly found, while the list of all possible cliques takes much longer. As was shown in Table 3, the largest clique is found in the rst generation. Since, in practice, the largest clique, Cmax, in a graph is not known beforehand, a large value for must be supplied. However, a value of 7
14000
12000
10000
Fitness
8000
6000
4000
2000
Best Average
0 0
100
200
300
400 500 Generation
600
700
800
900
Figure 9: Best and Average tnesses for graph net10a.dat, with = 10. 1400
1200
1000
Fitness
800
600
400
Best Average
200
0 0
100
200
300 Generation
400
500
600
Figure 10: Best and Average tnesses for graph net10a.dat, with = 5.
> Cmax will retard and even halt the learning of cliques smaller than Cmax. This suggests the need for a two{pass clique detector: 1. Attempt to nd the cardinality of the largest clique. 2. Attempt to nd all of the cliques in the graph.
References [1] Mihir Bellare and Madhu Sudan. Improved non{approximability results. In Proceedings of the 26th Annual ACM Symposium on the Theory of Computing, pages 184{193. ACM, 1994. [2] Thang Nguyen Bui and Paul H. Eppley. A hybrid genetic algorithm for the maximum clique problem. In Larry Eshelman, editor, Proceedings of the Sixth International Conference on Genetic Algorithms, pages 478{484, San Francisco, CA, 1995. Morgan Kaufmann Publishers, Inc. 8
Generation Fitness # of Snodes 0 10050 15 100 2400 353 200 300 400
10350 10050 10500
125 47 137
500
11100
709
600
12300
359
List of Candidate Maximal Cliques ff 0, 1, 2, 3 g, f 5 g, f 6 gg ff 1, 2, 3 g,f 0, 2, 3 g,f 4, 6 g f 4, 5 g, f 9 g, f 7 g g ff 3, 4 g, f 8, 9 g, f 0, 1, 2, 3 g, f 5 g g f f 0, 1, 2, 3 g g f f 7, 8 g, f 0, 1, 2, 3 g, f 6 g, f 9 g, f 4, 5 g, f 3, 4 g g ff 6 g, f 0, 1, 2, 3 g f 5 g, f 4 g, f 7, 8, 9 g g ff 7, 8, 9 g, f 2, 3, 4 g, f 0, 1, 2, 3 g f 5 g, f 4, 6 g g
Table 3: Cliques detected for 10 Node graph with = 10. Generation Fitness # of Snodes List of Candidate Maximal Cliques 0 675 15 ff 0, 1, 2, 3 g, f 5 g, f 6 g g 100 750 137 ff 9 g, f 0, 1, 2, 3 g f 4, 5 g, f 7 g g 200 1125 233 ff 4, 5 g, f 0, 1, 2, 3 g f 8, 9 g, f 6, 7 g, f 3, 4 g f 2, 4 g, f 7, 8 g g 300 1300 267 ff 2, 3, 4 g, f 4, 5 g f 8, 9 g, f 7, 9 g, f 4, 6 g f 6, 7 g, f 0, 1, 2, 3 g, f 7, 8 g g 400 1300 267 ff 4, 6 g, f 7, 9 g, f 6, 7 g f 2, 3, 4 g, f 7, 8 g f 0, 1, 2, 3 g, f 8, 9 g, f 4, 5 g g
Table 4: Cliques detected for 10 Node graph with = 5. [3] R. Chandraasekharam, S. Subhramanian, and S. Chaudhury. Genetic algorithm for node partioning problem and applications in VLSI design. IEE Proceedings, Part E: Computers and Digital Techniques, 140(5):255{260, Sep 1993. [4] Lawrence Davis, editor. Handbook of genetic algorithms. Van Nostrand Reinhold, New York, NY, 1991. [5] Anthony Hunter Dixon. On the E�ciency of Clique Detection in Graphs. PhD thesis, The University of British Columbia (Canada), 1973. [6] Thomas Haynes. Clique detection via genetic programming. Technical Report UTULSAMCS-95-02, The University of Tulsa, April 24, 1995. [7] Thomas Haynes, Roger Wainwright, Sandip Sen, and Dale Schoenefeld. Strongly typed genetic programming in evolving cooperation strategies. In Larry Eshelman, editor, 9
Proceedings of the Sixth International Conference on Genetic Algorithms, pages 271{ 278, San Francisco, CA, 1995. Morgan Kaufmann Publishers, Inc.
[8] John H. Holland. Adpatation in Natural and Arti cial Systems. University of Michigan Press, Ann Arbor, MI, 1975. [9] Kenneth E. Kinnear, Jr., editor. Advances in Genetic Programming. MIT Press, Cambridge, MA, 1994. [10] John R. Koza. Genetic Programming: On the Programming of Computers by Means of Natural Selection. MIT Press, 1992. [11] John R. Koza. Genetic Programming II, Automatic Discovery of Reusable Programs. MIT Press, 1994. [12] Thomas Lengauer. Combinatorial Algorithms for Integrated Circuit Layout. Wiley, 1990. [13] Ammanamanchi Srinivasa Murthy, Guturu Parthasarthy, and V. U. K. Sastry. Clique nding { a genetic approach. In Proceedings of the First IEEE Conference on Evolutionary Computation, pages 18{21, Piscataway, NJ, 1995. IEEE. [14] DIMACS Repository. dimacs.rutgers.edu. ftp://dimacs.rutgers.edu/pub/challenge/graph/doc/ccformat.dvi. [15] David Lindsay Springer. Coloring and Clique Partitioning for Data Path Allocation. PhD thesis, Carnegie{Mellon University, Sep 1991. [16] N. Sriram. Clique Optimization: An Approach to Parsimonious, Near{Optimal Ultrmetric Hierarchies. PhD thesis, University of Oregon, Sep 1990.
10