International Journal of Database Management Systems ( IJDMS ), Vol.3, No.1, February 2011
Clustering Moving Objects Using Segments Slopes Omnia Ossama, Hoda M. O. Mokhtar, Mohamed E. El-Sharkawi Faculty of Computers and Information Cairo University Cairo, Egypt
[email protected] [email protected] [email protected]
ABSTRACT Given a set of moving object trajectories, we show how to cluster them using k-means clustering approach. Our proposed clustering algorithm is competitive with the k-means clustering because it specifies the value of “k” based on the segment’s slope of the moving object trajectories. The advantage of this approach is that it overcomes the known drawbacks of the k-means algorithm, namely, the dependence on the number of clusters (k), and the dependence on the initial choice of the clusters’ centroids, and it uses segment’s slope as a heuristic to determine the different number of clusters for the k-means algorithm. In addition, we use the standard quality measure (silhouette coefficient) in order to measure the efficiency of our proposed approach. Finally, we present experimental results on both real and synthetic data that show the performance and accuracy of our proposed technique.
KEYWORDS
Moving Object Database (MOD), clustering moving objects, and k-means clustering
algorithm.
1 Introduction Over the last century, number of cars engaged in vehicular traffic has increased rapidly. Moreover, the fast advances in wireless and positioning technologies lead to flood of location information. Hence, motivated by the fact that moving object data sets are usually huge in volume and complex in structure, efficient data mining algorithms are thus required in order to extract useful and relevant information, and uncover regularities and patterns from this massive movement data sets. Clustering moving object trajectory data is an appealing research direction to fulfill the needs of many applications. Clustering is an unsupervised learning method for intelligent data analysis [7]. It is the division of data into groups of similar objects. Each group known as a cluster, consists of objects that are similar between themselves and dissimilar to objects of other groups. In the context of moving object databases, clustering moving object trajectories aims at grouping moving objects that show similar motion behavior into the same cluster. In this paper we propose a clustering technique for moving objects that employs the famous kmeans clustering algorithm [12]. Our proposed approach works on three steps; preprocessing step, clustering step, and analysis step. In brief, in the preprocessing step, the moving object database (MOD) is reconstructed to represent new features in the data set by evaluating the motion slope(s) of each object. Then, we select distinct sets of similar patterns and consider them as the input for the clustering step. Then, in the clustering step we exploit the k-means algorithm. We use the output of the preprocessing step which is the number of dissimilar DOI: 10.5121/ijdms.2011.3103
35
International Journal of Database Management Systems ( IJDMS ), Vol.3, No.1, February 2011
movement patterns to be the number of clusters for the k-means algorithm. In addition, inspired by the effect of initial centroid choice on the clustering quality and its impact in creating dead clusters (i.e. empty clusters); we evaluate initial centroids based on trajectories’ dissimilarities. We initialize each of the k clusters by a virtual segment; its coordinates is the average position of all segments of trajectories that belong to this cluster (pattern), and its slope is the slope of the majority of the segments in the cluster. Finally, in the analysis step we measure the quality of the resulting clustering, so we use the silhouette coefficient [9]. The silhouette coefficient is a measure for the clustering quality that is rather independent of the number of clusters k. Unfortunately, computing the silhouette coefficient for one cluster takes quadratic time, which is not feasible for large datasets. Nevertheless, we adjusted the silhouette coefficient calculation to be computed in acceptable running time. Clustering moving objects is motivated by several real application needs, including Highway Capacity Manual (HCM) 2010 project [1] that aims to enhance the guidance in the Highway Capacity; this project focuses on concepts, guidelines, and computational procedures for computing the capacity and quality of service of various highway facilities, including freeways, highways, traffic simulation, and analysis. The user can order this system and check free routes or ask for suggestions for alternative routes to reach certain destination. Moreover, thousands of animal movement data are available but there are no tools to save or compare these. Some new real applications provide some facilitates and long-term comparisons of these data, for example it can address the effects of global climate change and human-caused landscape changes onanimal migration or animal movement. The rest of the paper is structured as follows: Section2 presents a literature survey of key related work. Section 3 defines the problem and presents our technical definitions. Section 4 presents our proposed clustering algorithm. Section 5 shows our experimental results. Finally, section 6 concludes the paper and proposes directions for future work.
2 RelatedWork There has been considerable research in the area of mining spatial and spatio-temporal data [17, 10, 5, 13, 3, 18]. Clustering analysis has become an attractive research area and many successful approaches have been proposed. The generic definition of clustering is usually redefined depending on the type of data to be clustered and the clustering objective. Authors in [3] proposed a technique to seed the initial centers for k-means. Their idea is based on the intuition of spreading the k initial cluster centers away from each other, the first cluster center is chosen uniformly at random from the data points that are being clustered, after which each subsequent cluster center is chosen from the remaining data points with probability proportional to its distance squared to the point’s closest cluster center. There is another clustering algorithms based on regression mixture model. Authors in [6], use the Expectation Maximization algorithm (EMalgorithm) [14] to determine the cluster memberships. Another interesting approach that detects periodic patterns is proposed in [13]. In this paper, the authors assumed that the trajectories are given as a sequence of spatial regions, for example ABC would denote that the trajectory that started at region A and then moved to region C via region B. Using this model data mining tools and basically association rule mining was used. In [15] the authors proposed a clustering technique that is based on the spatial quadrants visited by the trajectory’s segments. In the paper the authors assign an orientation value for each segment in the trajectory (i.e. north, south, east, west, north-east, northwest, south-east, south-west), then based on this assignment segments are clustered using k-means technique. Our proposed approach is similar to the approach proposed in [15] however our technique uses a more rigid 36
International Journal of Database Management Systems ( IJDMS ), Vol.3, No.1, February 2011
measure namely, the segment slope value, rather than using just the direction. Using the exact slope angle provides better accuracy for determining the initial number of clusters, as well as better clustering results. In general, huge potential of analyzing movement in spatio-temporal data has recently attracted the interest of many researchers.
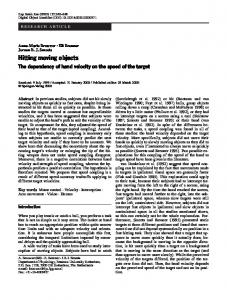
3 Problem Definition In this paper we focus on clustering moving objects trajectories. The aim of this work is to present an efficient moving object trajectory clustering algorithm along with constructing an efficient mechanism for computing the optimal number of clusters for the k-means clustering algorithm and properly initializing clusters’ centroids. We measure trajectory similarity using two filters to ensure the accuracy and quality of resulting clusters. The first filter sorts the segments of different trajectories among clusters based on segments’ slope; we represent the slope of segment by its angular measure. The second filter refines the cluster members through applying the Euclidean distance [8] to measure the deviation between each new cluster member candidate and the current cluster centroid. If the deviation (distance measure) exceeds certain threshold then a new cluster with same segment is generated. A trajectory of a moving object is typically modeled as a sequence of consecutive locations in a multidimensional Euclidean space (usually 2-dimensional space with time treated as a third dimension). In other words, a trajectory is piece wise linear function of time. The main characteristic in our model is that we focus on an important feature of a trajectory, namely, the slope of each trajectory segment. We define a segments’ slope using segment angular value Ө. Ө is a value between [0; 360], so each segment belongs to one of the following four quadrants: Q1[0; 90[; Q2]90; 180[; Q3]180; 270[; Q4]270; 360] as modeled in Figure 1. For simplicity we assume each segment passes through a single quadrant so we calculate the quadrant value once for each segment. A segment angular measure Ө is measured as below:
Figure 1: Angle Domain. 37
International Journal of Database Management Systems ( IJDMS ), Vol.3, No.1, February 2011
Having a model for moving object trajectories, in the following discussion we elaborate our notion of clustering moving object trajectories. As known clustering is simply a grouping of similar entities. In this paper we refer to a cluster as a set of similar trajectory segments such that in-cluster segments are both spatially close to each other according to a distance measure and share the same movement pattern (in terms of slope). To create clusters, simply a trajectory is partitioned into its composing segments, then clustering is applied over those segments. Thus, a single trajectory can belong to multiple clusters based on its segments’ clusters. Having cluster members to be trajectory segments, the cluster centroid is consequently a segment as well.
38
International Journal of Database Management Systems ( IJDMS ), Vol.3, No.1, February 2011
The remainder of the paper presents the proposed framework that employs the kmeansclustering algorithm to group similar trajectory segments. Our goal is to present a novel approach to enhance trajectory clustering using the k-means algorithm through optimally choosing the initial number of clusters.
4 Proposed Clustering Algorithm Clustering is a key data mining task that aims to partition a given set of objects into groups (classes or clusters) such that objects within a cluster would have high degree of similarity to each other and low similarity to objects in other clusters [16]. In this paper, we propose a framework for clustering moving object trajectories. The proposed approach is based on the widely used k-means clustering algorithm. As the k-means algorithm seeks to minimize the average squared distance between points in the same cluster, our technique also seeks to group trajectories featuring similar motion pattern. However, in our technique we aim to overcome a major drawback of the k-means algorithm namely the assumption that number of clusters and initial clusters’ centroids are given. This assumption is a crucial input for the k-means algorithm that affects both the algorithm performance and accuracy. Besides, proper cluster initialization is a major step to avoid the occurrence of dead centroids. Dead centroid problem is usually a consequence of poor cluster initialization that results in empty clusters being generated. To overcome the above problems we use a heuristic to choose the number of clusters. The heuristic employed is based on the different motion patterns of the trajectories’ segments in the data set. Next, we initialize each cluster with a virtual trajectory segment that we generate such that its slope is the average of the cluster’s segments slope, and its spatial position is the average of the cluster’s segments. The proposed approach is composed of 3 steps; Preprocessing; clustering and analysis that we discuss in more details in the remainder of this section. 39
International Journal of Database Management Systems ( IJDMS ), Vol.3, No.1, February 2011
1. Preprocessing Step: This phase is basically a pre-processing phase that is performed on the whole data set to discover the different motions patterns appearing in the data set and thus initializing a corresponding number of clusters. The moving object database (MOD) is thus rearranged. More specifically, the angle of each segment in MOD is evaluated. In this phase we first decompose each trajectory in the moving object database (MOD) into its constituting segments, and represent the trajectory as an ordered list of those segments. Next, we compute the angle of each segment using Equation 1. The output of this step is a list of pairs associating each segment to its slope angle. After computing the angle value of each segment; we count the number of distinct values of segments’ slope in terms of segments’ angle traveled by the trajectory data set. We use this number as a heuristic initialization for the number of clusters in our algorithm. Algorithm 1 shows how to measure distinct dissimilar angles value with a deviation tolerance value __ that we specify based on the distribution in the dataset. In our proposed algorithm, two angles are considered similar, if they have an absolute deviation of _ degrees or less within the same quadrant.
2. Clustering Step (k-means): Here, k-means clustering method is exploited. Having an initial number of clusters from the previous step, we now apply another similarity measure to refine our cluster members. This step will thus increase the accuracy obtained from our algorithm. In this refinement stage we start adding segments to corresponding clusters based on the segment’s angle value Ө. We construct a cluster centroid as a virtual segment with the same spatial orientation as the cluster orientation, and spatial position being the average of the cluster members so far. As we insert new segments to cluster we perform 2 steps 40
International Journal of Database Management Systems ( IJDMS ), Vol.3, No.1, February 2011
a) Compute the Euclidean distance between the cluster centroid and the new segment, and the difference between the two segments’ angles using Algorithm1. Based on the resulting value the segment is either inserted into the cluster, or is tested against other existing clusters, or generates a new cluster with the new segment as the initial centroid. b) The centroid of the cluster to which the segment is inserted is recalculated to take the new segment position into account. The new centroid is thus a virtual segment with same orientation as other segments in the cluster, and its position is the average of the spatial positions of the remaining cluster members. The details of the algorithms developed in this phase are illustrated in Figure 3 and Figure 4. The details of the algorithms developed in this phase are illustrated in Figure 3 and Figure 4.
3. Analysis Step: In this final step we analyze the accuracy of the resulting clustering. We employ the silhouette coefficient [9] as a measure for the clustering quality in order to measure the clustering quality independent from the features used for clustering and the number of clusters. To evaluate the quality of a clustering we compute the average silhouette coefficient of all segments in each cluster. The silhouette coefficient of a segment si is computed as follows: First, we compute the average distance of si to the segments in the same cluster, let ai denote this distance. Then, for each cluster C that does not contain si we compute the average distance from si to all segments in C. Let bi denotes the minimum 41
International Journal of Database Management Systems ( IJDMS ), Vol.3, No.1, February 2011
average distance to these clusters. Then the silhouette coefficient of si is defined as:
Although the silhouette coefficient provides a reliable quality measure, unfortunately calculating the silhouette coefficient takes quadratic clustering time. Thus, we adjusted the silhouette coefficient calculation to be done in acceptable running time by evaluating silhouette coefficient based on the distance to cluster centroid instead of all segments in cluster. This simplification in the computation is still acceptable as the cluster centroid is a segment the we generated to represent the average of all other segments in the cluster. Hence, the segment to centroid distance is a fair representative for the distance between the segment and other clusters’ members.
42
International Journal of Database Management Systems ( IJDMS ), Vol.3, No.1, February 2011
The value of the silhouette coefficient of a segment varies between -1 and +1. A value near -1 indicates that the segment is clustered badly. A value near +1 indicates that the segment is well-clustered. Using the simplified computation procedure, the time for computing the silhouette coefficient is tremendously reduced.
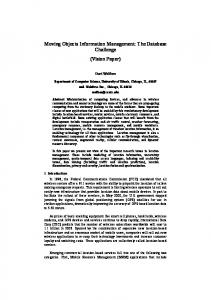
5 Experimental Evaluation In this section we proceed to present results of empirical studies of the proposed approaches. We first introduce the experimental settings and study the properties of the proposed approaches. Then we examine both the performance and accuracy of the proposed algorithm. We conducted our experiments on both real and synthetic data sets. We used a real data set [2] that represents the movement of 1100 moving object in London during a one month period (July 2007) with a 10 sec sampling rate. However, since the data set is relatively small (1100 trajectories and 94098 segments) we conducted our performance experiments using synthetic data set generated by the Brinkoff generator that is commonly used for generating realistic moving objects [4]. Using the generator, we simulated two dimensional trajectories of vehicles on the road network in the city of San Francisco. We measure the performance in terms of query processing time, and since all test datasets fit into memory, no index structure is being considered. All experiments are conducted on a 2:0 GHz with 4 Gbyte of main memory. In the first experiment; using a data set of 100000 trajectory we evaluate the effect of varying the value of deviation between similar segments’ angels (to match segments’ slope) across clustering running time. We changed the angular tolerance from 5 to 15 degrees. The increase in the deviation lead to a decrease in the number of clusters (k) because it allows more objects 43
International Journal of Database Management Systems ( IJDMS ), Vol.3, No.1, February 2011
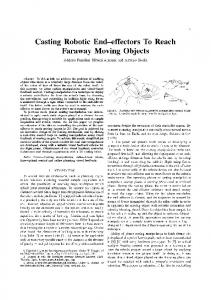
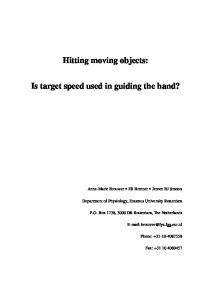
to be grouped together. Consequently it takes lower running time as shown in Figure 5 because of updating virtual centroid to consider new candidates takes lower time than searching for new centroid by checking all cluster’s segments. The second experiment studies the effect of changing the angular tolerance (which controls the number of generated clusters k) on the number of dead centroids. The goal of this experiment is to measure the quality of resulting clusters from our segment k-means approach using silhouette coefficient and ensure that our approach for choosing k and the initial centroids overcomes the problem of dead centroid. Figure 6 shows that our proposed clustering algorithm (segment k-means) creates zero dead centroid in both synthetic and real data set with different values of k in contrast with k-means that randomly initialize centroids, it creates empty clusters. Finally, segment k-means shows positive silhouette values and does not create empty clusters due to the proper initialization of centroids and properly choosing k based on data set properties (number of dissimilar patterns) as shown in Figure 7, however the k-means algorithm shows negative values for the silhouette coefficient due to the random initialization of k. Finally, to prove the advantage of our segment k-means algorithm, we compare the running time of our algorithm against the micro-clustering k-means algorithm [11]. In [11] the authors developed a small experiment of 3000 moving points or micro-clusters. Thus, we prepared a small dataset of 40 trajectory with 3000 segments from MOD in order to have the same parameters. Figure 8 shows how the segment k-means outper-
Figure 5: Angular tolerance vs. Running time.
44
International Journal of Database Management Systems ( IJDMS ), Vol.3, No.1, February 2011
Figure 6: Accuracy of segment k-means vs. k-means.
Figure 7: Average silhouette coefficient of segment k-means algorithm
Figure 8: Run time comparison. forms the micro-clustering algorithm for this dataset due to the use of virtual segment as a representative for cluster’s members which saves time on each iteration. Next, we varied the number of moving points; the effect of this change is illustrated in Figure 8.
45
International Journal of Database Management Systems ( IJDMS ), Vol.3, No.1, February 2011
6 Conclusions and Future Work In this paper we propose a pattern-based clustering algorithm that adapts the k-means algorithm for trajectory data. Segment k-means approach overcomes the known drawbacks of the kmeans algorithm, namely, the dependence on the number of clusters (k), and the dependence on the initial choice of the clusters’ centroids. Moreover, our approach guarantees creating high accurate clusters. We measured accuracy of our approaches using silhouette coefficient. For future work, we believe that further improvements in the heuristic that we use to compute k and the similarity distance which have been used for clustering are still applicable. In addition to comparison with other trajectory clustering algorithms. Besides, research on clustering moving objects is still an open direction.
References [1] http://trc.ce.ufl.edu, July 2010. [2] http://www.ecourier.co.uk, June 2010. [3] David Arthur and Sergei Vassilvitskii. k-means++: the advantages of careful seeding. In SODA ’07: Proceedings of the eighteenth annual ACM-SIAM sym- posium on Discrete algorithms, pages 1027–1035, Philadelphia, PA, USA, 2007. Society for Industrial and Applied Mathematics. [4] T. Brinkhoff. Generating traffic data. IEEE Computer Society Technical Committee on Data Engineering, pages 19–25, 2003. [5] Zhouyu Fu, Weiming Hu, and Tieniu Tan. Similarity based vehicle trajectory clustering and anomaly detection. In IEEE International Conference on Image Processing, 2005. ICIP 2005., volume 2, pages II–602–5, Sept. 2005. [6] Scott Gaffney and Padhraic Smyth. Trajectory clustering with mixtures of regression models. In KDD ’99: Proceedings of the fifth ACM SIGKDD international conference on Knowledge discovery and data mining, pages 63–72, New York, NY, USA, 1999. ACM. [7] Jiawei Han and Micheline Kamber. Data Mining: Concepts and Techniques. Morgan Kaufmann, 1st edition, September 2000. [8] J. Juan-chico, M. J. Bellido, A. J. Acosta, and A. Barriga. Efficient similarity search in sequence databases. In Foundations of Data Organization and Algorithms, pages 69–84. Springer, 1993. [9] L. Kaufman and P Rousseeuw, editors. Finding Groups in Data: An Introduction to Cluster Analysis. Wiley, New York, 1990.
46
International Journal of Database Management Systems ( IJDMS ), Vol.3, No.1, February 2011
[10] Krzysztof Koperski, Junas Adhikary, and Jiawei Han. Spatial data mining: Progress and challenges. In SIGMOD Workshop on Research Issues on Data Mining and Knowledge Discovery(DMKD), pages 1–10, 1996. [11] Yifan Li, Jiawei Han, and Jiong Yang. Clustering moving objects. In KDD ’04: Proceedings of the tenth ACM SIGKDD international conference on Knowledge discovery and data mining, pages 617–622, New York, NY, USA, 2004. ACM. [12] J. B. Macqueen. Some methods of classification and analysis of multivariate observations. Proceedings of the Fifth Berkeley Symposium on Mathematical Statistics and Probability, pages 281–297, 1967. [13] Nikos Mamoulis, Huiping Cao, George Kollios, Marios Hadjieleftheriou, Yufei Tao, and DavidW. Cheung. Mining, indexing, and querying historical spatiotemporal data. In KDD ’04: Proceedings of the tenth ACM SIGKDD international conference on Knowledge discovery and data mining, pages 236–245, New York, NY, USA, 2004. ACM. [14] G.J. McLachlan and T. Krishnan. The EM algorithm and extensions. In Applied Probability and Statistics Section, 1997. [15] Omnia Ossama, Hoda M. O. Mokhtar, and Mohamed E. El-Sharkawi. An extended k-means technique for clustering moving object trajectories. Egyptian Informatics Journal, Accepted for Publication, 2011. [16] Gabriela Serban Sofia Moldovan. Aspect mining using a vectorspace model based clustering approach. In AOSD ’06: Aspect-Oriented Software Development Conference, Bonn, Germany, 2006. [17] Animesh Tripathy and Prashanta Kumar Patra. An intelligent approach for mining frequent spatial objects in geographic information system. International Journal of Database Management Systems ( IJDMS ), 2(4), 2010. [18] Man Lung Yiu and Nikos Mamoulis. Clustering objects on a spatial network. In SIGMOD ’04: Proceedings of the 2004 ACM SIGMOD international conference on Management of data, pages 443–454, New York, NY, USA, 2004. ACM.
7 Authors Omnia Ossama is currently working as a Developer Support Engineer at Microsoft Regional Developer Support Center, Egypt. Omnia is enrolled in a master program on Data Mining at Cairo University, Faculty of Computers and Information. Thesis title ”Mining Moving Objects Databases”. She received her BSc in 2007 from the Information System Dept., Faculty of Computers and Information - Cairo University.
47
International Journal of Database Management Systems ( IJDMS ), Vol.3, No.1, February 2011
Dr. Hoda M. O. Mokhtar is currently an assistant professor in the Information Systems Dept., Faculty of Computers and Information, Cairo University. Dr. Hoda Mokhtar received her PhD in Computer science in 2005 from University of California Santa Barbara. She received her MSc. and BSc. in 2000 and 1997 resp. from the Computer Engineering Dept., Faculty of Engineering - Cairo University. Her research interests are database systems, moving object databases, data warehousing, and data mining. Dr. Mohamed Ezzedin El-Sharkawi is currently an associate professor and head of Dept. of Information Systems, Faculty of Computers and Information, Cairo University. Dr. Mohamed received his Doctor of Engineering and Master of Engineering in 1991 and 1988 resp. in Computer Science and Communication Engineering from the Faculty of Engineering, Kyushu University, Fukuoka, Japan. He received his BSc. in Systems and Computer Engineering from the Faculty of Engineering, Al-Azhar University, Cairo, Egypt in 1981. His research interests are database systems, query processing and optimization, social networks, and data mining.
48