Computer Graphics Instruction in VizClass DOUGLAS GRIMES, MARK WARSCHAUER, TARA HUTCHINSON, AND FALKO KUESTER University of California, Irvine ________________________________________________________________________________ VizClass is a university classroom environment designed to offer students in computer graphics and engineering courses up-to-date visualization technologies. Three digital whiteboards and a three-dimensional stereoscopic display provide complementary display surfaces. Input devices include touchscreens on the digital whiteboards, remote keyboards, data gloves, and hand-position sensors. We use observations, interviews, and surveys to examine the pedagogical impacts of VizClass for teaching and learning computer graphics and virtual reality. Preliminary findings include positive student and teacher attitudes and greater learner engagement in after-class collaborations. Categories and Subject Descriptors: H.5 [Information Systems]: Information Interfaces and Presentation; K.3.2 [Computers and Education]: Computer and Information Science Education--Self-assessment; K.3.1 [Computers and Education]: Computer Uses in Education--Collaborative learning General Terms: Human Factors Additional Key Words and Phrases: VizClass, graphics programming, visualization classroom, visualization environment, engagement __________________________________________________________________________________________
INTRODUCTION Intense competition in the video display industry and a flourishing video research community are testimony to a widespread belief that user experience improves with graphics quality, but students in computer graphics and virtual reality (VR) classes rarely have access to cutting-edge computer displays and input devices. Widespread recognition of the technology gap between pedagogy and practice has led to at least three major projects to develop enhanced visual environments [Hutchinson and Kuester 2004]. However, visualization tools alone are unlikely to be fruitful without student engagement in problem-solving [Hundhausen et al. 2002; Naps et al. 2002; Smith et al. 2005]. VizClass is a National Science Foundation-funded project at the University of California, Irvine, to develop a visualization classroom environment for computer graphics and engineering education [Hutchinson and Kuester 2004]. The primary display devices in the main VizClass classroom are three 2D interactive digital white boards (SmartBoards™) and a semi-immersive stereoscopic 3D wall display (Figure 1). An 8node PC cluster runs specially designed middleware called VizION that facilitates network management [Groenveld et al. 2004]. Specialized gesture-sensing input devices include data gloves and a magnetic position tracker called Nest of Birds (both described in Ekvall and Kragic [2004]) __________________________________________________________________________________________ This project was funded by the National Science Foundation Combined Research Curriculum Development program under grant EIA-0203528, Matching resources are provided by the California Institute for Telecommunications and Information Technology; the Henry Samueli School of Engineering at the University of California, Irvine (UCI); and Research and Graduate Studies at UCI. Permission to make digital/hard copy of part of this work for personal or classroom use is granted without fee provided that the copies are not made or distributed for profit or commercial advantage, the copyright notice, the title of the publication, and its date of appear, and notice is given that copying is by permission of the ACM, Inc. To copy otherwise, to republish, to post on servers, or to redistribute to lists, requires prior specific permission and/or a fee. Permission may be requested from the Publications Dept., ACM, Inc., 2 Penn Plaza, New York, NY 11201-0701, USA, fax:+1(212) 869-0481,
[email protected] © 2006 ACM 1531-4278/05/1200-ART3 $5.00. ACM Journal of Educational Resources in Computing, Vol. 5, No. 4, December 2005. Article 3.
2
●
D. Grimes et al.
A sonification server allows surround sound and ceiling-mounted cameras for motion detection. Each digital whiteboard is powered by a separate PC and has a 72-inch rearprojection display, which also functions as a touchscreen. Users interact with the touchscreen/display by simply writing with a finger or with colored digital pens. The 3D stereo display has a 10’ screen illuminated from behind by dual projectors and controlled by a wireless keyboard. Each of the displays can also be controlled with a wireless keyboard and trackball. The digital whiteboards have a resolution of 1024 x 768. The refresh rate is 60 Hz, beyond the perception threshold of the human eye, that is, animations are smooth and flicker-free. The resolution of the 3D stereo display is 1280x1024. One projector is used per eye; data for both eyes is displayed concurrently via linear polarization @ 60 Hz. Polarized glasses are needed for optimal depth perception. Office chairs and folding tables are typically arranged in two rows of three tables and six chairs. With comfortable seating for only twelve students, the classroom is well suited for seminars and lab sessions, but too small for lecture courses. BACKGROUND Technologies Two types of closely related studies frame our research: (1) studies of multiple large-display visualization environments; and (2) studies of the educational value of graphics technologies. Studies in the first category employ multiple digital whiteboards or other large, leading-edge displays, often with novel input devices such as networked, handheld computers or gesture-recognition devices. The most extensive research in this category
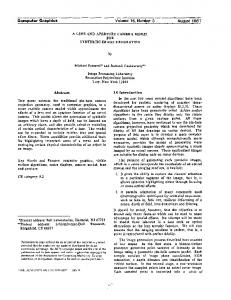
Fig. 1. VizClass displays showing two medical applications from MRI images. A rendering of the corpus callosum is on the 6-by-8-foot semi-immersive 3D stereoscopic display on the left, and two views of a head on the digital whiteboards on the right. The programmer holds a remote keyboard with trackball in the middle. ACM Journal of Educational Resources in Computing, Vol. 5, No. 4, December 2005.
Computer Graphics Instruction in VizCLass
●
3
Fig.2. Three digital whiteboards in VizClass showing complementary displays. The left screen displays hard tissue; the middle screen soft tissue from a different angle. The right screen displays the transfer functions and other controls. The instructor draws on the middle screen with one of the four colored styluses.
has been at Xerox PARC (e.g., the Tivoli system of Pedersen et al. [1993] and the Interactive Workspaces Project at Stanford. (iWork and iRoom [Johanson et al. 2002]). Other examples are Rekimoto’s multiple display system at Sony [Rekimoto 1998], Office of the Future at the University of North Carolina [Bishop and Welch 2000], and BEACH at Darmstadt [Tandler 2000]. With the exception of some of the many iWork articles, most articles in this category focus on design (hardware, software, and physical space) rather than use; they also target office spaces, not classrooms. Studies in the second category use conventional display hardware and focus on a particular domain of visualization software, such as graphical representations of computer science algorithms (for overviews see Green and Petre [1996] and Hundhausen et al. [2002]). Among the few studies that address both categories (classroom use of multiple largescreen visualization tools) are ActiveClass at the University of California in San Diego [Barkhuus and Dourish 2004; Ratto et al. 2003] and eClass at the Georgia Institute of Technology [Brotherton 2002; Brotherton and Abowd 2004]. ActiveClass, eClass, and VizClass embody three distinctly different approaches to visualization in the classroom. eClass uses a 60-inch SmartBoard, similar to the three in VizClass, to capture an instructor’s classroom slides and annotations for later display on the Web. The purpose is to relieve students of the need for detailed note-taking during class by providing annotated slides and audio and video streams immediately after class. In VizClass, however, the instructor viewed note-taking as a means of engaging students during class; he also felt that downloadable notes might discourage attendance. Furthermore, students expressed only a moderate desire to download class notes; they were much more interested in using the large displays for presenting and exploring their own and their peers’ software. ActiveClass allows students, instructors, and teaching aids to communicate during class via wireless handheld computers. The intent is to increase student participation in lectures by asking questions, answering polls, and giving the instructors feedback during class. A group of undergraduates developed a much simpler system with a similar purpose in VizClass, one that uses wireless notebook computers instead of handhelds; it is a minor sideline, however, and has not yet been used in class. ACM Journal of Educational Resources in Computing, Vol. 5, No. 4, December 2005.
4
●
D. Grimes et al.
eClass and ActiveClass are intended for large classes. The primary VizClass classroom is small. The large displays are actively programmed by students, not just passively viewed by them in lectures. The graphics tools are intended to promote students’ exploration of sophisticated visualization techniques that are difficult or impossible with conventional PCs or laptops. Educational Principles Four educational principles guide our discussion: engagement, integrated visualization, meta-cognition, and self-efficacy. Perhaps the most basic principle of instructional design is engagement, which is the degree of students’ cognitive and emotional involvement in learning [Friedman and diSessa 1999; Kearsley and Shneiderman 1998; Smith et al. 2005]. Engagement may be enhanced in various ways, such as through collaboration, application of theory to practice, and via authentic real-world problems. Integrated visualization is our term for the coordinated use of different visual skills. There is widespread agreement that there are two major types of processes in visual problem-solving, analytic and gestalt [Bodner and Guay 1997]. Analytic processing is breaking a whole into parts; gestalt (holistic) processing is treating the whole as an organized unit, more than the sum of its parts. Both are necessary in graphics programming. Design and debugging require analytic skills, whereas motivation, collaboration, and anticipation of users’ reactions require gestalt skills. Meta-cognition refers to awareness and understanding of one’s cognitive processes. Graphics programming demands a type of meta-cognition that Friedman and diSessa [1999] call “meta-representational competence”; it includes the ability “to design and critique representations, to understand how they work, and to learn to operate new representations quickly and effectively.” They argue that students exercise critical thinking when they explicitly consider how an object is mapped to an image. Self-efficacy is a perceived capability to perform a specific behavior. A large body of research indicates that self-efficacy is a strong predictor of success in a wide range of endeavors, including academic and career success [Bandura 1997]. Each of these four concepts informed our understanding of VizClass, as discussed below. Study Setting This report covers four one-quarter classes in computer graphics with a total of thirtyseven students, all of whom participated in the study (Table I). The classes were projectTable I Quarter
Title
Level
Winter 2004 Spring 2004 Winter 2005 Spring 2005
Advanced Scientific Graduate 12 Visualization Principles of Graduate 7 Virtual Reality Advanced Scientific Undergraduate 11 Visualization Principles of Graduate 7 Virtual Reality Table I: Computer Graphics classes taught in VizClass
ACM Journal of Educational Resources in Computing, Vol. 5, No. 4, December 2005.
Students
Computer Graphics Instruction in VizCLass
●
5
intensive. There were no exams and grades were based primarily on graphics programming projects. Students developed most of their project software outside of the classroom, and brought it to lab sessions and classes on their personal laptops or memory sticks for demonstration to their instructors and peers. A co-investigator of the VizClass project and co-author of this paper (Kuester) taught all four classes listed above. The principal investigator, also a co-author (Hutchinson), also taught in VizClass. Their participation as co-authors was to ensure accuracy, not to affect the educational evaluation, which was performed by co-authors from the Informatics and Education department (Grimes and Warschauer). The current authors published a separate analysis of three of Hutchinson’s classes in civil engineering using VizClass [Grimes et al. 2006]. Our two parallel VizClass studies are mutually corroborating. Methodology To investigate VizClass, we deployed a mixed-method exploratory case study focusing on people rather than technologies. Our research questions follow: • • •
How were VizClass technologies used in instruction? How did the learning process and learning outcomes change with the new visualization technologies? What were students’ and teachers’ attitudes toward the technologies?
Sources of data for the study included observations, interviews, surveys, and examination of student work. We observed each of the above-mentioned classes approximately six times, with dates selected for maximal utilization of VizClass technologies. Field notes were taken during observations, with a focus on interpersonal interactions. An interview of 10 to 40 minutes was conducted with the instructor shortly after the end of each of the above-mentioned courses. Between 2 and 12 students from each class were interviewed in either individual or small group format. Students were selected for interviews based on their willingness to participate. Student interviews lasted anywhere from 5 to 60 minutes, depending on the availability of the students and the number of participants. Interviews of the instructor and students focused on attitudes toward VizClass and perceptions of how it changed teaching and learning. All interviews were audio-recorded and transcribed. In addition to formal interviews, numerous informal conversations were held with instructors and students throughout each course, with relevant points entered into field notes. Brief student surveys were conducted at the beginning and end of each course; a more extended end-of-class survey was given to the last class. Finally, we examined student homework assignments and observed and took notes on student presentations. The qualitative data was coded for basic patterns within each class, and then a crossclass analysis of qualitative and survey data was conducted to identify broader trends of VizClass utilization and impact. FINDINGS Technology The digital whiteboards are the workhorses of VizClass. They have several advantages over video projectors: Images are sharper, and rear-projection avoids shadows and the need to dim room lights, and touchscreens promote a more conversational style of interaction than keyboard and mouse. They also have advantages over regular ACM Journal of Educational Resources in Computing, Vol. 5, No. 4, December 2005.
6
●
D. Grimes et al.
whiteboards: brighter colors, the ability to write on PowerPoint slides and other computer images, and they can save annotated documents for later access. The three adjacent digital whiteboards on one wall proved much more useful than a single one in another classroom. Even though the SmartBoards have been produced commercially since 1991, as in the introduction of almost any complex technology, there were growing pains, especially in their first year of use. For example, in one class session, the right digital whiteboard repeatedly lost its video signal. In another session, a student tried to draw on top of his PowerPoint presentation, but a window dialog box kept opening up. Hardware replication saved him; he moved to another digital whiteboard to draw his illustration. In other classes, the interface switched slides unexpectedly or abruptly erased hand-written notes. Neither the proprietary SmartBoard software nor the version of Microsoft PowerPoint used in the first year were designed for annotating slides. Hence mishaps were frequent with both of these applications when attempts were made to overlay annotations on slides. Only when the instructor discovered a third application, Classroom Presenter [Anderson et al. 2004], was he able to smoothly integrate computer-based displays with freehand annotations. Although little used for presentations by the instructor, the stereo 3D display was critical for exercises and demos in the VR course and graduate student research. Most student projects that were first developed on other Windows machines adapted easily to the 3D display. Although not in regular use, the data gloves did lead to one dramatic project. An undergraduate student connected a data glove to an IR receiver to create an intuitive interface to an animation of two galaxies on a collision course. With simple movements of his hand the galaxies rotated, accelerated, decelerated, and changed directions. Bend sensors on the fingers selected different functions, such as geometric or temporal navigation. Using the same hand movement with different finger positions gave different results. In a project that took approximately two weeks, the student created a single-hand sign language whereby stars swayed with his fingers and galaxies danced in tune with his hand. Instructor’s Reactions The new technologies helped the instructor achieve his main purpose in developing VizClass: more hands-on integration of technology with the class material. As he noted in an interview, “In the past... we could write down the equations or mathematical formulations, but it was very hard to show interactively the outcome of particular numerical models. Now [we are] able to do that in real-time.” His second purpose was to fuse different modalities, such as animations, videos, numerical models, and source code, for more intuitive interactions. Multiple displays and the ability to annotate displays contribute toward this goal. The technology and the teaching process co-evolved. The instructor said that in comparison with previous classes using computer projectors, VizClass made teaching more creative and enjoyable. In addition to the capabilities described above, it provided access to online resources, such as papers and code, and made interactive grading of project demos possible, which was “much more hands-on” than with a laptop or desktop computer. The instructor felt that passive stereo 3D display was particularly effective for teaching 3D concepts. The display projects the image for one eye for horizontal ACM Journal of Educational Resources in Computing, Vol. 5, No. 4, December 2005.
Computer Graphics Instruction in VizCLass
●
7
polarization and to the other eye for vertical polarization. The user wears glasses with polarization filters to extract the appropriate image for each eye, and the brain merges the two. This 3D display made it easier for students to experiment with 3D. The instructor stated that “working hands-on with particular data sets has been demonstrated to be quite powerful.” When asked whether the students in his virtual reality class were more excited about the course material or their projects in VizClass, the instructor responded that: “In respect to engaging students, both during lectures and lab sessions, it certainly has a tremendous impact. In the past we had to set up shutter glasses to do stereo, something many of the students had experienced in gaming environments. Now they can get their hands on equipment that is ... just too costly, and might not satisfy particular needs. It’s a more engaging environment, both with respect to working with 2D during the coding, and looking at 3D contexts, monoscopic, stereoscopic, and also interfacing with the devices. So overall I think it’s a big gain.” And he mentioned two additional benefits: “The higher quality projection equipment the students have available does indeed reveal shortcomings in particular applications, it’s much easier. And some attributes of the environment are really high-end, so you can do things you normally can’t do.” The new technologies appear to encourage collaborative and situated learning. Students presented their software projects in interactive grading sessions, which spontaneously turned into collaborative development sessions. Classmates and the instructor helped debug and refine project software on-the-fly. The interactive touchscreens promoted collective experimentation with software in development, and also stimulated discussions after class and in lab sessions. The instructor commented that: “In previous courses ... there was one student presenting. [Now] suddenly teams form ... and get things to work. That’s something which doesn’t normally happen.... There is a tremendous increase in interactivity ... different students showing their work, trying to debug it, trying to understand somebody else’s problem... whenever groups were involved, [the large displays] tremendously helped.” The digital whiteboards’ contribution to collaboration became evident when some students developed their projects on Microsoft Windows platforms and others used Apple laptops. Although the Apple developers created some of the most outstanding software, it could not be presented on the Windows-based Smartboards. The laptops used for presentation did not stimulate as much collaboration or experimentation by others as the large touchscreen digital whiteboards. When asked if the projects demonstrated improved conceptual skills or ability to think about how objects are represented graphically, the instructor responded in this way: “I think it does. Many of the projects have also shown that students have learned to think on a broader level. Rather than (thinking of) one very narrow, specific problem, they have learned to think outside the box... We had an interdisciplinary group of students.... There were different ways of looking at problems.” ACM Journal of Educational Resources in Computing, Vol. 5, No. 4, December 2005.
8
●
D. Grimes et al.
He added that collaboration among students of different backgrounds was particularly effective in helping them explore new ways of solving problems: “I think there were some very clear instances, particularly again through teamwork, where students said, “What about this?” “Have you thought about that?” Once that had started, where students were questioning each other, they started to question themselves more regularly for subsequent projects. ...Rather than doing a blind homework assignment or research problem, purely looking at the problem, they actually started to question different aspects in the neighborhood that could be relevant. That was good to see. There was more thought going into the entire process.” The instructor described two challenges. First, instructional material had to be reorganized to integrate PowerPoint, annotations, animations, and other programs. Second, backup plans were needed in case of operating system failures, application errors, and network problems, all of which occurred and were managed smoothly. Student Reactions Brotherton and Abowd note that in eClass “The most creative uses of the lecture notes by instructors have been when they encouraged their students to use the whiteboard during class.” [Brotherton and Abowd 2004, p. 149]. Our experience in VizClass corroborates this finding. Compared with eClass, students in VizClass had much greater access to the digital whiteboards because there were fewer students in a smaller space and there were three whiteboards instead of one. In addition, classes and lab sessions were designed to give students ample hands-on experience with the whiteboards. Students noted several advantages provided by the digital whiteboards, including high-resolution writing surfaces, brightly colored pens, and the means to annotate slides. Students saw “something magical” in the big displays, but at least two said the novelty wore off. One student saw beyond the technology per se to the effect it had in stimulating collaboration: “I think it’s a good way to interact with a group to solve a problem. So I think as far as group problem-solving abilities, I think it’s helpful. But, as far as an individual, you could just use paper or whatever.” In surveys and interviews, students complained about bugs in the interface software, but nevertheless managed to use it effectively. Many designed their programs to work around the difficulty in right-clicking on the remote keyboards. In his first presentation a student discovered that the remote keyboard had to be pointed directly at its digital whiteboard, which interfered with his delivery. In his next presentation the student controlled the program with the touchscreen rather than the keyboard. Direct interaction with the representation via touchscreen appeared more natural and intuitive than indirect interaction via keyboard and mouse. Using a finger or stylus to work on the touchscreen was a visible, public action, as opposed to the more private, individual action on a keyboard and mouse. Hence the digital whiteboards invited more theatrical presentations: interactions with the touchscreen made use of the presenter’s full-body language. Two students in the last VR class felt that the 3D was underexploited. Their class had three 2-hour open lab sessions per week. Several students in this class complained that lab hours did not allow sufficient hands-on time to develop their 3D presentations, yet they all managed to finish creditable examples of 3D techniques by doing most of the ACM Journal of Educational Resources in Computing, Vol. 5, No. 4, December 2005.
Computer Graphics Instruction in VizCLass
●
9
programming on their conventional personal computers, and converting them to the lab computer that controlled the 3D projector. Through small focus groups and surveys we collected students’ opinions about VizClass and its effect on learning. We categorized their open-ended qualitative answers on a scale from 1 to 5, where 1 was very negative, 3 was neutral, and 5 was very positive. As indicated in Table II, responses from self-selected students in four classes were consistently positive. Although some students complained about glitches in the wrapper software for the PowerPoint and drawing programs, there were no negative responses toward the main technologies. On the whole, students expressed positive opinions of VizClass (ave = 4.2), and said it enhanced their ability to grasp course materials (ave = 4.1). They particularly liked the ability to annotate slides, and the use of multiple boards to give ample display area and to run different programs in parallel. Students expressed moderately positive approval overall in response to questions on whether VizClass increased their excitement about course materials, interest in research, ability to visualize problems, and confidence in their ability to solve graphics programming issues. Students in the Spring 2005 virtual reality course also answered survey questions specific to the digital whiteboards and the 3D stereo display. They clearly enjoyed both technologies, and felt that the 3D display was particularly effective for enhancing visualization and that the digital whiteboards were very useful for improving interactions among the students and their instructor. Although the students’ self-assessments do not directly indicate increased learning, they do indicate heightened self-efficacy, which often serves as a strong predictor of other measures of successful learning [Bandura 1997]. An assignment on force fields illustrates the students’ synthesis of analytic and gestalt processing. One student developed an astrophysics application for particle traces. Particles traveled from a source to a sink, obeying laws of momentum and force (attraction and repulsion). One window showed a graceful particle stream in 3D, while two other windows showed 2D slices of the 3D image. The student and instructor shared control of the program via the digital whiteboard touchscreen; the program became an integral part of their conversational flow. Table II. Student Reactions to VizClass Technologies (1 = very negative, 2 = slightly negative, 3 = neutral, 4 = slightly positive, 5 = very positive) Question Average Std. Dev. Opinion of VizClass 4.2 0.5 Ability to grasp course materials 4.1 0.4 Excitement about course materials 3.7 0.5 Interest in research 3.9 0.5 Ability to visualize problems 3.6 0.5 Confidence in ability to solve graphics problems 3.5 0.5
N 20 20 23 22 18 17
Self-selected students in four classes answered the questions above. In two classes in the 2003-2004 school year, answers were collected in focus groups of two to four students each. In two classes in the subsequent school year, answers were collected with survey forms. The average response differed from the norm of 3 (neutral) at a 99% confidence level (t-test, p < .01) for all six questions above. ACM Journal of Educational Resources in Computing, Vol. 5, No. 4, December 2005.
10
●
D. Grimes et al.
A second student’s force field program projected graceful rainbow-colored patterns fanning out from sources to sinks. A third student’s program created a big elliptoid fountain. In all of these, the technology afforded an enriched palette of communication modes – words, multiperspective displays, and gestures (body language and touchscreen input). The technology was not just a focal point of the conversation; it became a dynamic participant in the conjoint flow of words and images. As with most of the more successful projects and exercises in the graduate-level classes, students and instructors played with the animation settings like artists immersed in creative play. The author of the preceding project said he felt 3D was much more aesthetic and fun than 2D, a view echoed by several classmates. The last VR class had a mix of majors -- ACE (arts, computation, and engineering) and EECS (electrical engineering and computer science). The sense of aesthetic play was evident in both groups, especially when modeling physical laws in 3D animations. Two students said that programming for the stereo 3D projectors was particularly effective for developing their visualization skills because they had to integrate binocular views, allowing for the angle between two eyes or two cameras. It also required basic knowledge of optics, visual perception, and display buffering techniques. One student said the exercises with the different technologies, such as quad buffering, anaglyphs, and movie clips, cumulatively developed her visualization skills. The students’ ability to articulate such observations testifies to a growth in metarepresentational competence, as well as another metacognitive skill – learning how one learns. Overall Impact Parallel use of multiple digital whiteboards saved time during demos. In one demo session, one student debugged his code on one board; another demonstrated his program to his instructor on a second board; and a third student loaded his program on the third board. The informal atmosphere, and the availability of peers and an instructor to debug, also appeared to ameliorate evaluation stress. Projects prepared on Windows usually ran without problems on the PCs that drove the digital whiteboards, but programs prepared on Macintoshes generally did not run without modification. Such cases, where students were limited to showing their programs on Apple laptops, highlighted the difference between laptops and digital whiteboards as collaborative tools. When students demonstrated their programs on laptops, the level of interactivity dropped. Larger displays and shared touchscreens appear to invite whole-body participation and more relaxed, egalitarian project-sharing with more participants. In contrast, Laptop control was limited to the hands of the person at the keyboard. As the instructor noted: “Having two or three students, and an instructor at times, hanging around one (digital) whiteboard, trying to analyze code, trying to figure out what didn’t work, was certainly much more natural than it would have been in front of a small 17- or 19-inch display.” Our observations confirm “the strong appeal of direct hands-on manipulation without implements” noted by Ringel and colleagues. As they wrote, “users gravitated toward performing simple interactions by touching a finger to the board.” [Ringel et al. 2001]. In the VizClass environment, human-computer interaction even varied with social skill: students with greater poise exploited large displays more effectively than socially less adept students. Whatever the motivation – to provide aesthetic enchantment, analytic intrigue, or a combination of these and other factors – collaborative experimentation emerged ACM Journal of Educational Resources in Computing, Vol. 5, No. 4, December 2005.
Computer Graphics Instruction in VizCLass
●
11
spontaneously. For example, a student created an exceptionally clear 3D image of a head from a medical data set implemented in hardware on the video board. As the head was designed as an experiment to observe the conservation of inertia, the student would drag a finger across the head, spinning it like a top. He would spin it quickly or slowly, varying opacity and other visual controls, highlighting different tissue densities such as bony structures (medium hard), fillings (very hard), or skin (soft). The student/designer and a classmate stayed after class with the instructor to explore techniques, as engineers do, and to refine visual effects, as artists do – playing with the transfer function (how inputs map to outputs), opacity, and color settings. As they explored representational options, the same data set of a head varied in appearance from a ghostly, surreal apparition to a coldly realistic tool for medical diagnosis. CONCLUSIONS Our findings generally support the value of VizClass in promoting the four educational principles introduced above. The most notable impact of VizClass was increased collaborative engagement, fostered by the three digital whiteboards and their input devices (touchscreen, wireless pens, keyboard, and mouse). Programming exercises and projects required integrated visualization; the demonstrations evinced aesthetic as well as analytic skills. Metacognitive skills, especially the ability to manage complex mappings between object and image, were vigorously exercised in scientific and VR programming. Programming for stereo 3D particularly appeared to foster more thorough understanding of how computer images relate to visual perception. Finally, students’ perceived self-efficacy in regard to their visualization and graphics programming skills increased. We propose that these preliminary results are inseparable. For example, increased engagement can be expected to augment learning in any area, and increasing self-efficacy in a field enhances interest in exploring it with others. Computer graphics programming always involves both analytic and gestalt processing, and any exposure to it can be expected to increase self-efficacy. The VizClass environment, however, appears to invite deeper immersion of students and teachers in both the analysis of program function and the gestalt appreciation of the resulting images. Hence, debugging was quicker and aesthetic experimentation more extensive than with smaller, non-touchscreen displays. Likewise, self-efficacy correlates with the level of engagement and social support, both of which reportedly increased more in VizClass than in a computer graphics class in a conventional classroom. We found similar patterns of use and similar reactions of students and professors in both our VizClass study groups, except the computer graphics students expressed slightly more positive attitudes toward the technologies than the civil engineering students. This difference may be due to the greater engagement of computer graphics students in the VizClass technologies, greater collaboration in their class projects, greater fascination with the technology, or some combination thereof. The VizClass environment is still under development, and a full investigation was hampered by several factors, including the small size of the project, the fact that the only courses in VizClass that were part of this study were taught by the project investigators, and the environment was being designed and constructed as the courses were being offered. Nevertheless, we found indications of enhanced collaboration, engagement, and self-efficacy in students, and perhaps enhanced visual conceptualization skills as well. These preliminary findings invite further study of similar visualization environments in educational settings.
ACM Journal of Educational Resources in Computing, Vol. 5, No. 4, December 2005.
12
●
D. Grimes et al.
ACKNOWLEDGMENTS We thank Mark E. Phair, Dirk Groeneveld, Vid Petrovic, and Margaret Watson. REFERENCES ANDERSON, R., WOLFMAN, S. A., ANDERSON, R., VANDEGRIFT, T., SIMON, B., AND YASUHARA, K. 2004. Experiences with a tablet pc based lecture presentation system in computer science courses. In Proceedings of the 35th SIGCSE Technical Symposium on Computer Science Education (SIGCSE '04, Norfolk, VA, March 3-7). ACM, New York, 50-56 BANDURA, A.1997. Self-Eefficacy: The Exercise of Control.Worth Publishers. BARKHUUS, L. AND DOURISH, P. 2004. Everyday encounters with context-aware computing in a campus environment. In Proceedings of the Ubicomp (Ubiquitous Computing) 2004 Conference (Nottingham, UK), 232–249. BISHOP, G. AND WELCH, G. 2000.Working in the office of "real soon now." IEEE Computer Graphics and Applications, 76-78. BODNER, G. M. AND GUAY, R. B. 1997. The Purdue visualization of rotations test. The Chemical Educator 2, 4, 1-17. BROTHERTON, J. A. 2002. Enriching everyday activities through the automated capture and access of live experiences. Eclass: Building, observing and understanding the impact of capture and access in an educational domain. Ph.D.dissertation, Dept. of Computer Science, Georgia Institute of Technology, May, 2002. BROTHERTON, J. A. AND ABOWD, G. D. 2004. Lessons learned from eclass: Assessing automated capture and access in the classroom. ACM Trans. Computer-Human Interaction 11, 2, 121–155. EKVALL, S. AND KRAGIC, D. 2004. Interactive grasp learning based on human demonstration. In Proceedings of the IEEE/RSJ International Conference on Robotics and Automation (ICRA 004), 4, 3519 - 3524. FRIEDMAN, J. S. AND DISESSA, A. A. 1999. What students should know about technology: The case of scientific visualization. J. Science Education and Technology 8, 3. GREEN, T. R. G. AND PETRE, M. 1996. Usability analysis of visual programming environments: A cognitive dimensions framework. J. Visual Languages and Computing 7, 131-174. GRIMES, D., WARSCHAUER, M., HUTCHINSON, T. C., AND KUESTER, F. 2006 Civil engineering education in a visualization environment: Experiences with vizclass. J. Engineering Education (JEE), 95, 3, 249-254 GROENEVELD, D., HUTCHINSON, T. C., AND KRUESTER, F. 2005. Flexible middleware for digital learning environments. In INNOVATIONS 2005 - World Innovations in Engineering Education and Research.Begell House Publishing, ch.21, pp.233–243. HUNDHAUSEN, C. D., DOUGLAS, S. A., AND STASKO, J. T. A. 2002. Meta-study of algorithm visualization effectiveness. J. Visual Languages and Computing. HUTCHINSON, T. C. AND KUESTER, F. 2004. Hardware architecture for a visualization classroom: Vizclass. Computer Applications in Engineering Education 12, 4, 232-241. JOHANSON, B., FOX, A., AND WINOGRAD, T. 2002. The interactive workspaces project: Experiences with ubiquitous computing rooms. Pervasive Computing, 71-78. KEARSLEY, G. AND SHNEIDERMAN, B. 1998. Engagement theory: A framework for technology-based teaching and learning. Educational Technology 38, 5, 20-23. NAPS, T. L., RÖßLING, G.., ALMSTRUM, V., DANN, W., FLEISCHER, R., AND HUNDHAUSEN, C. 2002. Exploring the role of visualization and engagement in computer science education. (Report of the working group on "improving the educational impact of algorithm visualization"). ACM SIGCSE Bull. 35, 2, 131-152. PEDERSEN, E. R., MCCALL, K., MORAN, T. P., AND HALASZ, F. G. 1993. Tivoli: An electronic whiteboard for informal workgroup meetings. In Proceedings of the InterCHI '93 Conference, 391-398. RATTO, M., SHAPIRO, R. B., TRUONG, T. M., AND GRISWOLD, W. G. 2003. The activeclass project: Experiments in encouraging classroom participation.In Computer Supported Cooperative Learning (CSCL), 101-110. REKIMOTO, J. 1998. A multiple device approach for supporting whiteboard-based interactions. Paper presented at the ACM CHI 98 Conference (Los Angeles, CA). ACM, New York. RINGEL, M., BERG, H., JIN, Y., ANDWINOGRAD, T. 2001. Barehands: Implement-free interaction with a wallmounted display. Paper presented at the ACM CHI Conference on Human Factors in Computing Systems. ACM, New York. SMITH, K. A., SHEPPARD, S. D., JOHNSON, D. W., AND JOHNSON, R. T. (2005). Pedagogies of engagement: Classroom-based practices. J. Engineering Education, 87-101. TANDLER, P. 2000. Architecture of beach: The software infrastructure for roomware environments. Paper presented at the CSCW 2000: Workshop on Shared Environments to Support Face-to-Face Collaboration (Philadelphia, PA). Received October 2005; revised February 2006; accepted March 2006
ACM Journal of Educational Resources in Computing, Vol. 5, No. 4, December 2005.