Curve Structure Extraction for Cartoon Images Ming-Ming Cheng TNLIST, Tsinghua University Abstract: We propose a novel method for curve structure extraction of cartoon images. Our method handles two types of cartoon curves, decorative curves and boundary curves, in a uniform way. The method consists of two steps. First, we calculate curve points by applying non-maximal suppress on secondary derivative of cartoon images. Second, these curve points are linked together to form structure curves while unreliable curves are removed away. Compared to curve structure extraction algorithm proposed by Steger, the number of curves generated by our algorithm is only 19% of Steger’s on average, with better curve quality. Furthermore, more accurate curve position can be obtained by our method. Keywords: curve extraction, curve linking, low-level processing, cartoon images
1.Introduction1 Cartoon animation, as an important artistic format, has a long history and a variety of products, forming a big industry. A various kinds of editing [14] can be performed after extracting the most important semantic element, curve structures, from cartoon animations. Cartoon images have some special properties mainly including two aspects. First, there are often two types of curve structure, boundary curve and decorative curve, with totally different properties in a single cartoon image, as is shown in Fig. 1. Boundary curves which have step profiles are often used to separate different color regions while decorative curves which have ridge profiles can be drawn specifically by artists to convey structure, motion, and other artistic meaning. Many classical algorithms failed to give high quality results when dealing with cartoon images because that they usually consider only one curve type but not both. Second, cartoon curves are born with artificial and regular nature, including much smoother orientation and clear signals at most part of curves. Inspired by these special properties of cartoon images, we propose a two steps method to extract curve structure, considering both types of cartoon curves. First, we calculate curve points by non-maximal suppress secondary derivative of cartoon images. Next, these curve points are linked together to form curve structure and unreliable curves are removed. To further reduce noise in orientation information which is essential for our linking algorithm, we also propose a new filter for Correlated Orientation Correction (COC), which greatly improve orientation information estimation especially in weak curve areas where traditional algorithms often fail.
Source code (C++) available at: http://cg.cs.tsinghua.edu.cn/people/~cmm/ Foundings: National Natural Science Foundation (U0735001), 863 Program (2009AA01Z330) Contact Author: Ming-Ming Cheng, E-mail:
[email protected]
13
多媒体学术会议
Figure 1: Sample of two types of curves.
Compared to the most widely used curve structure extraction algorithm proposed by Steger , the number of curves produced by our algorithm is only 19% of Steger’s on average, and with better curve quality. Moreover, we process both types of cartoon curves in a uniform way while traditional algorithms [1, 10, 11] only produce good results for one of them but not both. [10]
1.1 Related works Curve extraction is a very important research topic with many literatures. Previous works on this area can be classified into three categories. Boundary curve extraction methods for general images: A summary of boundary curve extraction methods, also called edge detection, can be found at Forsyth and Ponce’s book [4]. These methods define curves as sharp changing image region (similar to boundary curve) and detect them by finding curve points with maximal gradient magnitude along curve profile. Though work well for boundary curves, they are not suitable for decorative curves. Two parallel curves on either side of decorative curve will be produced. This brings difficulties to further processing such as vectoring and editing. Decorative curve extraction methods for general images: Decorative curve extraction methods define curves as lines with small but finite width (similar to decorative curve) [2, 7, 9, 10]. These algorithms analyze curves by modeling the curves as well as their surroundings. However, their models of curve profiles are only suitable for decorative curves. Significant bias will arise for boundary curve. Moreover, as not introducing regular feature of cartoons, noise in orientation information can’t be reduced well enough especially in weak curve area, this leads to too many discontinuous curves in their results. Curve structure extraction for cartoon images: Sykora et al. [11, 12] proposed a counter detection algorithm for cartoons. In their work, a novel counter detection algorithm is used to get counters with very good connectivity based on the assumption that foreground parts of cartoons are bounded by bold dark contours. However their assumption is too strict and not suitable for most modern cartoons.
2. Curve Structure in Cartoon Image There are two types of curves, boundary curves and decorative curves, widely exist in cartoon images (Fig. 1). The profile of boundary curve and decorative curve can be modeled and h are width and extreme value. They’re illustrated in Fig. 2 together with their first and second derivative. As an observation, is satisfied for most cartoons. by Equ. 1 where
14
第五 五届和谐人机环境 境联合学术会议
中国西安
Fiigure 2: Profiles of o boundary curvee and decorative curve c and their coonvolution with first fi and second deerivative off Gaussian kernels for different sccale factor σ. The first row shows the profiles of boundary curves and the seecond row shows the profiles of decorative curves. From F left to right, they are curve prrofiles and their deerivative w first and seconnd derivative of Gaussian. with G
0 | |
,
0
| | | |
(1)
3 Detection of Curve 3. e Points 3.1 Curve Pointts Detection in n 1D: Let’s denotte curve profiles as
and start from 1D case. c For decorrative curve whhich has
parabolic profilee, magnitude of o second derivvative iss always maxim mal at curve position p [9] w while first derivvative vanish . For boundaary curves, maagnitude of graadient taakes its m maximal value at curve positiion while seconnd derivative vanish. v Consideering all curves to be boundary curve and find maxximal of gradieent will lead too results similaar to Canny [1], which would produce artifacts for deecorative curvees that two parrallel curves ap w ppear (Fig. 4a). If we coonsider all curvves to be decoraative curve and estimate curvee position using g Taylor Polynomial as inn [10], significannt bias will arisee for boundary curves (Fig. 4bb). However, it is not straightfforward too directly combbine Canny’s method m with Steeger’s method, since it is non n-trivial and unrreliable too distinguish the two types of curves. c Before chooosing a unifiedd criterion for both b curve types, we examinee derivatives of curve profiles becausee these derivativves are highly correlated withh curves positio ons. Because off noise, derivatives of im mages should be estimated by convolving thee image with deerivatives of Gaaussian sm moothing kerneel which is thee only kernel thhat makes the ill-posed probllem of estimatting the [3] derivatives of nooisy function well-posed w . Thhe Gaussian kerrnel is given by y Equ. 2. (2)
√
15
多媒体学术会议
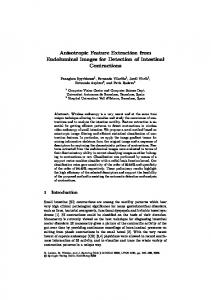
(a) (b) (c) (d) Figure 3: Curve points (b) obtained by non‐maximal suppress on second derivative (a) of Fig. 1. Our result (c) is more continuous than Steger’s algorithm (d). Each curve structure in (c) and (d) is illustrated by a random color so that different curves can be easily distinguished by each other.
Thus, a scale-space description of curve derivatives can be obtained by selecting different σ. We illustrated scale-space behavior of boundary curve and decorative curve in Fig. 2. For decorative curve which has parabolic profile, magnitude of the second derivative is maximal at true curve position. Thus decorative curve points can be select based on maximal of second derivative
. Although maximal of second derivative can’t produce true curve position for
boundary curves, they always make acceptable result because of ω
ω (see Sec. 2). As
shown in Fig. 4c, the bias is always less than 1 pixel which is acceptable in our application. 3.2 Curve Points Detection in 2D: Curve structure in 2D image space can be modeled as curves which have characteristic of 1D curve profile in the direction perpendicular to the curve. We denote this direction to be , and then the curve direction becomes n . Curve points in 2D image space can be selected by
r
choosing local maximal of second derivative along direction n . In order to calculate second derivative and curve direction of the image, partial derivative of the input image r , r , r , r and r have to be estimated by convolving the image with discrete two dimensional Gaussian partial derivative kernels. The direction , in which second derivative of image function takes its maximal value, can be estimated by calculating eigenvalues and eigenvectors of the Hessian matrix [10]: ,
(3)
This calculation can be down in a numerically stable and efficient way by using one Jacobi rotation to annihilate the r term [8]. Then, the eigenvector corresponding to the eigenvalues with maximum absolute value is 2
with
1. Secondary directional derivative along
is: (4)
Curve points can be chosen by using non-maximal suppress [1] to second derivative of original image. Points which satisfy the following two conditions will be marked as curve points. First, their second derivative should be maximal in its neighbor area along direction . Secondly, should be bigger than a user defined threshold , i.e. . Fig. 3 gives an example of curve points for input image Fig. 1 as well as second derivative of this image. In order to preserve curve points in weak curve areas, for example bosom area, we choose a very low threshold
0.005. 16
第五届和谐人机环境联合学术会议
中国西安
4. Linking of Curve Points Curve points should be linked to form curve structure thus facilitate future editing. These curve structures has global information thus can be used to determine whether a weak curve point produced by previous step comes from a weak curve or noise signal. To get meaningful curves, two factors are important. They are second derivative
of
inputting image and local curve orientation . However, it’s not suitable to use these two factors by a weighted combination. The relative value of along n is more important than the value itself. It’s very common that
has much bigger value at those pixels near strong curve points
plays a significant role when than at true curve position of weak curves. Local orientation linking curve points to form meaningful curve structural. For summary, is important in a more global view while
is more important in a local view. It’s better to use
alone to find
alone to link them. Relative value of has already been used in Sec. curve points and use 3. In this section, we link curve points only considering local orientation information. We link curve points by repeatedly choosing a start point and establishing curve structural by adding appropriate curve point to current curve. The start point is chosen as a point with biggest among those unlinked curve points. Start point should also have second derivative bigger than another user defined threshold . The two thresholds, and , respectively used in curve point detection and linking formed a hysteresis [1] which helps us to get more continuous results. Since starting point does not necessary lie in endpoints of a curve, linking should be done at both directions and . In order to find appropriate curve point to add to current curve, we search in a small neighbor area to find curve point best match orientation of current point. If no suitable curve point could be found, a slightly bigger area will be checked. In the implementation, we check three pixels which compatible with curve direction in the 8-neighbors area first and then other three pixels in a larger area along curve direction. For , has an orientation 0, p , p , p ,p example, if the current expanding point and
,
are checked first and then p
,p
, p
,p
and
,
.
After that, global information is used to remove unreliable curve points produced in Sec. 3. Weak curve always have much regular orientation and produce longer curve structure than noisy. Even when noisy signals produce bigger ’’, since they are less correlated, they can be removed while keeping weak curves. We remove curves which have less than 3 points in all experiments.
5. Correlated Orientation Correction Orientation information plays a significant role when linking curve points. However, it is always suffering from image noises, even if we use bilateral filter [8] to deal with this problem. We propose a method called COC to reduce noisy along curves. 17
多媒体学术会议
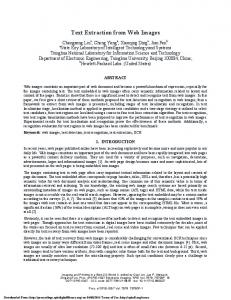
(a) Canny’s method (b) Steger’s method (c) Our method Figure 4: Results comparisons for the image block in Fig. 1. Original image is used as background of curve structures so that bias between detected curve position and true curve position can be easily viewed.
5.1 A Novel Filter for Correlated Orientation Correction Removing noise from image signals is a traditional topic with many literatures. A basic idea is to replace signals of a pixel by a weighted average of correlated pixels. The difference is how to choose the range of correlated pixels and how to define the weights. Gaussian smoothing considers that nearby pixels are more correlated and gives them more weights. Bilateral filter [13] chooses correlated pixels not only by whether they are close, but also by how signals are similar to current one. Thus they give a feature preserving noise removal algorithm. Although we can smooth noise in orientation information using bilateral filter [13] or even a more complicated filter [6] to get more noise free orientation information, this would cause two problems. First, these methods use 2D filters which is a waste of time. Second, too much un-correlated pixels are introduced and they give little contribution or even noise. Orientation information in cartoon images has several properties which enable us to design better filters to remove noise in orientation information. These properties including: z z
Orientation near start point of linking is always more reliable than endpoints of curve. Orientation changes slowly along curves due to the regular nature of cartoons.
z Orientation is more reliable at true curve position and less reliable at other points. Considering these properties, we propose a 1D filter along the curve. Pixels along current curve should be the most correlated pixels. Denote the index of each pixel from current expanding point to the start point of linking to be 0, 1, 2, … , . The orientation of current expanding point can be refined by the following formula: n
∑ ∑
,
(5)
,
Here, q controls the number of pixels which will be used to refine current point. Notice that only one side of current point is know when linking and we give more weight to nearby pixels. Parameter
controls how smoothing orientation information along the curve is. Bigger
makes orientation information change more slowly. We use
0.5 all over this paper.
5.2 Approximation Algorithm for Faster Correlated Orientation Correction Equ. 7 which needs constant computation time can be use to approximate Equ. 6. It’s a good approximation because
n
n
1
ω
decreases very fast as n
,
ω
∑ ∑
18
grows, and
0 for i
q, … , p.
,
,
(6)
第五届和谐人机环境联合学术会议
(a)
中国西安
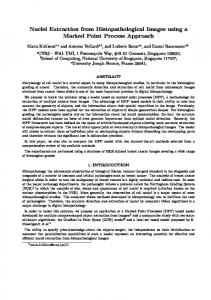
(b) (c) Figure 5: Cases producing suboptimal results.
(d)
6 Experimental Results and Comparison Fig. 4 compares our method with Canny [1] and Steger [10]. Canny’s method, which is the most widely used algorithm for extracting boundary curves, produces two parallel curves at either side of decorative curves. This brings difficulties to further processing because that parallel property is difficult to be maintained. Canny’s method is more sensitive to noise compared to ours which use properties of cartoon curves. Supplemental material gives more comparisons. Among the related works, Steger’s method [10] is most similar to ours. Our algorithm outperforms Steger’s in two aspects when dealing with cartoon images. First, we handle both decorative curves and boundary curves quite well but Steger’s results for boundary curve have significant bias (Fig. 4). Second, our method produces more meaningful and continuous results. Less failure to extract continuous curve make our algorithm produces less curves than Steger’s with better quality. For similar experiments on 30 typical cartoon images, the number of curves produced by our algorithm is 19% of Steger’s on average, also with better quality (Tab. 1). This brings not only less data when vectorizing but also easier editing when reusing these curves. and . Larger should be used to Important parameters for our algorithm are σ, extract wider curves. and t form a hysteresis. From a start point of linking which has second derivative r’’ t , curve is constructed by adding new curve points so long as they have orientation match with current curve and second derivative ’’ . Our method is parameter insensitive. All results for cartoon images in this paper use the same parameters: 1, t 0.005 and 0.02. Our method has similar time efficiency as Steger’s method [10]
. In experiments, an 640 480 image often takes 50~100ms for getting curve points and 5~10ms for linking. All these experiments are done on a PC with Q9300 2.5GHz CPU.
7. Conclusion This paper presents a novel approach aimed at detecting curve structures in cartoon images. Although cartoon images are much simpler than nature images, extracting curve structures from them using traditional algorithms [2, 1, 3] can’t generate good results because that they consider only boundary curves or decorative curves but not both. We proposed a novel algorithm for processing two major types of cartoon curves in a uniform way. Experimental results on several typical cartoon images show that our results have better continuity and accuracy. 19
多媒体学术会议 Table 1 Number of curves representing similar visual effects ID Steger Our method
1 1197 220
2 456 113
3 894 168
4 1721 251
5 748 149
6 843 140
7 674 158
8 1505 361
9 690 117
10 1449 363
11 1120 199
12 1579 270
13 924 147
Our methods targets cartoons which have artificial artistic content. It produces suboptimal results for: z Cartoon images with complicated textures (see Fig. 5a for an example): A large z
number of curve structures are produced for this monster image covered in fur. Real image with complicated contents (see Fig. 5c): Too many tousy curve structures are produced due to the complicated background in this image.
Reference [1] J. Canny. A computational approach to edge detection, IEEE Transaction on Pattern Analysis and Machine Intelligence, 8: 679~698, 1986 [2] M. Chen, Z. Cheng, Y. Liu. A robust algorithm of principal curve detection, In Proceeding of International Conference on Pattern Recognition, 429~432, 2004 [3] L. M. J. Florack, B. M. ter Haar Romeny, J. J. Koenderink, M. A. Viergever. Scale and the differential structure of images, Image and Vision Computing, 10: 376–388, 1992 [4] D. A. Forsyth, J. Ponce. Computer Vision: A Modern Approach, Prentice Hall, 2002 [5] B. Julesz. A method of coding tv signals based on edge detection. The bell System Technical Journal, 38:1001–1020, 1959. [6] H. Kang, S. Lee, C. K. Chui, Coherent line drawing, In Proceedings of the 5th International Symposium on Non-photorealistic Animation and Rendering, 43–50, 2007 [7] J. Peng, Y.-Q. Jin. An unbiased algorithm for detection of curvilinear structures in urban remote sensing images, International Journal of Remote Sensing, 28: 5377–5395, 2007 [8] W. H. Press, S. A. Teukolsky, W. T. Vetterling, B. P. Flannery. Numerical Recipes: The Art of Scientific Computing, Cambridge University Press, Cambridge, UK, 1992 [9] C. Steger. Extracting curvilinear structures: A differential geometric approach, In ECCV, 630–641, 1996 [10] C. Steger. An unbiased detector of curvilinear structures, IEEE Transaction on Pattern Analysis and Machine Intelligence, 20: 113~125, 1998 [11] D. Sykora, J. Burianek, J. Zara. Segmentation of black and white cartoons, In Proceedings of Spring Conference on Computer Graphics, 223~230, 2003 [12] D. Sykora, J. Burianek, J. Zara, Sketching cartoons by example, In Proceedings of The 2nd Eurographics Workshop on Sketch-Based Interfaces and Modeling, 27–34, 2005 [13] C. Tomasi, R. Mantachie. Bilateral filtering for gray and color images, In Proceedings of International Conference on Computer vision, 839–846, 1998 [14] Song-Hai Zhang, Tao Chen, Yi-Fei Zhang, Shi-Min Hu, Ralph Martin, Vectorizing Cartoon Animations, IEEE Transaction on Visualization and Graphics, 15: 518-629, 2009..
20