Preprocessing implementation for microarray (PRIM): an efficient method for processing cDNA microarray data
KOJI KADOTA, RIKA MIKI, HIDEMASA BONO, KENTARO SHIMIZU, YASUSHI OKAZAKI and YOSHIHIDE HAYASHIZAKI Physiol. Genomics 4:183-188, 2001. ; You might find this additional info useful...
Supplementary material for this article can be found at: http://physiolgenomics.physiology.org/http://physiolgenomics.physiology.org/content/suppl/2001/0 1/24/4.3.183.DC1.html
This article has been cited by 13 other HighWire-hosted articles: http://physiolgenomics.physiology.org/content/4/3/183#cited-by Updated information and services including high resolution figures, can be found at: http://physiolgenomics.physiology.org/content/4/3/183.full Additional material and information about Physiological Genomics can be found at: http://www.the-aps.org/publications/physiolgenomics This information is current as of June 2, 2013.
Physiological Genomics publishes results of a wide variety of studies from human and from informative model systems with techniques linking genes and pathways to physiology, from prokaryotes to eukaryotes. It is published 24 times a year (twice monthly) by the American Physiological Society, 9650 Rockville Pike, Bethesda MD 20814-3991. Copyright © 2001 the American Physiological Society. ESSN: 1531-2267. Visit our website at http://www.the-aps.org/.
Downloaded from http://physiolgenomics.physiology.org/ at CAPES-UFSM on June 2, 2013
This article cites 9 articles, 5 of which you can access for free at: http://physiolgenomics.physiology.org/content/4/3/183.full#ref-list-1
Physiol Genomics 4: 183–188, 2001.
Preprocessing implementation for microarray (PRIM): an efficient method for processing cDNA microarray data
Received 7 August 2000; accepted in final form 7 November 2000
Kadota, Koji, Rika Miki, Hidemasa Bono, Kentaro Shimizu, Yasushi Okazaki, and Yoshihide Hayashizaki. Preprocessing implementation for microarray (PRIM): an efficient method for processing cDNA microarray data. Physiol Genomics 4: 183–188, 2001.— cDNA microarray technology is useful for systematically analyzing the expression profiles of thousands of genes at once. Although many useful results inferred by using this technology and a hierarchical clustering method for statistical analysis have been confirmed using other methods, there are still questions about the reproducibility of the data. We have therefore developed a data processing method that very efficiently extracts reproducible data from the result of duplicate experiments. It is designed to automatically filter the raw results obtained from cDNA microarray image-analysis software. We optimize the threshold value for filtering the data by using the product of N and R, where N is the ratio of the number of spots that passed the filtering vs. the total number of spots, and R is the correlation coefficient for results obtained in the duplicate experiments. Using this method to process mouse tissue expression profile data that contain 1,881,600 points of analysis, we obtained clustered results more reasonable than those obtained using previously reported filtering methods. expression profiling; data processing; cluster analysis
project, many technologies focused on the study of functional genomics have been developed. cDNA microarray, or DNA chip, technology is one of the leading technologies in this field. It was developed because investigators needed a way to systematically analyze the expression profiles of thousands of genes at once (6). Many results useful in biology and medicine were inferred by using this technology in combination with a hierarchical clustering method for statistical analysis, and those results were confirmed in additional experiments. There is, how-
WITH THE PROGRESS OF THE GENOME
Article published online before print. See web site for date of publication (http://physiolgenomics.physiology.org). Address for reprint requests and other correspondence: Y. Okazaki, Laboratory for Genome Exploration Research Group, RIKEN Genomic Sciences Center, RIKEN Yokahama Institute, 1-7-22 Suehiro-cho, Tsurumi-ku, Yokohama City, Kanagawa 230-0045, Japan (E-mail:
[email protected] and
[email protected]).
ever, some controversy with regard to the reproducibility of the results, which can be affected by the PCR amplification, spot typing, probe labeling, slide processing, hybridization condition, image analysis, and so on (7, 10). Several ways of minimizing the variance of the data have been reported (1, 4, 5, 9), and the best way to obtain reproducible data is to perform the experiment at least twice under identical conditions. For obtaining a reproducible data set from a series of duplicate experiments, we have developed an efficient data processing method we call preprocessing implementation for microarray (PRIM) to process the raw data automatically. It is a filtration program with three steps: 1) remove the spots that were flagged during the visual inspection of the microarray images, 2) remove the spots having a signal intensity lower than a threshold value, and 3) remove the spots that are beyond a threshold distance from the least-meansquare line through a plot of the data obtained in one duplicate experiment against the data obtained in the other duplicate experiment. To set the thresholds in the second and third steps, we use the product of N and R, where N is the ratio of the number of spots that passed the filtration program vs. the initial number of spots (just after the removal of the flagged spots), and R is the correlation coefficient of the expression ratio in the first and second experiments. The feasibility of this filtering method was tested using a mouse tissue expression profile data set and was demonstrated by the clustering of the results. MATERIALS AND METHODS
Materials. Mouse (C57BL/6) full-length RIKEN cDNA 19,000 sets were printed on glass slides coated with poly-Llysine (6), and 49 tissue-specific expression profiles were produced using adult tissues and embryonic organ tissues. Since the cDNA microarray uses the dual-dye system, we prepared probes by labeling them with Cy3 dye and prepared 17.5-day embryos (whole body) by labeling them with Cy5 dye as a reference. Experimental conditions. mRNA extracted from the 49 tissues was labeled by incorporating Cy3 during randomprimed reverse transcription. cDNA derived from entire day E17.5 embryos, which we labeled with Cy5, was used as the
1094-8341/01 $5.00 Copyright © 2001 the American Physiological Society
183
Downloaded from http://physiolgenomics.physiology.org/ at CAPES-UFSM on June 2, 2013
KOJI KADOTA,1,2 RIKA MIKI,1,4 HIDEMASA BONO,1 KENTARO SHIMIZU,2 YASUSHI OKAZAKI,1,3 AND YOSHIHIDE HAYASHIZAKI1,3,4 1 Laboratory for Genome Exploration Research Group, RIKEN Genomic Sciences Center, RIKEN Yokahama Institute, Yokohama City, Kanagawa 230-0045, Japan; 2Department of Biotechnology, University of Tokyo, Tokyo 113-8657, Japan; 3Core Research for Evolutional Science and Technology, Japan Science and Technology Corporation, Ibaraki 305-0074; and 4 Cooperative Graduate School of Medicine, Tsukuba University, Ibaraki 305-8575, Japan
184
PRIM: PREPROCESSING IMPLEMENTATION FOR MICROARRAY
RESULTS
To obtain a reproducible data set, we use the product of N and R, where N is the ratio of the number of spots that passed the filtration program vs. the number of spots in the initial data set (just after the removal of the flagged spots), and R is the correlation coefficient of the expression ratio in the first and second experi1 Supplemental material to this article is available online at http:// physiolgenomics.physiology.org/cgi/content/full/4/3/183/DC1.
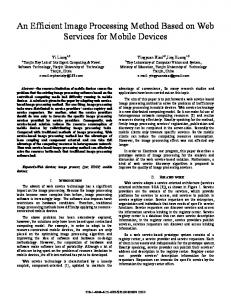
Fig. 1. Schema of data processing in preprocessing implementation for microarray (PRIM): second filtration (A) and third filtration (B) (see Filtering procedure). Spots in areas shaded with oblique lines are eliminated from subsequent analysis. The first filtration is not shown because it is just the removal of the flagged data.
ments. The concept of using the product of these numbers arises from the fact that when we extract the data points we need to extract to increase R, the value of N decreases. This is not good, because we want to recover as much of the data as possible. There is thus a tradeoff between the N value and the R value. We tried to set up a threshold that would keep N as large as possible at a value of R that would give a proper result. We have analyzed the gene expression profiles in 49 tissues by using a 19,000 full-length mouse cDNA microarray. As shown in Fig. 1, PRIM is composed of three steps. The flagged data is first excluded, and then spots having a signal intensity less than bg ⫹ xbg are excluded. Finally, the spots that are farther than y from the best-fit line are excluded. PRIM is designed to
http://physiolgenomics.physiology.org
Downloaded from http://physiolgenomics.physiology.org/ at CAPES-UFSM on June 2, 2013
expression reference for all tissues. The labeling was carried out at 42°C for 1 h in a total volume of 30 l containing 400 U SuperScript II (GIBCO BRL); 0.5 mM each dATP, dCTP, and dGTP; 0.2 mM dTTP, 10 mM DTT, 6 l of 5⫻ first-strand buffer, and 6 g random primers. To remove unincorporated nucleotide, we labeled cDNA with 500 l of binding buffer [5 M guanidine-SCN, 10 mM Tris (pH 7.0), 0.1 mM EDTA, 0.03% gelatin, and 2 ng/l tRNA] and 50 l of silica matrix buffer [10% matrix, 3.5 M guanidine chloride, 20% glycerol, 0.1 mM EDTA, and 200 mM sodium acetate (pH 4.8–5.0)], transferred the mixture to a GFX column (Amersham Pharmacia), and centrifuged it at 15,000 rpm for 30 s. The flowthrough material was discarded, and the column was washed with 500 l of wash buffer. The adsorbed probe was eluted with distilled water into a final volume of 17 l. This labeled probe was mixed with blocking solution containing 3 l of 10 g/l oligo-dA, 3 l of 20 g/l yeast tRNA, 1 l of 20 g/l mouse Cot1 DNA, 5.1 l of 20⫻ SSC, and 0.9 l of 10% SDS. The RIKEN full-length mouse cDNA that comprised the target was hybridized in a final volume of 30 l: the entire array consisted of three multi-blocks, and each multi-block required 10 l of hybridization solution. Before hybridization, probe aliquots were heated at 95°C for 1 min and cooled to room temperature. Coverslips were hybridized overnight at 65°C in a Hybricasette. After hybridization, slides were washed in 2⫻ SSC, 0.1% SDS until the coverslips dropped off. The slides were then transferred into 1⫻ SSC, shaken gently for 2 min, and rinsed with 0.1⫻ SSC for 2 min. After the slides were washed, they were spun in a centrifuge. These slides were scanned on a ScanArray 5000 confocal laser scanner, and the images were analyzed by using ImaGene (BioDiscovery). Each spot was defined by manually positioning a grid of circles over the array image, and spots deemed unsuitable for accurate quantitation because of array artifacts were flagged and excluded from analysis. cDNA clones not amplified by PCR were also excluded. The duplicate experiments were performed using the same template mRNA, and the labeling was done separately for each experiment followed by hybridization. Filtering procedure. The filtering procedure started with the ImaGene output file was applied to those spots that were correctly amplified by PCR reaction (about 14,000 genes). This procedure consisted of three steps (Fig. 1): 1) eliminate spots that were flagged manually; 2) eliminate spots whose signal intensity is less than bg ⫹ xbg (x ⱖ 0) in both channels, where bg and bg are the mean and standard deviation of the background signal intensity; 3) eliminate spots more than y from the least-mean-square line. The parameters x and y were determined so that the value of NR has the maximum score (Smax) at each step (please refer the figure in the Supplemental Material1 for this article, published online at the Physiological Genomics web site). Hierarchical clustering was done using the Cluster program developed by Eisen et al. (3).
185
PRIM: PREPROCESSING IMPLEMENTATION FOR MICROARRAY
Table 1. R and N values for the different filtering methods Ross
Alizadeh
White
Our Method
R 0.745262958 0.711036979 0.843757813 0.782707167 N 0.905141746 0.999729865 0.460718648 0.961086227 Same terminal branch 43 44 43 47 R, correlation coefficient; N, ratio of the number of genes; “Same terminal branch” indicates the number of genes that formed the same terminal branch.
channel; and in the method of White et al. (9), it is a signal intensity of 1,000. Our method resulted in the largest number of same terminal branches with high N value (Table 1). Although in the method of Alizadeh et al. (1) yielded the best N value, the average final R was lower than our value when the threshold (1.4 times) was changed. The method of White et al. (9) resulted in the highest average final R, but it also resulted in a very low N value and in fewer same terminal branches than we obtained with our method. DISCUSSION
We have developed an efficient data-processing method for use with cDNA microarrays, and in this report we demonstrated the importance of preprocessing the data. Increase of R gives a good index for the reproducibility of the duplicated experiments. However, this causes the decrease of the number of remaining genes N, which is not suitable for the data analysis. Thus, we developed the idea of the NR product value in setting up a threshold, since the reproducible data that
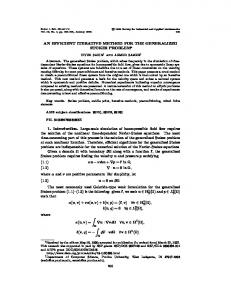
Fig. 2. A diagram for all 49 tissues, showing the value of the correlation coefficient at each step. Initial data, first filtration; 2nd, second filtration; 3rd, third filtration. The average values of the correlation coefficients in each filtration step are as follows: initial, 0.7066; second, 0.7425; third, 0.7799. http://physiolgenomics.physiology.org
Downloaded from http://physiolgenomics.physiology.org/ at CAPES-UFSM on June 2, 2013
set up the N and R values so that their product is as large as possible. For each of the 49 tissues, the increase of final correlation coefficient R at each step can be seen by comparing the three curves in Fig. 2. There is a tendency that the lower the R value of the initial data (just after the removal of manually flagged spots), the larger is the increase of the R. In all cases the R value after the PRIM filtration was greater than that after the first filtration. The average R value after the first filtration was 0.707, and the average R value after the third filtration was 0.780. The number of the same terminal branches formed in the hierarchical clustering is a good index of the reproducibility of the duplicate experiments. Figure 3 shows dendrograms of initial data (Fig. 3A) and filtered data (Fig. 3B) with complete linkage hierarchical clustering. The filtered data formed 47 same terminal branches out of 49 sets, whereas the initial data formed only 44 same terminal branches. These results clearly show that we can get a better result after the PRIM filtration. Clustering results from initial data are shown in Fig. 4A, and results obtained using data after PRIM filtration are shown in Fig. 4B. The average data set of each duplicated result was used for the analysis. The germ layer information is also included and is shown in a different color. The utility of the PRIM method was further evaluated by using three other methods to process the same initial data set (1, 5, 9). Each of these three methods uses only one type of filtration: excluding spots whose signal intensity is over a threshold. In the method of Ross et al. (5), this threshold is 0.4% of the dynamic range above the background signal intensity in either channel; in the method of Alizadeh et al. (1), it is 1.4 times the local background signal in each
186
PRIM: PREPROCESSING IMPLEMENTATION FOR MICROARRAY
the researcher would like to have is a trade-off of the higher R and lower N. Development of a proper filtering method is a must for reliable subsequent analysis, especially an analysis such as the hierarchical classification used to detect subtypes of a certain disease (1). The feasibility of our method was demonstrated by the R for the filtered data being higher than the R for the initial data (Fig. 2) and by the number of dupli-
cated sets with the same terminal branches being higher for the filtered data than for the initial data. In Fig. 2 the increase of the correlation coefficient after the PRIM filtration tends to be larger when the initial correlation coefficient is lower. This means our filtration method is especially effective when the reproducibility of the initial data set is relatively low. The minimum value of R that results in the formation of
Fig. 4. The 49-tissue dendrogram with the terminal branches colored to reflect the ostensible tissue of the germ layer (green, mesoderm; reddish-brown, endoderm; blue, ectoderm and embryo; others are in black). The average value of each pair set in 49 tissues were used for the clustering. A: initial data. B: filtered data. Note that the dendrogram of the processed data reflects the difference of the germ layer (mesoderm, endoderm, and ectoderm) better than does the dendrogram of the initial data. http://physiolgenomics.physiology.org
Downloaded from http://physiolgenomics.physiology.org/ at CAPES-UFSM on June 2, 2013
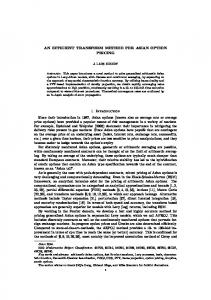
Fig. 3. A schema of the 49-tissue specimen tree. Dashed lines show that the duplicate sets formed the same terminal branches. The scale to the right depicts the correlation coefficient value represented by the length of the dendrogram branches connecting pairs of nodes. A: initial data. B: filtered data. Note that 47 sets formed the same terminal branch after filtration (B), whereas 44 pairs were formed without filtration (A).
PRIM: PREPROCESSING IMPLEMENTATION FOR MICROARRAY
187
Downloaded from http://physiolgenomics.physiology.org/ at CAPES-UFSM on June 2, 2013
http://physiolgenomics.physiology.org
188
PRIM: PREPROCESSING IMPLEMENTATION FOR MICROARRAY
principle applicable to data sets made up of triplicate samples or even more replicate samples. In fact, we confirmed that PRIM filtration for any combination of two experiments among triplicate data set (E14 liver, skeletal muscle, and eyeball) produced high R values, and the three average data of each were clustered in the same group (data not shown). The program is also applicable, with a few modifications, to oligo DNA chip data. We strongly recommend the PRIM strategy be widely used for data filtration. We thank S. Nakamura and M. Ikeguchi for comments on the manuscript. This study was supported in part by Special Coordination Funds for Promoting Science and Technology from the Science and Technology Agency of the Japanese Government to Y. Okazaki. This study was also supported by Special Coordination Funds and a Research Grant for the RIKEN Genome Exploration Research Project, Core Research for Evolutional Science and Technology, and Research and Development for Applying Advanced Computational Science and Technology of Japan Science and Technology Corporation to Y. Hayashizaki. This work was also supported by a Grant-inAid for scientific Research on Priority Areas and Human Genome Program, from the Ministry of Education, Science and Culture, and by a Grant-in-Aid for a Second Term Comprehensive 10-Year Strategy for Cancer Control from the Ministry of Health and Welfare to Y. Hayashizaki. REFERENCES 1. Alizadeh AA, Eisen MB, Davis RE, Ma C, Lossos IS, Rosenwald A, Boldrick JC, Sabet H, Tran T, Yu X, Powell JI, Yang L, Marti GE, Moore T, Hudson, J Jr, Lu L, Lewis DB, Tibshirani R, Sherlock G, Chan WC, Greiner TC, Weisenburger DD, Armitage JO, Warnke R, Levy R, Wilson W, Grever MR, Byrd JC, Botstein D, Brown PO, and Staudt LM. Distinct types of diffuse large B-cell lymphoma identified by gene expression profiling. Nature 403: 503–511, 2000. 2. Alon U, Barkai N, Notterman DA, Gish K, Ybarra S, Mack D, and Levine AJ. Broad patterns of gene expression revealed by clustering analysis of tumor and normal colon tissues probed by oligonucleotide arrays. Proc Natl Acad Sci USA 96: 6745– 6750, 1999. 3. Eisen MB, Spellman PT, Brown PO, and Botstein D. Cluster analysis and display of genome-wide expression patterns. Proc Natl Acad Sci USA 95: 14863–14868, 1998. 4. Marton MJ, DeRisi JL, Bennett HA, Iyer VR, Meyer MR, Roberts CJ, Stoughton R, Burchard J, Slade D, Dai H, Bassett, DE Jr, Hartwell LH, Brown PO, and Friend SH. Drug target validation and identification of secondary drug target effects using DNA microarrays. Nat Med 4: 1293–1301, 1999. 5. Ross DT, Scherf U, Eisen MB, Perou CM, Rees C, Spellman P, Iyer V, Jeffrey SS, Van de Rijn M, Waltham M, Pergamenschikov A, Lee JC, Lashkari D, Shalon D, Myers TG, Weinstein JN, Botstein D, and Brown PO. Systematic variation in gene expression patterns in human cancer cell lines. Nat Genet 24: 227–235, 2000. 6. Schena M, Shalon D, Davis RW, and Brown PO. Quantitative monitoring of gene expression patterns with a complementary DNA microarray. Science 270: 467–470, 1995. 7. Schuchhardt J, Beule D, Malik A, Wolski E, Eickhoff H, Lehrach H, and Herzel H. Normalization strategies for cDNA microarrays. Nucleic Acids Res 28: E47, 2000. 8. Shalon D, Smith SJ, and Brown PO. A DNA microarray system for analyzing complex DNA samples using two-color fluorescent probe hybridization. Genome Res 6: 639–645, 1996. 9. White KP, Rifkin SA, Hurban P, and Hogness DS. Microarray analysis of Drosophila development during metamorphosis. Science 286: 2179–2184, 1999. 10. Young RA. Biomedical discovery with DNA arrays. Cell 102: 9–15, 2000.
http://physiolgenomics.physiology.org
Downloaded from http://physiolgenomics.physiology.org/ at CAPES-UFSM on June 2, 2013
the same terminal branches in a duplicate experiment is about 0.7 (Fig. 3B) in these data sets. In other words, most of the results of duplicate experiments are clustered in the same terminal branches if the R value was greater than 0.7. In this sense our method is good, because in most cases we can extract data sets for which R is greater than 0.7. This is important because tumor samples from a patient are sometimes scarce, and we cannot always repeat the experiment (2). The extraction of useful information from data sets having relatively low R values is especially valuable in these cases. The bone tissue in the present work is a good example: the R value was only 0.4382 for the initial bone tissue data but was 0.7503 after the third filtration (Fig. 3). The bone was not clustered in the same terminal branch before the filtration but was clustered in the same terminal branch after the filtration. The formation of the same terminal branches in duplicate experiments is a good criterion for evaluating the usefulness of a filtering method (5). We used this criterion to compare our method with previously reported filtering methods. As shown by the values listed in Table 1, with the method of White et al. (9), the R is highest, but the N is lowest. With the method of Alizadeh et al. (1), the N value is the highest, but the R value is not high, and the number of same terminal branches was lower than it was with our method. With regard to having as many same terminal branches as possible and a high N value, our method was the best. The two sets of tissues that did not form the same terminal branches were E11 (11-day-old embryo) and cortex (Fig. 3B). The E11 was clustered in a group containing E11 head and olfactory brain. Also, the cortex was clustered in a group of cerebellum and adult brain. These tissues share many cell types in common, so they probably need a higher R score to distinguish them from each other. Duplicate sets of initial data and data after PRIM filtration were also compared from the biological point of view. The duplicate sets of data were averaged and used for this analysis (Fig. 4, A and B). The clusters obtained after PRIM filtration (Fig. 4B) seem to be a more reasonable than those obtained from the initial data (Fig. 4A). For example, in Fig. 4B the small intestine is clustered close to the colon and cecum tree, which is more reasonable than the cluster tree of stomach with colon and cecum shown in Fig. 4A. Other examples of results more reasonable after data filtration are the N0 (neonatal day 0) head clustered next to the tree of N10 and N6 head, the liver and liver tumor clustered in the same tree, lung and N0 lung also being in the same terminal branch. All of these results obtained after filtration are, from a biological point of view, more reasonable than the results obtained from the initial data. Finally, PRIM is the first method that applies the concept of extracting highly reproducible data with the consideration of higher N value. The feasibility was demonstrated with a large set of data. The program was designed for use with duplicate data sets but is in