Data Processing and Algorithm Development for the WFIRST-AFTA Coronagraph: Reduction of Noise Free Simulated Images, Analysis and Spectrum Extraction with Reference Star Differential Imaging Marie Ygoufa , Laurent Pueyoa , R´emi Soummera , Marshall D. Perrina , Roeland van der Marela , Bruce Macintoshb a Space b Physics
Telescope Science Institute, 3700 San Martin Dr., Baltimore, MD, USA, 21218; Department, Stanford University, 382 Via Pueblo Mall, Stanford, CA, USA, 94305 ABSTRACT
Direct detection and characterization of mature giant or sub-Neptunes exoplanets in the visible require spacebased instruments optimized for high-contrast imaging with contrasts of 10−9 . In this context, the Wide-Field Infrared Survey Telescope - Astrophysics Focused Telescope Assets (WFIRST-AFTA) will reach raw contrasts of about 8 × 10⁻⁹ to 10−9 using state-of-the-art starlight suppression and wavefront control techniques. A ten-fold contrast improvement is therefore expected using post-processing techniques to reduce the speckle noise level to a factor of at least 10 lower in order to distinguish 10−9 planets from speckles. Point spread function (PSF) subtractions have been successfully applied to ground-based and space-based data with contrasts up to 10−6 but performance has yet to be demonstrated at higher contrast levels. We use both a classical PSF subtraction and the Karunhen-Lo`eve Image Projection (KLIP) algorithm to reduce noise free WFIRST-AFTA-like simulated images in the context of reference star differential imaging (RDI). The two WFIRST-AFTA baseline coronagraphs are considered for this study: the hybrid lyot coronagraph (HLC) for the imaging channel and the shaped-pupil coronagraph (SPC) for the integral field spectrograph channel (IFS). The two reduction methods are compared with respect to the amount and stability of the aberrations for detection in the imaging channel and preliminary spectra extractions are performed for characterization in the IFS channel. Keywords: Direct imaging of exoplanets, High contrast imaging, WFIRST-AFTA, Post-Processing, Coronagraphic PSF subtraction, Detection, Characterization, Instrumentation
1. INTRODUCTION Direct imaging of exoplanets is a highly challenging technique as it requires to reach extreme values of contrast between the flux of a planet and its host star. For the WFIRST-AFTA coronagraph the contrast requirement is 10−9 .1 It is planned to reach contrasts of about 8 × 10⁻⁹ to 10−9 , using state-of-the-art starlight suppression and wavefront control techniques. As part of the star-light suppression, two different kinds of coronagraphs have been selected for the mission: a shaped-pupil coronagraph (SPC), which is based on an optimal binary apodizer2–4 and an hybrid lyot coronagraph (HLC).5, 6 A system of two deformable mirrors (DMs) is used to control the wavefront upstream of the coronagraph to correct the wavefront in real time, creating some dark-holes in the focal plane with the help of an Electric Field Conjugation (EFC) algorithm.7 A Low Order WaveFront Sensing and Control (LOWFSC) subsystem uses the starlight that is rejected by the coronagraph to measure low-order aberrations caused by the pointing jitter of the telescope or thermal variations.8 Finally, a ten-fold contrast improvement to image and characterize reflected-light gas giants with WFIRST-AFTA is expected to come from post-processing. In this communication, we report our investigation about post-processing techniques applied on high-contrast broadband and multi-spectral noise free WFIRST-AFTA-like data sets9 with synthetic planets in the context of reference star differential imaging (RDI).10 The classical PSF subtraction, also called coronagraphic PSF template Please send correspondence to Marie Ygouf at
[email protected]
subtraction (CPSFTS),11 uses only one reference star and can be seen as one of the simplest method for RDI. The Principal Component Analysis (PCA) method12, 13 performs linear combinations of principal components of a library of reference PSFs. Also referred as KLIP for Karhunen-Lo`eve Image Projection, it has been implemented to process images of NICMOS and WFC3 data of the HR8799 planetary system.12, 14 It is currently implemented in the ALICE pipeline15, 16 for the HST-NICMOS archive reprocessing. With its success on HST-NICMOS, the structure of ALICE pipeline has been used as a base for the coronagraphic reduction data pipeline of JWST, and there is little doubt regarding its future use in the same context for WFIRST-AFTA. The RDI strategy is confronted with the temporal stability of the instrumental aberrations, which leads to unsubtracted speckles residuals in the PSF subtraction process. Crucial issues are 1) to understand to which extent the stability and the amount of aberrations will have an impact on post-processing in the context of WFIRST-AFTA and 2) to develop techniques of spectrum extraction. After a brief description of the simulated data (section 2) and an introduction to the reduction techniques that we use (section 3), we address the following questions (section 4): How the stability of aberrations will have an impact on post-processing in the context of WFIRST-AFTA? What will be the impact of the amount of aberrations? What could be the impact of the instrumental strategy on post-processing? What possible sources of errors can impair the quality of spectrum extraction?
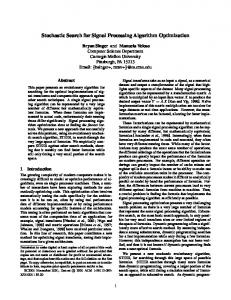
2. SIMULATIONS To find answers to these questions, we considered some noise-free data sets simulated by the Jet Propulsion Laboratory (JPL) with their diffractive model for the WFIRST-AFTA coronagraph9 and from thermal models generated by the Goddard Space Flight Center (GSFC). We considered first and third iterations of thermal models (labelled as OS1 and OS3 by the WFIRST-AFTA project). The first one corresponds to a Fall 2014 model for which we artificially doubled and quadrupled the coma to study the robustness of post-processing. The second one is a Spring 2015 design for which we studied the performance with and without a LOWFSC subsystem. They all consist of the simulated consecutive observations of two stars: a bright star is targeted (β Uma; A1IV, V=2.37) for the dark hole generation; it is then the science target’s turn (47 Uma; G1V, V=5.04) to be observed. The two WFIRST-AFTA baseline coronagraphs are used to generate these data: the HLC in the broadband imaging channel for both observing scenarios OS1 and OS3 and the SPC in the multi-spectral integral field spectrograph channel (IFS) for the OS3 scenario only. There are 88 β UMa images and 321 each for 47 UMa for the OS1 scenario and 8 β UMa images and 17 each for 47 UMa for the OS3 scenario. Some synthetic planets were added to 47 UMa in all data sets. Figure 1 shows an example of two simulated data sets: with HLC (Figure 1a) and SPC (Figure 1b). One can notice the particular shape of the off-axis PSF in the image simulated with the SPC. Depending on the position of the planet in the field, its shape is more or less truncated by the bow-tie mask in the focal plane, which makes the spectrum extraction very challenging. For a full discussion of these simulations, we invite the reader to refer to Krist et al.’s paper in the WFIRST-AFTA Coronagraphs special section of the Journal of Astronomical Telescopes, Instruments, and Systems (JATIS).17
3. DATA PROCESSING 3.1 Reduction techniques We applied the classical PSF subtraction and KLIP techniques to reduce these data sets. The classical PSF subtraction consists of a simple subtraction of the collapsed and normalized reference data cube from the normalized long exposure raw image. Before reducing the data with KLIP, we subract the average values of the science and reference data cubes so that they have zero mean. We collapse the science data cube (47 Uma) to obtain a long exposure raw image. We then apply the KLIP algorithm, which 1) decomposes the reference data cube into principal components or KLIP modes; 2) projects the long exposure raw image into these modes to create a synthetic reference; and 3) subtracts the synthetic reference from the target. In the case of multi-spectral data sets from the IFS channel, we perform the same process for each wavelength independently in such a way that no diversity from spectral differential imaging (SDI) is used.
Raw image (HLC)
Injected planets
(a) HLC OS1 distribution Raw image (SPC)
Focal plane mask
Planet-only scene at central wavelength
Off-axis PSF with (3.15,1.05) λ/D offset
(b) SPC OS1 distribution
Figure 1: HLC and SPC OS1 simulated data sets. (a) HLC OS1 distribution, from left to right: raw long exposure image of the science target (47 UMa) and injected planets with contrasts of 5.7 × 10⁻⁹ , 10−9 and 0.8 × 10⁻⁹ with respective separations of 3.1λ/D, 2.9λ/D and 5.3λ/D. (b) SPC OS1 distribution, from left to right: raw long exposure image of the science target (47 UMa), planet-only scene at central wavelength (contrast of 4.2 × 10⁻¹⁰ ), bow-tie mask (focal plane mask sampled at the resolution of the final image) and unocculted PSF with offsets of 3.15 λ/D and 1.05 λ/D at 0.8 µm with only two visible lobes, the third being hidden by the bow-tie mask.
3.2 Forward modeling We then use the foward modeling technique12, 18, 19 to estimate the photometry at each wavelength and extract the exoplanet spectrum from the SPC OS1 distribution. In their paper, Soummer et al. described an optimal way to estimate an exoplanet photometry and astrometry using KLIP.12 Called forward modeling, it consists in propagating a template of the off-axis PSF through the reduction algorithm in order to calibrate its throughput.
4. RESULTS AND ANALYSIS 4.1 Detection in the imaging channel with an HLC We compared the results of our reductions for the two simulated observing scenarios OS1 (Figure 2) and OS3 (Figure 3) by representing on the same dynamic range: the long exposure raw image; the classical PSF subtraction reduction; the KLIP reduction with 4 modes; and with the maximal number of modes for OS1 (88 modes) and OS3 (8 modes). All the reductions show a relatively good PSF subtraction compared to the raw image, even with increasing amounts of coma or without LOWFSC. The thermal model in OS1 leads to very stable wavefronts and under such very stable conditions, the level of detection is quite similar in the three different reductions, with two of the three synthetic planets detected (Figure 2.a). In the case of OS3, even though the number of data used to build the reference library is much smaller (8) than in the OS1 case (88), KLIP enables to detect the three planets instead of two with the classical PSF subtraction (Figure 3.a). Therefore, the thermal model in OS3 seems to lead to more unstable wavefronts
Raw data
Class. PSF Sub.
KLIP w/4 modes
KLIP w/88 modes
(a) Coma x1 Raw data
Class. PSF Sub.
KLIP w/4 modes
KLIP w/88 modes
(b) Coma x2 Raw data
Class. PSF Sub.
KLIP w/4 modes
KLIP w/88 modes
(c) Coma x4
Figure 2: HLC OS1 simulated data sets - Impact of the amount of aberrations on post-processing. Comparison of the noiseless raw data and three different reductions for increasing amounts of coma. Top: (a) coma x1 (reference amount). Middle: (b) coma x2. Bottom: (c) coma x4. From left to right with same dynamic range: raw image (long exposure); image processed with classical PSF subtraction; image processed with KLIP 4 modes; and image processed with KLIP 88 modes. Whereas the two techniques show a relatively good and similar PSF subtraction compared to the raw image for the reference amount of coma (coma x1), the contrast improvement with 88 KLIP modes is better than with the classical PSF subtraction when the amount of coma increases. than for the OS1 thermal model. In such conditions, the performance of classical PSF subtraction decreases and one should rather use KLIP as a reduction strategy. Figure 2 gives insight into which extent the amount of aberrations has an impact on post-processing. Even though the thermal model used for the simulations is the same in the three OS1 data sets, KLIP with 88 modes does a better job than the classical PSF subtraction at cleaning the residual speckles when the amount of coma increases. The case of coma multiplied by 4 (Figure 2.c) is the most explicit as the KLIP reduction with 88 modes is the only one that enables the detection of two of the three synthetic planets. KLIP is more robust than the classical PSF subtraction to increasing amounts of aberrations, enabling very similar detections to the case with lower aberrations represented in Figure 2.a. Figure 3 studies the impact of the LOWFSC, as instrumental strategy, on post-processing. The LOWFSC provides enough aberration stability to improve the detection levels for the three different reductions in a similar way (Figure 3.b). Without LOWFSC, the detection level is better with KLIP (3 planets detected with 8 modes) than with classical PSF subtraction (2 planets detected) (Figure 3.a). Even the case with 4 KLIP modes enables a better detection, if not ideal, than the classical PSF subtraction for the third planet. An instrumental strategy such as the LOWFSC, aiming at stabilizing aberrations, decreases the differences between the two reduction
Raw data
Class. PSF Sub.
KLIP w/4 modes
KLIP w/8 modes
(a) Without LOWFC Raw data
Class. PSF Sub.
KLIP w/4 modes
KLIP w/8 modes
(b) With LOWFC
Figure 3: HLC OS3 simulated data sets - Impact of the LOWFSC on post-processing. Comparison of the noiseless raw data and three different reductions. Top: (a) data without LOWFSC. Bottom: (b) data with LOWFSC. From left to right with same dynamic range: raw image (long exposure); image processed with classical PSF subtraction image processed with KLIP 4 modes and image processed with KLIP 8 modes. The two techniques show a relatively good PSF subtraction compared to the raw images for both the cases without and with LOWFSC. The reduction quality is improved by the KLIP reduction compared to the classical PSF subtraction; the more KLIP modes used, the better the result. techniques, but KLIP could be of a great help if the LOWFSC does not work perfectly.
4.2 Characterization in the IFS channel with a SPC For characterization in the IFS channel with a SPC, we focused on the spectrum extraction of a Jupiter-like exoplanet with a contrast of 4.2 × 10⁻¹⁰ , assuming that the position of the planet is well-known. We did not intend to perform a realistic extraction here, we rather carried out a qualitative study to understand the effects of the algorithm throughput, of the efficiency of the algorithm at subtracting the speckles and of an instrumental miscalibration in the view of developing an error budget estimation methodology. Figure 4 shows an example of a KLIP reduction with 88 modes for the central wavelength. The injected planet was detected with a good signal-to-noise ratio at the right of the central occultation. After the reduction, we estimated the planet flux at each wavelength using a matched filter with the wavelength evolving planet-only scene as a template. We thus assumed that we have a perfect calibration of the PSF shape and of its evolution with the wavelength. We first performed some spectrum extractions with and without forward modeling to evaluate the impact of the algorithm throughput on the flux estimation (cf. Figure 5). We represented on the same plot as many spectra as different possible reductions with KLIP (88 references decomposed in 88 principal components or KLIP modes). Without forward modeling (cf. Figure 5a), the dispersion of the different estimations is far from being negligible. This is due to a KLIP throughput drop with the number of modes, causing the estimated photometry to decrease. The mean of these estimations is represented by the purple curve on the right plot. There is a significant discrepancy between this extracted spectrum and the injected one, the latter being represented by the blue curve. This discrepancy drops in the estimation with forward modeling (cf. Figure 5b). The remaining difference between the two spectra can be explained by the residual speckles. Figure 6 illustrates how a reduced amount of residual speckles relatively to the planet flux improves the spectrum extraction. For the sake of simplicity, we chose to increase the planet flux by a factor of 10 instead of decreasing the level of residual speckles, all other things being equal. This was equivalent to extract the spectrum
Figure 4: SPC OS1 simulated data set. Comparison of the raw data and a 88 KLIP mode reduction for the central wavelength with the same dynamic range. [Left] raw image (long exposure) and [right] image processed with 88 KLIP modes. The injected planet is detected with a good signal-to-noise ratio on the right of the central occultation. of a planet with a contrast of 4.2 × 10⁻⁹ , which is still a very good test case for the WFIRST-AFTA project. This optimal spectrum extraction from noise free data demonstrates that our spectral extraction technique is only limited by the presence of relatively strong residual speckles. Thus, the algorithm efficiency at subtracting the speckles is determinant for the spectrum extraction process. We finally considered the case of a flawed calibration of the off-axis PSF shape and of its evolution with the wavelength (cf. Figure 7). This led to a poor spectrum estimation, increasing the bias of the flux estimations. This can be explained by the particular shape of the off-axis PSF created by the shaped-pupil coronagraph. It evolves with the position of the planet in the field and with the wavelength. This effect, combined to the truncation by the bow-tie mask in the focal plane, makes of the off-axis PSF calibration a key element for spectrum extraction with this technique. Other sources of errors that have not been studied here, such as a miscalibration of the instrumental throughput or an inaccurate astrometry estimation, should also be taken into account in the error budget estimation.
5. CONCLUSIONS For the first time, we applied the PCA-based KLIP algorithm to reduce and analyze simulated images with a view to detect and characterize exoplanets with the future space-based WFIRST-AFTA coronagraph. We considered noise free images simulated with both an HLC in the imaging channel and a SPC in the IFS channel. The stability of aberrations seems to have an important impact on post-processing in the context of WFIRSTAFTA. The performance of the PSF subtraction methods will highly depend on the thermal variations induced by the observing scenario, these variations being possibly mitigated by instrumental strategies such as the LOWFSC. If the temporal stability of WFIRST-AFTA PSFs will not be known until flight, it is important to confront each new observing scenario with the different post-processing techniques. This will help to identify the best possible strategies at the very high contrast imaging levels enabled by WFIRST-AFTA. We demonstrated that the KLIP algorithm in combination with the forward modeling technique enables a non-biased estimation of a Jupiter-like spectrum at a contrast of 4.2 × 10⁻⁹ , as soon as the level of residual speckles is low. The quality of spectrum extraction depends on several factors, including the reduction technique that we use, the reduction parameters, the knowledge of the system we want to characterize and the knowledge of the instrument. In particular, we emphasize in this study the importance of forward modeling to correct from the reduction algorithm throughput and of good speckle subtraction and off-axis PSF calibration. Based on these results, we are now ready to develop an error budget estimation methodology for spectrum extraction and identify the dominant contributors, the requirements for calibration and the impact of the reduction parameters.
ACKNOWLEDGMENTS This WFIRST-AFTA study was carried out at Space Telescope Science Institute (STScI) under subcontract No. 1506553, funded by the Jet Propulsion Laboratory (JPL), which is managed for NASA by the California
0.12
0.12
0.10
0.10
Planet Flux
Planet Flux
0.14
Modes from 1 to 88
0.08 0.06 0.04
0.08 0.06 0.04 0.02
0.02
0.00
0.00 740
760
780 800 820 840 Wavelength channels
Mean of all KLIP modes Injected Spectrum
740
860
760
780 800 820 840 Wavelength channels
860
(a) Without forward modeling 0.14
0.12 0.10
0.10
Planet Flux
Planet Flux
0.12 Modes from 1 to 88
0.08 0.06
0.08 0.06
0.04
0.04
0.02
0.02
Mean of all KLIP modes Injected Spectrum
740
760
780 800 820 840 Wavelength channels
860
740
760
780 800 820 840 Wavelength channels
860
(b) With forward modeling
Figure 5: SPC OS1 simulated data set - Impact of forward modeling. [Left] 88 spectrum extractions represented on the same plot (as many as different possible reductions with KLIP). [Right] The blue curve represents the mean and standard deviation of these estimations and the purple curve represents the injected spectrum. The dispersion of the estimations and bias are more significant (a) without forward modeling than (b) with forward modeling.
1.2
1.2
1.0
Modes from 1 to 88
Planet Flux
Planet Flux
1.0 0.8 0.6
0.8 0.6
0.4
0.4
0.2
0.2
Mean of all KLIP modes
740
760
780 800 820 840 Wavelength channels
860
Injected Spectrum
740
760
780 800 820 840 Wavelength channels
860
Figure 6: SPC OS1 simulated data set - Impact of the level of residual speckles. [Left] 88 spectrum extractions represented on the same plot (as many as different possible reductions with KLIP). [Right] The blue curve represents the mean and standard deviation of these estimations and the purple curve represents the injected spectrum. With a low level of residual speckles, there is no bias in the spectrum estimation.
0.12 0.10 Modes from 1 to 88
Planet Flux
Planet Flux
0.10
0.05
0.00
0.08 0.06 0.04 Mean of all KLIP modes
0.02
Injected Spectrum
740
760
780 800 820 840 Wavelength channels
860
0.00
740
760
780 800 820 840 Wavelength channels
860
Figure 7: SPC OS1 simulated data set - Impact of a miscalibration of the off-axis PSF shape and of its evolution with the wavelength. [Left] 88 spectrum extractions represented on the same plot (as many as different possible reductions with KLIP). [Right] The blue curve represents the mean and standard deviation of these estimations and the purple curve represents the injected spectrum. A miscalibration of the off-axis PSF shape and of its evolution with the wavelength introduces a bias in the spectrum extraction. Institute of Technology. The authors are grateful to John Krist for providing simulations used in this study, and to John Krist, Bertrand Mennesson, Bijan Nemati and Gautam Vasisht for helpful discussions.
REFERENCES 1. D. Spergel, N. Gehrels, J. Breckinridge, M. Donahue, A. Dressler, B. S. Gaudi, T. Greene, O. Guyon, C. Hirata, J. Kalirai, N. J. Kasdin, W. Moos, S. Perlmutter, M. Postman, B. Rauscher, J. Rhodes, Y. Wang, D. Weinberg, J. Centrella, W. Traub, C. Baltay, J. Colbert, D. Bennett, A. Kiessling, B. Macintosh, J. Merten, M. Mortonson, M. Penny, E. Rozo, D. Savransky, K. Stapelfeldt, Y. Zu, C. Baker, E. Cheng, D. Content, J. Dooley, M. Foote, R. Goullioud, K. Grady, C. Jackson, J. Kruk, M. Levine, M. Melton, C. Peddie, J. Ruffa, and S. Shaklan, “Wide-Field InfraRed Survey Telescope-Astrophysics Focused Telescope Assets WFIRST-AFTA Final Report,” ArXiv e-prints (2013). 2. D. Spergel and J. Kasdin, “A Shaped Pupil Coronagraph: A Simpler Path towards TPF,” in American Astronomical Society Meeting Abstracts, Bulletin of the American Astronomical Society 33, 1431 (2001). 3. N. J. Kasdin, R. J. Vanderbei, D. N. Spergel, and M. G. Littman, “Extrasolar Planet Finding via Optimal Apodized-Pupil and Shaped-Pupil Coronagraphs,” Astrophys. J. 582, 1147–1161 (2003). 4. A. Carlotti, N. J. Kasdin, and R. J. Vanderbei, “Shaped pupil coronagraphy with WFIRST-AFTA,” in Society of Photo-Optical Instrumentation Engineers (SPIE) Conference Series, Society of Photo-Optical Instrumentation Engineers (SPIE) Conference Series 8864, 10 (2013). 5. D. C. Moody and J. T. Trauger, “Hybrid Lyot coronagraph masks and wavefront control for improved spectral bandwidth and throughput,” in Society of Photo-Optical Instrumentation Engineers (SPIE) Conference Series, Society of Photo-Optical Instrumentation Engineers (SPIE) Conference Series 6693, 1 (2007). 6. J. T. Trauger, B. Gordon, and D. Moody, “The Hybrid Lyot Coronagraph for the Imaging of Exoplanet Systems with the AFTA telescope,” in American Astronomical Society Meeting Abstracts #223, American Astronomical Society Meeting Abstracts 223, 109.03 (2014). 7. A. Give’on, B. Kern, S. Shaklan, D. C. Moody, and L. Pueyo, “Broadband wavefront correction algorithm for high-contrast imaging systems,” in Society of Photo-Optical Instrumentation Engineers (SPIE) Conference Series, Society of Photo-Optical Instrumentation Engineers (SPIE) Conference Series 6691, 0 (2007). 8. J. K. Wallace, S. Rao, R. M. Jensen-Clem, and G. Serabyn, “Phase-shifting Zernike interferometer wavefront sensor,” in Society of Photo-Optical Instrumentation Engineers (SPIE) Conference Series, Society of PhotoOptical Instrumentation Engineers (SPIE) Conference Series 8126 (2011). 9. J. E. Krist, “End-to-end numerical modeling of AFTA coronagraphs,” in Society of Photo-Optical Instrumentation Engineers (SPIE) Conference Series, Society of Photo-Optical Instrumentation Engineers (SPIE) Conference Series 9143, 0 (2014).
10. D. Mawet, L. Pueyo, P. Lawson, L. Mugnier, W. Traub, A. Boccaletti, J. T. Trauger, S. Gladysz, E. Serabyn, J. Milli, R. Belikov, M. Kasper, P. Baudoz, B. Macintosh, C. Marois, B. Oppenheimer, H. Barrett, J.-L. Beuzit, N. Devaney, J. Girard, O. Guyon, J. Krist, B. Mennesson, D. Mouillet, N. Murakami, L. Poyneer, D. Savransky, C. V´erinaud, and J. K. Wallace, “Review of small-angle coronagraphic techniques in the wake of ground-based second-generation adaptive optics systems,” in Society of Photo-Optical Instrumentation Engineers (SPIE) Conference Series, Society of Photo-Optical Instrumentation Engineers (SPIE) Conference Series 8442, 4 (2012). 11. G. Schneider, M. D. Silverstone, E. Stobie, J. H. Rhee, and D. C. Hines, “NICMOS Coronagraphy: Recalibration and the NICMOS Legacy Archive PSF Library,” in Hubble after SM4. Preparing JWST, 15 (2010). 12. R. Soummer, L. Pueyo, and J. Larkin, “Detection and Characterization of Exoplanets and Disks Using Projections on Karhunen-Lo`eve Eigenimages,” Astrophys. J. Lett. 755, L28 (2012). 13. A. Amara and S. P. Quanz, “PYNPOINT: an image processing package for finding exoplanets,” Mon. Not. R. Astron. Soc. 427, 948–955 (2012). 14. A. Rajan, T. Barman, R. Soummer, L. Pueyo, J. Patience, J. Brendan Hagan, B. Macintosh, C. Marois, and Q. M. Konopacky, “Detection and characterization of the atmospheres of the HR 8799 b and c planets with high contrast HST/WFC3 imaging,” in American Astronomical Society Meeting Abstracts, American Astronomical Society Meeting Abstracts 225, #323.07 (2015). ´ Choquet, C. Chen, D. A. Golimowski, J. Brendan Hagan, T. Mittal, 15. R. Soummer, M. D. Perrin, L. Pueyo, E. M. Moerchen, M. N’Diaye, A. Rajan, S. Wolff, J. Debes, D. C. Hines, and G. Schneider, “Five Debris Disks Newly Revealed in Scattered Light from the Hubble Space Telescope NICMOS Archive,” Astrophys. J. Lett. 786, L23 (2014). 16. E. Choquet, J. B. Hagan, L. Pueyo, M. D. Perrin, D. C. Hines, C. Chen, G. Schneider, J. Debes, D. Golimowski, N. Reid, T. Mittal, M. Moerchen, M. N’Diaye, A. Rajan, S. Lonsdale, and R. Soummer, “Archival Legacy Investigation of Circumstellar Environments using KLIP algorithm on HST NICMOS coronagraphic data,” in IAU Symposium, M. Booth, B. C. Matthews, and J. R. Graham, Eds., IAU Symposium 299, 30–31 (2014). 17. J. Krist, B. Nemati, and B. Mennesson, “Numerical modelling of the proposed WFIRST-AFTA coronagraphs and their predicted performances,” Journal of Astronomical Telescopes, Instruments, and Systems (2015). 18. L. Pueyo, R. Soummer, J. Hoffmann, R. Oppenheimer, J. R. Graham, N. Zimmerman, C. Zhai, J. K. Wallace, F. Vescelus, A. Veicht, G. Vasisht, T. Truong, A. Sivaramakrishnan, M. Shao, L. C. Roberts, Jr., J. E. Roberts, E. Rice, I. R. Parry, R. Nilsson, S. Luszcz-Cook, T. Lockhart, E. R. Ligon, D. King, S. Hinkley, L. Hillenbrand, D. Hale, R. Dekany, J. R. Crepp, E. Cady, R. Burruss, D. Brenner, C. Beichman, and C. Baranec, “Reconnaissance of the HR 8799 Exosolar System II: Astrometry and Orbital Motion,” ArXiv e-prints (2014). 19. L. Pueyo, “Detection and characterization of exoplanets using projections on Karhunen-Lo`eve eigenimages: forward modeling,” submitted to Astrophys. J. .