Data Tweening: Incremental Visualization of Data Transforms Meraj Khan§
Larry Xu;
Arnab Nandi§
The Ohio State University§
Joseph M. Hellerstein;
University of California, Berkeley;
{khan.485,nandi.9}@osu.edu, {larry.xu,hellerstein}@berkeley.edu
ABSTRACT
EnrollmentYear, Dept FROM StudentEnrollment E; to query Q, below).
In the context of interactive query sessions, it is common to issue a succession of queries, transforming a dataset to the desired result. It is often difficult to comprehend a succession of transformations, especially for complex queries. Thus, to facilitate understanding of each data transformation and to provide continuous feedback, we introduce the concept of “data tweening”, i.e., interpolating between resultsets, presenting to the user a series of incremental visual representations of a resultset transformation. We present tweening methods that consider not just the changes in the result, but also the changes in the query. Through user studies, we show that data tweening allows users to efficiently comprehend data transforms, and also enables them to gain a better understanding of the underlying query operations.
1.
Q = SELECT * FROM ( SELECT EnrollmentYear , Dept FROM S t u d e n t E n r o l l m e n t E ) PIVOT ( COUNT ( Dept ) FOR Dept IN ( " ECE " , " CSE " ));
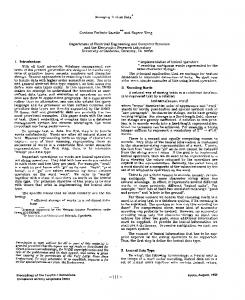
On a traditional query-result interface, this would involve issuing a single text query, yielding a new result. On modern interactive interfaces, the same query can be issued by directly manipulating the original resultset through means of user actions, for example a dragging operation on a mousebased interface, or a rotate gesture on a touch screen-based interface (Figure 1). Such direct manipulation [24]-style interaction has become increasingly popular, especially with the growing use of touch screen-based devices such as smart phones and tablets. In such settings, the absence of continuous visual feedback during each interaction can disorient the user. Thus, providing a fluid experience with constant visual explanation and feedback is often a hard requirement in modern interaction modalities [9] [17]. Some data transforms can lead to abrupt transitions in the query output visualization, as shown in Figure 1. Here, the output changes directly from T1 to T12 . The outputs T1 and T12 are quite dissimilar with completely different schema and data, which can leave users disoriented. The users can clearly notice something changed, but are left with no clue about what the exact changes were or how and why they came about. Such abrupt transitions in resultsets can occur for even the simplest of query changes, such as the addition or removal of a WHERE clause. Being overwhelmed with transitions during interactive sessions is not new – in a Lotus Improv sales video from the 1990s [http://youtu.be/dsYsZmhnXR4], the developer mentions users were “left flabbergasted” by the pivot function, requiring a repetition of the operation to fully understand the transformation. We define such transitions where users cannot comprehend the change in state of output as breaks in result space continuity. Result space continuity can be defined as maintaining a smooth and coherent transition between two distinct results. As a principal, we believe that result space continuity is a fundamental requirement of instantaneous query interfaces. Discontinuities in the result space confuse the user, breaking the illusion of direct manipulation. In such cases, it might be crucial to provide a visual explanation of the result transformation for the user to connect the dots – wherein the users can see the transformation played out as a sequence of easily understandable basic transformations. In this paper we propose data tweening as a way to achieve result space continuity. The concept of tweening (based on
INTRODUCTION
Over the past decade, the interactivity of data analysis interfaces has increased dramatically. This change has been driven by a number of factors, including relatively easy-touse visualization toolkits such as D3.js [2], as well as improvements in hardware and database technology [6] [21]. As database response times begin to rival the frame rate for animation, it is possible to provide near-instantaneous feedback to the user during their interaction with the interface. These changes have forced the entire notion of querying from a ‘question-answering’ interaction to instantaneous and iterative exploration of the query / result space. Modern query interfaces employ high levels of interactivity with the end user, situating the user in a session of successive queries, as opposed to a single query. As an example, consider a query session where the user is currently looking at the resultset T1 . Now, the user performs a new pivot transformation, shown in Figure 1. The resultset T1 is transformed to T12 . While being a very useful operation for analytical purposes, the transformation yields a large change in the result for a relatively small change in the query itself (i.e., changing from SELECT StudentId,
This work is licensed under the Creative Commons AttributionNonCommercial-NoDerivatives 4.0 International License. To view a copy of this license, visit http://creativecommons.org/licenses/by-nc-nd/4.0/. For any use beyond those covered by this license, obtain permission by emailing
[email protected]. Proceedings of the VLDB Endowment, Vol. 10, No. 6 Copyright 2017 VLDB Endowment 2150-8097/17/02.
661
8
2013
ECE
12
2013
CSE
12
2013
CSE
2013
CSE
2013
CSE
9
2013
ECE
7
2013
ECE
7
2013
ECE
2013
ECE
2013
ECE
8
2013
ECE
8
2013
ECE
2013
ECE
2013
ECE
9
2013
ECE
2013
ECE
2013
ECE
T1
media shrink
9
2013
one-finger double tap EnrollmentYear Dept Count
two hand zoom out
2012
ECE
T2
T3
3
T5
T4
CSE 2
StudentId
EnrollmentYear
Dept
1
2012
CSE
4
2012
CSE
2013
CSE
10
2013
CSE
11
2013
CSE
12
2013
CSE
7
2013
ECE ECE
9
2013
ECE
T1
2012
4
ECE2012
2012
3 ECE
2012
2
ECE2012
3
2012
5 ECE
2012
3
ECE2012
5
2012
6 ECE
2013
5
CSE2012
10
2013
6
2013
11 CSE
2013
6
10
2013
12 CSE
2013
10
11
2013
7 CSE
2013
11
ECE2013
12
2013
8 CSE
2013
12
ECE2013
7
2013
9 ECE
2013
7
ECE2013
8
2013
ECE
8
2013
2013
ECE
2012
4
ECE
2013
ECE
2013
ECE
T6
3
2012 CSE
2012
ECE
ECE
5
2013
9
2013
Dept
20122012
CSECSE
20122012
ECE
2012
ECE
Count
Dept
2013
2013 4 CSE
CSE
6
10CSE
2013
2013
CSE
CSE
10
11CSE
2013 CSE
2013
CSE
CSE
11
2013
12CSE
2013
2013
CSE
CSE
12
7 ECE
2013
2013
ECE
ECE
8 ECE
2013
2013
ECE
ECE
ECE 2013
2013
ECE
ECE
2013 2013
T3
2012
CSE
6 CSE
2013
CSE2013
ECE ECE
9 ECE
T
T2
3
T4
6 StudentId
2
EnrollmentYear
2013
Dept
2
CSE
Count
EnrollmentYear
20122012 CSE
3
ECE
3
6
ECE
4
2012
Dept
2012 ECE
Count
2012
CSE
22012
CSE
2
ECE
3
2012 2012
2
ECE
32012
2013
CSE
CSE
42013
CSE
4
3
2013
CSE
ECE
32013
ECE
3
2013
CSE
CSEECE
3
4
2013
20132013
11
2013
CSE 2013
ECE
2013
ECE
12
2013
7
2013
8
2013
9
2013
2012
5
2012
ECECSE
2013
CSE CSE
T6
CSE
2012
CSE
2
2012
ECE
2012
3
2012
ECE 2012
2012
ECEECE ECE
3
2012
ECE ECE
2012 2012
ECE ECE
2012 2012
CSE CSE CSE CSE
2013 2013
ECECSE CSE
2013 2013
CSE CSE
7
2013 2013
ECE ECE
8
2013 2013
ECE ECE
9
2013 2013
2013
2012
4 mediaCSEexpand
2013 2013 2013 2013
T7 T3
Dept
3
T8
Count
EnrollmentYear
EnrollmentYear
3
ECE ECE
T5
6 10
ECE
11
ECE
12
ECE
7
Initial Result (T81)
2013
2012
2013
T7
2013
CSE
EnrollmentYear
QNEW
Dept
2012ECE
3
2013
CSE
2013
2013
CSE 2013
2013
CSE
4
2013
CSE
2013ECE
3
2013
CSE
2013
CSE
2013
ECE
2013
ECE
2013
ECE
2013
ECE
ECE 2012
ECE
3
ECE
CSE
ECE 2013
EnrollmentYear
CSE
2013
CSE
2013
CSE
2013
ECE
2013
ECE
Traditional UIs
ECE
2 3
3
5
2
4 ECE
T310
10
4 CSE
ECE
2012
2012
ECE
2012
2012
2012 CSE
ECE
2012
2013
11
2013
12
2013
7
2013
8
2013
Manipulation UIs TDirect 11
T9
EnrollmentYear
2012 2012 2
2013
3
3
T10
Dept
EnrollmentYear
Dept
CSE
2012
CSE
CSECSE
2012
CSE
ECE
2012
ECE
ECE2
2012
ECE
2012
ECE
2013
CSE
2013
CSE
2013
CSE
2013
CSE
2013
ECE
2013
ECE
Count
EnrollmentYear
2012
CSE
T9
ECE 2013
2013
ECE
EnrollmentYear 2012
4
4
CSE
CSE
2013
3
CSE
CSE
CSE
2013 3
T8
Dept
ECE 2012
2012
3
ECE
2012
3
6
2013
ECE
T5
EnrollmentYear
2012
3
ECE 2013
CSE
T9 2013
2
T8
ECE
media rotate CSE 2012
ECE
ECE
T4
Count
4
CSE
2
2013
StudentId
1
Count CSE
CSE
4
3
EnrollmentYear
CSE
4
10
T7
1
Count EnrollmentYear
two-finger double tap
2012 20122013
CSE
Dept
3
ECEECE
2
CSE CSE
2012 2012
EnrollmentYear
4
Dept
2012Dept
2
2
New Query EnrollmentYear / Transformation: ECE PIVOTCSE operation
CSE
EnrollmentYear
CSE
2012
2013
ECE ECE
2013
CSE
3
2
ECE
CSEECE
3 33
4
2013
2013
5 ECE
2012 2012
2012
4
CSE
3
CSE
2013
2013
2
ECE
3
CSE
4
ECE
ECE
ECE
STANDARD SPACE
CSE
CSE
ECE
2012
ECE
2
2012
CSE
2013
CSE
2012
2012
2013 two-finger tap CSE
EnrollmentYear
two hand rotate 5
2013
2012
2012
3 ECE
3
2013
2013
CSE2013
1
EnrollmentYear
2012
2012
2 ECE
Dept
EnrollmentYear CSE
2012
3
3
4 CSE
EnrollmentYear
Count
Count
CSE
ECE
2012
Dept Dept
Dept CSE CSE
ECE
ECE
2012
2012
EnrollmentYear EnrollmentYear
EnrollmentYear 2012 2012
2
ECE
2012
1
3
2012
CSE
StudentId
2012 2
CSE
CSE
CSE
T1 EnrollmentYear
T2
StudentId
2012 3 CSE
ECE
CSE
2012
Count
Dept
2012 ECE
1 CSE
CSE
2012
CSE2012
ECE
Dept
2 CSE
1
2
4
Tweening frames
(automatically
generated using
query session
two hand zoom in and results) 9
EnrollmentYear
2012
4
2013
4 CSE
ECE
3
8
2012
EnrollmentYear Dept EnrollmentYear
CSE
6
1
CSE
StudentId Dept
2012
2
ECE
CSE
CSE
ECE
2012
Dept EnrollmentYear
2012
ECE
ECE
2012
5
2012
EnrollmentYear StudentId
1
3
2012
3
StudentId Dept
EnrollmentYear
ECE
2
StudentId
TWEENING SPACE
4
2
4 CSE
T10
2013 Transformed ResultCSE(T12)
CSE 2013 CSE (hard to understand without
CSE 2013 CSE intermediate representations) T2013 ECE ECE 12 ECE
2013
3
4
ECE
close9 media2013 ECE 2013 2013 9 2013 ECE lock two + 1 finger tilt (precise tilt) T1 Spaces for Tweening: Figure 1: Visualization Result transformations are often too abrupt, andECE can be aided by
3
ECE
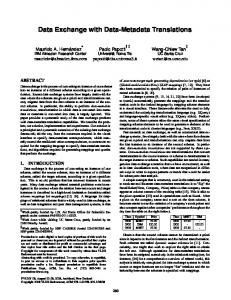
intermediate steps. To do this, we use the query session and the results to lift out of the standard space into the EnrollmentYear Dept Count T2 T3 in the final result.T4 Figure 2 lists complete T5 tweening space, where we show the user a series of tweening frames, ending set of tweening 2012 frames for the running example. A video (http://go.osu.edu/tweening) is provided for elucidation. CSE 2 2012
CSE
CSE 2
3
ECE
CSE
ECE
3
4
2.
ECE
3
EnrollmentYear EnrollmentYear intermediate steps could confuse the user even more, or even slowEnrollmentYear down the user’s query session to the point that they lose Dept Count continuity or patience. Thus, tweening needs to not only enCSE 2 2012 able2012smooth transitions between2012disjoint outputs, but to also ECE hide information satisfy a principle of3 “do no harm” to the user’s comprehension abilities and overall experience. CSE 4 2013 Contributions: propose data tweening as a means2013to ECE We 3 2013 make resultset transformations in a query session more informative and comprehensible. We introduce a grammar of transformsTand visual cues to express T9 tweening sequences. T10 8 We provide methods to generate these sequences, interpolating between resultsets or a combination of resultsets and their corresponding queries. Through user studies, we establish that tweening does not diminish a user’s understanding show information of transformations, and helps them gain insight into transformations otherwise unavailable in standard visualization. ECE
the term “in-betweening”), which has roots in graphics an2012 ECE imation [3], is to 2012 generate ECE a smooth transition sequence beEnrollmentYear Dept Count 3 tween distant states by adding interpolating frames. We ex2012 ECE 2012 2 tend this idea to query-result interfaces, where dataCSEtween2012 ECE 3 CSE smooth transition ing would mean 2013 generating sequences to 1 finger swipe (flick) 2013 CSE 3 finger pan (aggressive) interpolate between consecutive4 resultsets in a query session. 2013 CSE 4 2013 CSE This is done by 2013 adding intermediate result representations 2013 ECE 3 CSE between consecutive resultECE states in a query session, mak2013 ing it a smooth non-breaking transition. This definition is 2013 ECE 3 2013 ECE different from traditional animation tweening;T data tween7 ing is a mechanism to generate intermediate resultset states T 6 (equivalent to keyframes in computer animations), and not interpolating between visual keyframes. For conciseness, we use ‘tweening’ to represent data tweening from here on out. This paper describes a framework for generation of intermediate resultset states given pair swipe of consecutive queries twoafinger (flick) two finger scroll and their corresponding results. The query-result interfaces can implement the transition visualization as an animated transition between the intermediate resultset states. Figure 1 shows the tweening space (Section 2) in contrast to standard space. Instead of the pivot transformation visualized as an abrupt and discontinuous transformation from T1 to T12 , we have an incremental visualization through a series of intermediate resultsets T2 to T11 in the tweening space, shown in Figure 2. Tweening breaks down the complex pivot transformation into simple, easy-to-understand steps for the users. It should be noted that such complex tweening cannot be achieved by merely interpolating between two resultsets in pixel space without considering queries for context (Section 4.3). The pivot query Q provides the required context to generate a meaningful tweening (Section 4.3.2) from T1 to T12 . Challenges: Data tweening seems to have great promise as a solution to the result space continuity problem. However, if done poorly, it could be more of a hindrance than help: the effects could possibly be distracting, confusing, and time-consuming for users to understand [26]. Adding
3
DATA MODEL: RESULT SPACES
A critical challenge when visually conveying intermediary representations of resultsets is that they may not conform to the original data model. E.g., as shown in Figure 2, while the original resultset (T1 ) is in the relational model, demonstrating a clustering by attribute (T5 ) to the user would require us to break out of the relational space. Thus, we employ a two-space model (Figure 1): the choice of visual representations (and the underlying models) needs to be done carefully and with design principles in mind. Tversky et al. [26]’s analysis of the impacts of animation suggested two principles for successful animated graphics: ‚ Congruence Principle: The structure and content of the external representation should correspond to the desired structure and content of the internal representation. ‚ Apprehension Principle: The structure and content of the external representation should be readily and accurately perceived and comprehended. We use these principles as guiding factors in the design of the tweening space. Perception research has shown that
662
CSE 2
CSE 4
StudentId
EnrollmentYear
Dept
StudentId
EnrollmentYear
Dept
EnrollmentYear
Dept
EnrollmentYear
Dept
CSE
1
2012
CSE
1
2012
CSE
2012
CSE
2012
CSE
ECE
4
2012
CSE
4
2012
CSE
2012
CSE
2012
CSE
2012
ECE
ECE
2012
ECE
StudentId
EnrollmentYear
Dept
1
2012
CSE
4
2012
2
2012
Count
EnrollmentYear
Dept
2012
CSE
2012
CSE
2012
ECE
2012
ECE
2012
ECE
2013
CSE
2013
CSE
2
2
3
2012
ECE
2
2
2012
ECE
2012
5
2012
ECE
3
2012
ECE
3
2012
ECE
2012
ECE
2012
ECE
6
2013
CSE
5
2012
ECE
5
2012
ECE
2012
ECE
2012
ECE
10
2013
CSE
11
2013
CSE
6
2013
CSE
6
2013
CSE
2013
CSE
2013
CSE
12
2013
CSE
10
2013
CSE
10
2013
CSE
2013
CSE
2013
CSE
7
2013
ECE
11
2013
CSE
11
2013
CSE
2013
CSE
2013
CSE
2013
CSE
8
2013
ECE
12
2013
CSE
12
2013
CSE
2013
CSE
2013
CSE
2013
CSE
9
2013
ECE
7
2013
ECE
7
2013
ECE
2013
ECE
2013
ECE
2013
ECE
8
2013
ECE
8
2013
ECE
2013
ECE
2013
ECE
2013
ECE
9
2013
ECE
9
2013
ECE
2013
ECE
2013
ECE
2013
ECE
T1
T4
EnrollmentYear Count
2012
CSE
2
EnrollmentYear
Dept
Count
CSE
2
ECE
2013
CSE
3
ECE
4
CSE
3
ECE
3
4
3
2013
T7
T6
T5
ECE
CSE
3
2
ECE
CSE
2012
CSE
3
ECE
ECE
3
2012
3
2
EnrollmentYear
ECE
CSE
2012
3
2
2013
3
4
4
2013 2013
2
2012
2012
3
2012
4
3
EnrollmentYear
CSE
Dept
3
EnrollmentYear
ECE
EnrollmentYear
3
4
T3
T2
Count
ECE
CSE
3
4
2013
3
4
T12
2013
T8
T11
T10
T9
Figure 2: Tweening frames for motivating pivot example
users face challenges tracking more than four or five objects simultaneously [4]. Hence, a good tweening sequence should minimize the points of changes at each step. To this end, we make use of the Gestalt principle of common fate [25] as a design guide. This principle states that the entities in visualizations which move or function in a similar manner are perceived as a unit. An additional advantageous side effect of this design choice is a reduction in the number of reflows (Section 4.4). Given these design principles, we propose our two spaces. The first space, known as the standard space or query space, is where the user queries are expressed in SQL and follow the SQL data model. In the second space, known as the tweening space, we introduce intermediate steps that help communicate transitions to the user. The application of a tweening sequence (Section 3) on a resultset lifts the representation out of the standard space into the tweening space. The tweening space is characterized by visual cues such as highlights, gaps, etc. as described in the following section. Figure 2 shows the resultset visualizations in the tweening space. We can see how certain frames representing aggregation and cross-tabs are expressed using a nested relational model. A hierarchical representation is an intuitive way of showing groupings, but the relational model is not expressive enough to portray it. Hence, we use the nested relational model for representing resultsets during tweening. The rows, columns, and cells in a nested relation are indexed: the address for a table entity is derived by concatenating row/column indices of the entities containing it in order starting from the topmost row/column in the table hierarchy (Figure 3).
3.
Department Student Details ECE
CSE
ISE
StudentId
LastName
1
Lee
2
Watson
StudentId
LastName
6
Harvey
9
Quinn
11
Jane
StudentId
LastName
17
Benedict
r3c2r2c2
r3c1
r2c2r2
r4
r1 r3c2c1 Table Entity Indexing
Figure 3: Indexing table entities in tweening space. Indexes for the highlighted table entities are shown in the legend on the right with the cell background colors corresponding to the entities they index.
with visual cues can provide a principled way to encode tweening sequences. A resultset transformation because of a query change can be expressed as a sequence of transforms from the described grammar. These transforms encode the schema and data level changes to the resultsets in terms of basic row / column / cell-level changes such as insertion, deletion, and rotation. We include visual cues in these tweening sequences to make the transforms noticeable. A tweening sequence is an ordered set of microoperations which sufficiently describes a resultset transformation in terms of basic transforms. The micro-operations can be divided into the following two categories: 1. Transforms – These micro-operations change the data or the structure of the table e.g., row deletion. 2. Visual Cues – These micro-operations draw attention to the parts of the table about to change or provide a transformation description e.g., emphasize, annotation. The set of visual cues specified here provide examples which can be used to identify and interpret the transforms better. This set can be extended or the specifics of the implementation modified as per requirement.
GRAMMAR
We propose a standard representation that allows us to encode tweening sequences described in the previous sections (and illustrated in Figure 2). A well-defined visual grammar with micro-operations corresponding to basic structural data transforms across these representations, along
663
All micro-operations need a required positional parameter - positions, which specifies the table entities on which the micro-operation is supposed to act. The parameter can be a list of cells, rows, or columns. The table entities are indexed as described in Section 2 and Figure 3. The exact specification of this parameter depends on the type of micro-operation (Section 3.1 and 3.2). The relation to be transformed undergoes a series of stepby-step basic transformations during a tweening sequence. For example, S “ po1 , o2 , ..., oi , oi`1 , ..., on q represents a tweening sequence with n steps. The parameters for any microoperation oi in a tweening sequence are based on the result of its preceding micro-operation oi´1 . Let us consider T0 to be the original resultset which gets transformed into Tn through the tweening sequence. We use Ti to represent the resultset generated by application of micro-operation oi on Ti´1 during the tweening sequence.
3.1
Transforms
‚ order(positions) - Reorders the list of rows or columns in the order specified by positions. E.g., If Ti´1 has three rows, opiq “ orderprr3 , r1 , r2 sq micro-operation will reorder the rows such that the last row in the input becomes first in the output, and the first row becomes second in the output. The occlusion of table regions because of an animated sort would violate the apprehension principle (Section 2). Hence, this transform should be implemented as a static transform (repainting the entire table). ‚ rotate(positions, direction) - Rotates table entities or text specified by position by 90 degrees. The parameter in this case is specified as a key-value pair. The key is one of cellgroup or text which specifies if the rotate microoperation is to be carried out on a table block or text in specified cells. The value parameter is a list of cell indices. The direction parameter takes one value from {clockwise, counterclockwise} specifying the direction of rotation. ‚ delete(positions) - Removes the list of rows, columns, or cells specified by positions from Ti . ‚ insert(positions) - Inserts new rows, columns, or cells in Ti . The parameter is a list of key-value pairs. Each item in the list has the row index or the column index or the cell index where the new data is supposed to be inserted as the key. The value part contains the list of data values to be inserted at position specified by the key. ‚ nest(positions) - Merges entity groupings specified by list of items in positions. Each item in the list is an n-tuple which specifies cells or ranges of cells by their indices. Each item represents a group, and the constituent cells are replaced by a single cell by deleting borders between them with the common text filled in. ‚ unnest(positions) - Unnests groups into constituting tuples. The parameter is a list of key-value pairs, each item corresponding to one group. The key is the cell index to be unnested. The value field is a 2-tuple with the first value indicating the number of rows - nr , and second field indicating the number of columns - nc . The cell specified by key is split into nr ˆ nc cells, with each cell having the text value replicated from the original cell. It is trivial to demonstrate that the nested relations are closed under all these transforms.
3.2
defines the reason for highlighting. We recommend this micro-operation to be implemented as background color change, with well-separated colors for following causes insertion, deletion, aggregation. Highlights for insertion and deletion can be represented by one color each. Highlighting for aggregation requires a minimum of two colors. This is required to represent adjacent groups as visually distinct entities on screen. ‚ deemphasize(positions) - The inverse of emphasize microoperation. Removes the effects of the last emphasize micro-operation preceding it in the tweening sequence. ‚ annotate(positions, data, cause) - Some basic transforms are not obvious, and can benefit from additional information for a user to make sense of them. Annotations can operate on different levels, from cells to the entire table. The data parameter specifies what the user would be shown or how the annotation is supposed to be represented. For example before an order operation, we can show users a note with the name of the column on which the data is to be sorted and the order(ascending or descending) before playing the actual order micro-operation. ‚ separate(positions) - Creates gaps at the right borders (in case of columns) or bottom borders (in case of rows) of the entity indices listed in positions parameter. ‚ bridge(positions) - The inverse of separate micro-operation. Removes the gaps at the right or bottom borders depending on whether the specified entity type is row or column. Figure 4 illustrates examples of different micro-operations.
4.
TWEENING FRAMEWORK
The grammar provides a way to encode tweening sequences. We need a methodology to generate these sequences automatically for any transform corresponding to a SQL query change. We describe a system that generates a tweening sequence to represent the transition between two given SQL resultsets. We propose two ways to construct a tweening sequence for a resultset transformation: Result-based Tweening, and Query-based Tweening. Result-based tweening considers only the resultset changes to construct a tweening sequence, whereas query-based tweening considers both the query changes and the resultset changes.
4.1
Session Model
A query session is defined as a sequence of queries issued over a certain period of time, with the resultset of each query serving as feedback for the formation of the next query in the session. We impose the limit that queries in a session are required to have the same ‘FROM’ clause. At each step, the user views the results and performs another query on the dataset, with each intermediate result informing the next query (e.g., reviewing the results, factoring in external data, etc.). Thus, the task of tweening is that of presenting an intermediate explanation between each of the Qi and Qi`1 steps.
4.2
Result-based Tweening
It is possible to generate a tweening sequence between two SQL resultsets by comparing just the resultsets, and not considering the corresponding queries. We provide details for a naive result-based tweening algorithm based on grid/table diffing. The algorithm works at the level of rows and columns. Since we are considering only the resultset changes, the system does not have any knowledge of the
Visual Cues
‚ emphasize(positions, cause) - Highlights the table entities in Ti identified by positions. The cause parameter
664
Col1
Col2
Col3
A1
A2
A3
C1
C2
C3
deemphasize([r3])
Col1
Col2
Col3
A1
A2
A3
C1
C2
C3
insert([{r3:[B1, B2, B3]}, {r5:[B1, B2, B3]}])
Col1
Col2
Col3
Col1
Col2
Col3
Col1
Col2
Col3
A1
A2
A3
C1
C2
C3
C1
C2
C3
B1
B2
B3
A1
A2
A3
A1
A2
A3
C1
C2
C3
B1
B2
B3
B1
B2
B3
B1
B2
B3
order([r1, r4, r2, r5, r3])
Col1
Col2
Col3
Col1
Col2
Col3
Col1
Col2
Col3
C1
C2
C3
C1
C2
C3
C1
C2
C3
A1
A2
A3
A1
A2
A3
A1
A2
A3
B1
B2
B1
B2
B1
C2
Col3 C3
B2
B1
B2
rotate([{cellgroup:[ r1c2, r1c3, r2c2, r2c3 ]}])
Col1
C1
B3
Col2 Col3
Col2
B1
C3
C1
B2
B3
emphasize([r3, r4, r5], delete)
C2
Col1
B2
unnest([{r4c1:(2, 1)}])
rotate([{text:[r1c2, r1c3, r2c2, r2c3 ]}])
delete([r3, r4 , r5])
Col1
Col2
Col3
C1
C2
C3
nest([(r4c1, r5c1), (r4c3, r5c3)])
B1
separate([c1])
B2
B2
Col1
Col2
Col3
C1
C2
C3
B3
B3
Col1
C2
Col2
C1
C3
Col3
bridge([c1])
Col1
C2
Col2
C1
C3
Col3
Figure 4: Micro-operations in the Visual Grammar
database schema or the queries. Therefore, all transformations are treated as addition/deletion/reordering of resultset rows and/or columns. The transformation of a SQL resultset Told into resultset Tnew can be described by a sequence of micro-operations. After each micro-operation, the state of the resultset changes on screen. Let us call the resultset being transformed at any stage Ttween , which gets updated after every micro-operation. Initially Ttween is set to Told . A sequence of micro-operations is successively applied on Ttween to transform it into Tnew . A naive result-based tweening sequence can be described with a sequence of insert, delete, and order transforms (Section 3.1) on row / columnn level along with emphasize and deemphasize operations for visual cues (Section 3.2). The naive result-based tweening for a pair of resultsets Told and Tnew is carried out as follows: 1. Columns which are present in Told but not in Tnew are highlighted for deletion to give the initial Ttween , followed by deletion of the highlighted columns. 2. Rows which are present in Told but not in Tnew are now highlighted for deletion in resulting Ttween , followed by their deletion. For each row in the input and output table, a representative string is calculated by concatenating the common attributes in the order they appear in the input table. The rows in the input and output table are compared using their representative strings. 3. Rows which are present in Tnew but not in Told are now added to Ttween and highlighted. 4. Rows in Ttween are reordered to match that of Tnew 5. Columns which are present in Tnew but not in Told are now added to Ttween and highlighted. 6. Columns in Ttween are reordered to match that of Tnew It should be noted that the naive result-based tweening algorithm produces a unique tweening sequence for any pair of resultsets. This is because the order of micro-operations is fixed by the procedure described above. It is trivial to show that reordering these transforms in the sequence would lead to the same result. The described sequence is designed to show the addition/deletion of tuples on the common schema(common columns) between the input and output tables by deleting the columns which are not present in the output table first and then carrying out row transforms. With row transforms, the row deletions appear before row insertions because if new rows were added first, the system would have a larger table to search for the rows to be deleted
in the next step.
4.2.1
Tree Diff approach to Result-based Tweening
Even though the naive way of tweening resultsets described earlier is intuitive, and quite informative for basic transformations, it fails to capture complex transformations like nesting/unnesting or pivot, where the pivoting can only be represented as a reflection, transpose, or rotation of table cells. The tweening primitives described earlier cannot depict any of these three transformations. An alternative for generating tweening sequences can be developed by mapping resultsets to ordered trees. Minimum tree edit distance algorithms can be used to generate an optimum sequence of tree edit operations required for transforming a resultset to another [1]. The tweening micro-operations in this case can be described by the basic tree edit operations which are applicable to tree nodes, and hence would work on table-cell and table-row level. Cell-level transformation adds the capability of depicting transformations like transpose where transpose can be explained as sequence of node moves in the corresponding tree. We illustrate the tree-diff approach to result-based tweening by a sample transformation of a table T1 to another T2 by mapping the relational representation to an XML structure (Figure 5a), which can be be conceptually interpreted as an ordered tree. We use diffxml (http://diffxml.sourceforge.net/) utility to generate the required transformation/edit sequence (Figure 5b). The operations in the edit sequence are encoded in the Data Update Language format used by the diffxml utility. The XML nodes are named for the edit operations they describe- move, delete, and insert. The node attributes are XPath expressions referencing nodes in the source and destination XML documents. The charpos and length attributes describe the character position and string length for text nodes on which the described edit has to performed. The node move operations in the edit sequence will occlude the other parts of the table during tweening, which violates apprehension principle and is undesirable [8].
4.3
Query-based Tweening
There are certain issues with result-based tweening which can only be addressed by using query changes as context for generating tweening sequences. We list these issues followed by description of the query-based tweening framework.
665
StudentId EnrollmentYear GPA
StudentId EnrollmentYear GPA
2
2012
3.5
2
2012
3.5
1
2012
4
1
2012
4
5
2013
3.2
Even though a result-based tweening will generate the same tweening sequence as a query-based tweening, considering the query change in the query-based approach makes it possible for us to highlight the transformation cause in the tweening sequence. In this case, the visualization can show the users that rows r1 and r3 were deleted in Tnew because the value for ‘City’ column was ‘London’, not because they had ‘Smith’ for ‘LastName’. This can be achieved with the annotate micro-operation. Additionally, it is impossible for result-based tweening algorithms to accurately represent the row-to-row correspondence between Told and Tnew (Figure 7) [5]. If there exists a schema change between Told and Tnew , it is difficult to establish the lineage of data rows of Tnew from Told . For example, in Figure 7 we see row r1 in Told can correspond to either row r2 or row r3 in Tnew . For each row in Told , we assume the first matching instance in Tnew to correspond to it. If there are more than one matching instances, the others are treated as new rows. In this case, the row r3 is treated as a new row in Tnew , whereas row r2 is assumed to be the row r1 from Told .
T2
T1
(a) Mapping relational tables to XML structure
(b) Edit sequence to transform T1 to T2 Figure 5: An example of result-based tweening using tree diff approach.
RowIndex
FirstName
LastName
City
r1
Angelica
Smith
London
RowIndex
FirstName
LastName
City
r2
Sam
Lee
Berlin
r2
Sam
Lee
Berlin
r3
Sam
Smith
London
Tnew
Told
Aggregation and Pivot – There is no way for a resultbased tweening algorithm to identify aggregation transformation on a resultset, and the resulting nodes/cells with aggregate values will be treated as new nodes/cells or relabeled. This problem stems from the fact that representation of aggregation would require complete information about row-groupings and selection predicates which can only be obtained from corresponding queries. A result-based tweening for complex data transformations like pivot is misleading. It fails to capture, and hence represent, the important steps which constitute the pivot transformation namely aggregation and rotation/reflection. As shown in Figure 8, the naive result-based tweening fails to convey any visual cues which might indicate that the described transformation is pivot. An alternative result-based tweening sequence can be constructed using the tree diff approach. However, even that cannot portray the aggregation step in the tweening sequence, which is one of the crucial parts of a pivot transformation. High Visual Cost – With tree diff algorithms, many transformations are carried out on the table cell level. This increases the number of tweening steps that are needed for describing any transformation. Moreover, with move operations, there will be a high number of table-entity cross-overs resulting in occlusion of table regions if they are shown as cell swaps on screen. This can be seen in Figure 5 where a simple table transformation requires a relatively large number of tree node edits. Lineage – A result-based tweening can only show what changed in the resultset but it cannot describe why the particular changes occurred, i.e., it cannot describe what changed in the query. For example, consider a basic ‘SELECTION’ transformation from Told to Tnew represented in Figure 6. This transformation corresponds to the following query changes in the session:
Figure 6: Ambiguous transformation cause RowIndex
EmployeeId
FirstName
City
r1
200159
Sam
Berlin
r2
131256
Angelica
London
Told
RowIndex
FirstName
Department
r1
Angelica
Engineering
r2
Sam
Finance
r3
Sam
Engineering
Tnew
Figure 7: Ambiguous data lineage in a transformation
In contrast to the result-based tweening, where we have a single fixed tweening sequence for all transformations, querybased tweening is generated from a rulebase with rules of the following form:p ñ po1 , o2 , ..., on q. The rule antecedent p is defined as the change in query ∆Q “ Qnew ´ Qold . The rule consequent po1 , o2 , ..., on q is an ordered set of micro-operations from our defined grammar. Each of these micro-operations is a function of the resultset change for the transformation ∆T “ Tnew ´ Told , and ∆Q . A fixed rulebase is sufficient to describe all transformations. This is because all query changes can be represented as a combination of one or more SQL clause changes. Moreover, each type of SQL clause change entails a fixed sequence of tweening micro-operations. Hence we only need to describe tweening sequences for all possible changes in each clause. The combination of clause changes can be expressed as a concatenation of sequences for all the changes.
4.3.1
Rulebase for Query-based Tweening
Table 1 shows the tweening sequences for the basic clause changes between two SQL queries. We have included only the transforms in the tweening sequences. There are standard visual cues defined for each transform, which are inserted in the sequences in Table 1 at proper places as per the following rules: ‚ delete is preceded by emphasize, and followed by deemphasize on the table entities on which delete is to be applied. ‚ insert is followed by emphasize, and then deemphasize on the newly inserted table entities.
Q_old = SELECT FirstName , LastName , City FROM Employee ; Q_new = SELECT FirstName , LastName , City FROM Employee WHERE City ‘ London ’;
666
StudentId
EnrollmentYear
Dept
StudentId
EnrollmentYear
Dept
EnrollmentYear
EnrollmentYear
EnrollmentYear
1
2012
CSE
1
2012
CSE
2012
2012
2012
4
2012
CSE
4
2012
CSE
2012
2012
2013
2
2012
ECE
2
2012
ECE
2012
2012
3
2012
ECE
3
2012
ECE
2012
2012
5
2012
ECE
5
2012
ECE
2012
2012
EnrollmentYear
ECE
CSE
6
2013
CSE
6
2013
CSE
2013
2013
2012
3
2
10
2013
CSE
10
2013
CSE
2013
2013
2013
3
4
11
2013
CSE
11
2013
CSE
2013
2013
12
2013
CSE
12
2013
CSE
2013
2013
7
2013
ECE
7
2013
ECE
2013
2013
EnrollmentYear
ECE
CSE
8
2013
ECE
8
2013
ECE
2013
2013
2012
3
2
9
2013
ECE
9
2013
ECE
2013
2013
2013
3
4
T1
T3
T2
T4
T5
T6
T7
Figure 8: Result-based tweening for pivot transformation
‚ order is preceded by annotate showing a note with sorting column, and order(ascending or descending). The more complex changes in the queries are treated as follows: ‚ A change in GROUP BY clause is treated as a removal of a GROUP BY clause followed by an insertion of a new GROUP BY clause. ‚ A change in HAVING clause between two aggregation queries is treated as removal/insertion of row groups similar to change in WHERE clause for queries which do not involve aggregation. ‚ In cases where the second query is a pivot query, the transition is played in following sequence: Told Ñ Tstaging Ñ Tnew . The resultset Tnew represents the resultset corresponding to the pivot query. Tstaging is the resultset corresponding to a simple aggregation query Qstaging over the base relation. The aggregation column and the aggregation measure is the same as that in the pivot query. For instance for a pivot query Qnew , we specify the staging query as Qstaging .
5. Move individual group headers to table column headers using a delete followed by an insert (T10 Ñ T11 ). 6. Merge along all separated boundaries using merge (T11 Ñ T12 ). Input: Qold , Qnew Output: Qissue if typepQold q ‰ aggregate and typepQnew q ‰ aggregate then Qissue ÐÝ Qnew end else if typepQold q ‰ aggregate and typepQnew q “ aggregate then if Qold Ă disaggpQnew q then Qissue ÐÝ disaggpQnew qelse if disaggpQnew q Ă Qold then Qissue ÐÝ H else Qissue ÐÝ Qold Y disaggpQnew q end else if typepQold q “ aggregate and typepQnew q ‰ aggregate then if disaggpQold q Ă Qnew then Qissue ÐÝ Qnew else if Qnew Ă disaggpQold q then Qissue ÐÝ disaggpQold q else Qissue ÐÝ disaggpQold q Y Qnew end else if disaggpQold q “ disaggpQnew q then Qissue ÐÝ disaggpQold q else if disaggpQold q Ă disaggpQnew q then Qissue ÐÝ disaggpQnew q else if disaggpQnew q Ă disaggpQold q then Qissue ÐÝ disaggpQold q else Qissue ÐÝ disaggpQold q Y disaggpQnew q end return Qissue Algorithm 1: Query Issue Check
Qnew : SELECT * FROM ( SELECT EnrollmentYear , Dept FROM S t u d e n t E n r o l l m e n t E ) PIVOT ( COUNT ( Dept ) FOR Dept IN ( " ECE " , " CSE " )) Qstaging : SELECT EnrollmentYear , Dept , COUNT (*) FROM S t u d e n t E n r o l l m e n t E GROUP BY EnrollmentYear , Dept
The tweening Told Ñ Tstaging is governed by the rulebase described in Table 1. We describe the Tstaging Ñ Tnew transition with the help of the motivating pivot example tweening shown in Figure 2. This stage can be seen in the transition from T7 to T12 . In this example Count column is the aggregation measure, Dept column is the pivot column, and Y ear is the non-pivot column. The transitionTstaging Ñ Tnew is designed as follows (Pointers to each step in the Figure 2 example are provided): 1. Express groupings on non-pivot column using an emphasize followed by nest on non-pivot column cells followed by separate to differentiate groups and column headers (T7 Ñ T8 ). 2. Separate non-pivot column out, and mark column headers for pivot column and aggregation measure for deletion (T7 Ñ T8 ). 3. Rotate cell-blocks of groups under pivot-column, and aggregation measure using rotate (T8 Ñ T9 ). 4. Rotate text in the cells rotated in previous step using rotate (T9 Ñ T10 ).
4.3.2
Query Rewriting for Meaningful Tweening
Constructing tweening sequences for most changes through concatenation is trivial. However, in certain cases where at least one of Qnew and Qold is an aggregation query, the results of just these two queries can’t provide enough data to produce meaningful tweening. We consider tweening sequences which convey all the information about construction of aggregation from constituent tuples as ‘meaningful ’.
667
Table 1: Query-based tweening rulebase
Differing Clause SELECT WHERE
Change
GROUP BY
New Group By Clause
GROUP BY
Removed Group By Clause
Tweening Sequence delete(columns), insert(columns), order(columns) delete(rows), insert(rows), order(rows) order(rows), highlight(rows, cause=aggregation), insert(aggregateColumn), separate(groups), nest(rows), bridge(groups) delete(aggregateColumn), unnest(rows)
We introduce a check before issuing queries to the backend to verify if the query being issued would fetch a resultset that is sufficient to animate the transition to it from the previous resultset in the session. For cases we know where it would not be possible to provide a meaningful transition with the new resultset, we replace the query with an alternative query without the aggregation clause, and then perform the required aggregation on client along with tweening. This is true for pivot queries as well. If we do not have the pivot aggregation as the preceding query in session, we replace the pivot query with the statement to fetch all contributing rows, and perform the aggregation and pivoting on client along with tweening (as described in the previous section). The query issue check algorithm is detailed in Algorithm 1. The function disagg(Q) represents the SQL query which would return the constituent tuples forming the resultset corresponding to query Q. To construct disagg(Q), we simply need to strip the group-by clause from Q and substitute the aggregate-function(measure) part in select clause of Q with measure. The algorithm checks if one or both of the queries are aggregate queries. If both of them are not aggregate queries, then it proceeds normally with the tweening rulebase described in the previous sub-section. However, if one or both of the queries are aggregate queries, it proceeds to check for containment. A query Q1 is said to be contained in query Q2 , if irrespective of the underlying database, the result of Q1 is a proper subset of the result of Q2 [23]. The relationship between Q1 and Q2 is represented as Q1 Ă Q2 . The algorithm issues the corresponding dissagregation query of either Qnew or Qold , whichever contains the other. In case there’s no efficient way of evaluating the containment or the two queries cannot be described by a containment relation, the algorithm issues a union of disaggregation queries of both Qold and Qnew . The union of two queries Q1 and Q2 refers to a query Q which would fetch a result R “ R1 Y R2 , where Ri represents the result of query Qi . It is trivial to show that Q contains both Q1 and Q2 . Correctness Proof: We need to show that Algorithm 1 always issues a query Qissue which would fetch the resultset that has all the tuples required to generate a meaningful tweening from Rold to Rnew , where Rold corresponds to the result of Qold and Rnew corresponds to the result of Qnew . To show a tweened removal/addition of a group-by clause from/to an aggregate query Q, we need to fetch the resultset corresponding to disagg(Q). Hence, it is sufficient to show that for the Algorithm 1 to be correct, Qissue “ disaggpQold qYdisaggpQnew q for all possible cases. Since the corresponding resultselt would have all the tuples to show aggregation/disaggregation to/from Rold and Rnew . By the earlier definition of disagg, for a query Q without an aggregation clause: disaggpQq “ Q (1)
Evaluating the expression disaggpQold q Y disaggpQnew q for each scenario described in the Algorithm 1, and simplifying the expression by using equations 1 and 2 wherever applicable, we can see that Qissue “ disaggpQold qYdisaggpQnew q for all scenarios except one. The exception is for the case where disaggpQold q Y disaggpQnew q evaluates to Qold , and the algorithm sets Qissue to null. This is because Qold has already been evaluated by the system and its result is available so it does not need to be issued again.
4.4
For a pair of queries Q1 and Q2, if Q1 Ă Q2 then: Q1 Y Q2 “ Q2
Optimizing Tweening Sequence for Reflows
Reflow is the user-blocking UI process for re-calculating the positions of elements on screen. Tweening sequences cause reflows for every operation which changes the structure of the table. It might be possible for us to reduce the reflow time by reordering the rows before certain insertions and deletions. We aim to reduce the number of points of structural changes in the table for reflow-optimization. This works because the UI would have to recalculate positioning of fewer blocks with fewer points of changes. Note that the ‘order’ operation is supposed to be implemented as a static transformation as opposed to an animated one unlike the other grammar micro-operations. To optimize a generated tweening sequence for reflows, we insert the following procedure before each row-level transforms in the tweening sequence as it is played out: 1. Find an ordering of rows which would result in least number of contiguous row blocks to be transformed by the following micro-operation in the tweening sequence. 2. Insert an order micro-operation in the sequence to achieve this ordering. The ordering in the first step is found out by trying out a sort on each sortable column. It is feasible to try out a sort on each column as the table size is limited by the screen size. The mechanism to find the best ordering can be configured to work by sorting on more than one column at once. However, this can blow up the search space quickly. For example, a table with N sortable columns would need only N sorts if we used single column sorts. The same table would need N ` NP2 sorts if we checked all the two-column pairs for sort along with single column sorts. The queries can be used to determine suitable sorting candidates. In case the where clause has continuous range conditions, we use the where-clause columns to determine the appropriate sorting order. For example, in figure 9, sorting by the year column on which the where predicate is defined gives the desired tweening sequence. An additional benefit of designing tweening sequences for reduced reflows is that the operations now have positional parameters in contiguous blocks, i.e., we have groups of rows getting inserted to/deleted from the table instead of the changes being scattered across the table. This makes it easier for the user to track changes, as described earlier in Section 2. Figure 9 shows an example of reflow optimization. The insertion of an order microoperation in the original sequence changes the number of contiguous blocks of table undergoing change from 3 to 1.
(2)
668
Album
Year
A Head Full of Dreams
2015 3.52
Rating
Album
Year
A Head Full of Dreams
2015 3.52
A Rush of Blood to the Head
2002 3.50
A Rush of Blood to the Head
2002 3.50
Ghost Stories
2014 3.02
Mylo Xyloto
2011 3.28
Parachutes
2000 2.57
Ghost Stories
2014 3.02
Mylo Xyloto
2011 3.28
Parachutes
Viva la Vida
2000 2.57
2008 2.60
Viva la Vida
2008 2.60
X&Y
2005 2.37
X&Y
2005 2.37
emphasize( [r2, r4, r5 , r7], cause= ‘delete’)
5.
Rating
delete([r2, r4, r5 , r7])
Album
Year
Parachutes
2000 3.52
A Rush of Blood to the Head
2002 3.50
X&Y
2005 3.02
Tnew
Told Qold = SELECT Album, Year, Rating FROM Table ORDER BY Album
5.1
Qnew = SELECT Album, Year, Rating FROM Table WHERE YEAR < 2007
Year
Rating
A Head Full of Dreams
2015 3.52
A Rush of Blood 2002 3.50 to the Head
o1, o2
Album
Year
Rating
Album
Year
Rating
Parachutes
2000
3.52
Parachutes
2000
3.52
A Rush of Blood to the Head
2002
3.50
A Rush of Blood to the Head
2002
3.50
X&Y
2005
3.02
X&Y
2005
3.02
Viva la Vida
2008
3.28
Viva la Vida
2008
3.28
o3
Ghost Stories
2014 3.02
Mylo Xyloto
2011 3.28
Mylo Xyloto
2011
2.57
Mylo Xyloto
2011
2.57
Parachutes
2000 2.57
Ghost Stories
2014
2.60
Ghost Stories
2014
2.60
Viva la Vida
2008 2.60
2015
2.37
2.37
2005 2.37
A Head Full of Dreams
2015
X&Y
A Head Full of Dreams
o4
Album
Year
Parachutes
2000 3.52
ORDER BY YEAR ASCENDING
Told
Rating
A Rush of Blood 2002 3.50 to the Head
X&Y
2005 3.02
Tnew
o1 = order([r1, r6, r3, r8, r7, r5, r4, r2]) o2 = annotate(order, {column: Year, order: Ascending} ) o3 = emphasize([r5, r6, r7, r8], cause = ‘delete’) o4 = delete([[r5, r6, r7, r8]])
(b) Tweening sequence optimized for reflows Figure 9: Optimizing tweening sequence for reflows using row reordering
4.5
User study design
The user studies were designed to validate our system and to test the following hypotheses: ‚ Tweening does not negatively affect users’ understanding of transformations ‚ Tweening helps understand and retain changes during basic transformations, and chains of basic transformations. ‚ Tweening helps understand and learn complex transformations. The first two user studies were deployed as online surveys on Amazon Mechanical Turk (Section 5.2 and Section 5.3). The pivot user study (Section 5.4) was designed as an inperson user study. The number of subjects surveyed is reported in each experiment, and statistical test results are also provided.
(a) Original tweening sequence
Album
EVALUATION
It is important to provide empirical evidence that tweening does not hurt users’ understanding of resultset transformations, and helps them gain knowledge from otherwise hard-to-comprehend transformations. We conducted user studies for objective evaluation of tweening [13].
Rating
Backtracking for low cost tweening
5.2
We define the total number of contiguous row/column/cell blocks which undergo a transformation throughout the tweening sequence as the visual cost of tweening. In certain circumstances, the visual cost of tweening between two successive queries may be significantly higher than tweening from a prior query in the session. At this point, it might be easier to simply ‘backtrack’ to a previous query/result pair, and then tween to the new query. For example, consider a query session given by the ordered set tQ1 , Q2 , Q3 u. It may not be possible to merge these queries, since the intermediate result may inform the next query. Thus, tweening between each of the Qi and Qi`1 is useful. Now, there might also be cases where the user backtracks, or makes slight modifications. E.g.,
Basic transformation identification
This study was designed to confirm the hypothesis that “tweening does not negatively affect users’ understanding of transformations.”, observing whether people can identify the basic relational algebra operation or the SQL clause change when shown a representative tweening sequence corresponding to it. For relational algebra operations, the users were tasked with identifying the underlying relational algebra operation from one of these three - selection, projection, and aggregation. For SQL clause change, the users were asked to identify the SQL clause which changed between the input and output query. In addition, they were also asked to frame the corresponding SQL query for the transformation. The users were also asked for a text description of the transformation, and whether the tweened transformation helped them arrive at an answer more quickly. To target users that were familiar with data transforms, we included two additional questions to evaluate a user’s familiarity with SQL. Both the qualification questions required the user to frame the SQL query which would generate a given resultset from the provided relation. The response to these questions were used as a qualification criterion, and the rest of a user’s response was evaluated only if they correctly answered these two questions. The results for these studies are shown in Table 2.
Q1 = SELECT COUNT (*) FROM TABLE WHERE x > 4;
followed by a generalization of the selection clause, probably because of fewer data points than expected. Q2 = SELECT COUNT (*) FROM TABLE ;
followed by Q3 = SELECT COUNT (*) FROM TABLE WHERE x > 3;
It is possible that there is only one row in TABLE with value of 3 ă x ď 4, and hundreds of rows with value of x ď 3. In this case tweening from T2 will involve dropping hundreds of rows, whereas tweening to T3 from T1 will involve addition of just one row. If we consider the number of table entities changing in a tweening sequence as its visual cost, the tweening from T2 to T3 is around two orders of magnitude costlier than tweening from T1 to T3 . In cases like this, it might make more sense to backtrack to the resultset T1 from T2 , and then tween to T3 . Otherwise it would involve two consecutive tweening sequences countering each other, and both with equally high cost. A similar case can be explained in the context of interactive map exploration. The user might be zoomed into a particular state, and finds it to be of no interest, and decides to focus on another far off state. It is intuitive that a zoom-out followed by a zoom-in to the new state of interest would be preferred over a long panning motion.
Table 2: Basic transformation identification Type of trans- # Users with correct Users who formation users operation or query found identification animation helpful Selection 50 50 49 Projection 50 50 48 Aggregation 50 50 42 Change in SE- 50 49 46 LECT Change in 50 50 49 WHERE
These studies indicate that it is trivial for users familiar with relational algebra or basic SQL to identify transformations when they are animated. Most of the users found the tweening to be helpful in identifying the operation thereby
669
12
validating the tweening sequences generated by our system as a good representation of the operations. This study confirms our hypothesis “tweening does not negatively affect users’ understanding of basic transformations”.
5.3
Clarity
Understandability
10
Ra.ng
8 6 4
Quantifying changes studies
2
To test the hypothesis that “tweening helps understand and retain changes during basic transformations”, we showed a group of users resultset transformations resulting from basic query changes. We randomly split the users into two groups with 50 users in each. The non-tween group was shown just the input and output tables of the transformation without intermediate visual steps, while the tween group was shown a tweened version of the same transformation. The users were asked quantitative questions about the changes in the transformation corresponding to the query change such as ‘how many rows were deleted’ in the case of a where clause change. For each question, users were assigned a score based on the absolute difference between their response and the true value. The total user score was calculated as the sum of such differences across all questions. Thus a lower score indicates better performance on the task. We ran a Mann-Whitney U test to analyze the score distributions between the two groups. We chose this test as the scores do not follow an approximately normal distribution and the observations in both groups are independent of each other [16]. Table 3 shows the test statistics for a one-tailed test corresponding to the null hypothesis H0 : P pT ă N T q “ P pT ą N T q and alternative hypothesis Ha : P pT ă N T q ą P pT ą N T q where P pT ą N T q denotes the probability of a score from the tween group exceeding a score from the non-tween group. The results for this study support our hypothesis that tweening helps the user retain changes in a transformation. The test statistics show that the difference in the tween and non-tween groups was statistically significant for a significance level of α “ 0.01. To test how tweening affects a user’s understanding of a chain or sequence of basic transformations, we replaced the basic transformations in the previous study with a composite transformation. The transformation involved selection on the basis of two different columns, followed by a projection, and then an aggregation. We asked the users the same questions as that in the earlier study. These questions are about the structural information about the transformations, concerned only with the transforms and the table entity (rows/columns) positions. Another important aspect of a data transformation is the semantic aspect, which can be defined as the encoding of table entities (rows/columns) in terms of the containing data values. Specifically, this entails identification of transforming columns and the shared data characteristics between transforming rows. In order to ascertain whether tweening increases the semantic information gained from a data transformation, we asked the users to identify the selection criteria for filtering rows in the transformation chain described above. The initial selection in the transformation chain filtered out tuples based on the data values of two columns. In addition to that, tuples from the base relation which satisfied a certain criteria on the data values of one of the columns were added which were not present in the initial resultset. The users were asked to identify these criteria on the basis of which rows were deleted or inserted in the first transformation in the chain. For each correctly identified criterion, 1 point was awarded.
0 1
2
3
4
5
6
7
8
9
10
11
12
13
14
15
16
17
18
19
20
User
Figure 10: User rating for pivot tweening Table 3: Mann-Whitney U test for quantifying changes task - basic transformations. The U statistic shows the number of times observations in one group precede observations in the other, when all scores are placed in ascending order. (p ă α) denotes statistical significance. Type of query change / Ques- Test statistics (p ă α)? tions Change in SELECT clause U “ 547.5, p “ Yes 1. Number of columns dropped 1.026 ˆ 10´9 2. Number of columns added Change in WHERE clause U “ 466, p “ Yes 1. Number of rows dropped 3.998 ˆ 10´9 2. Number of rows added Change in GROUP BY clause U “ 789, p “ Yes 1. Number of rows constitut- 4.79 ˆ 10´4 ing a group Table 4: Mann-Whitney U test for quantifying changes task - chain of transformations Questions Test statistics (p ă α)? Structural info. questions U “ 414, p “ Yes 1. Number of rows dropped 3.863 ˆ 10´9 2. Number of rows added 3. Number of columns dropped 4. Number of columns added 5. Number of rows constituting a group Semantic info. questions U “ 528, p “ Yes 1. Row deletion criteria 1.613 ˆ 10´7 2. Row insertion criteria
For the analysis of the responses we used the same null and alternative hypotheses as the previous study and conducted a one-tailed test. The Mann-Whitney U test statistics are provided in Table 4. The test statistics reveal the difference between the score distributions of the tween group and the non-tween group is statistically significant for α “ 0.01.
5.4
Pivot study
To test the third and final hypothesis – “tweening helps understand and learn complex transformations”, we had to design studies that incorporated tweening animations for a complex transformation. Given the anecdotal observations discussed in the introduction, we considered pivot to be a complex transformation for people to identify or work with, given the large and unintuitive schema and data changes involved. We verified this assumption through a user survey in which we asked 221 people about their experience/knowledge of the pivot transformation. Only 58 of them said they could pivot a table as per given specification. 201 of these users were workers from Amazon Mechanical Turk. The other 20 were undergraduate and graduate students from different backgrounds who participated in an in-person user study in which they had to rate our pivot tweening sequences for clarity and understandability on a scale of 0 ´ 10. In addition, we asked them to specify if the tweening helped them understand the Pivot
670
transformation. Figure 10 shows the rating for pivot tweening by each user. 18 out of the 20 users we surveyed found tweening helpful in understanding Pivot. The users gave the tweening sequence a mean rating of 8.225 for clarity with a standard error of 1.24. For understandability, the tweening sequence got a mean rating of 8.475 with a standard error of 1.31. Hence, from this study it can be concluded users find tweening helpful in understanding complex transformations.
5.5
nance) and their applications. We visualize all three provenances of records in a resultset while tweening a transformation. Ragan et al. [18] present an organizational framework for different types of provenance(data, visualization, insight, interaction, rationale) in visual analytics. In this work, while we only visualize data provenance and make use of data/interaction provenance for tweening sequence optimizations, there is tremendous scope to build more provenance capabilities upon our framework. Diffing heuristics: There are several methods in literature to effectively find deltas between structured data. Peters’ [14] survey of change detection in XML trees can be directly applied to the DOM trees of the new and old resultsets for web based query interfaces. Zhang and Shasha [10] provide fast algorithms for finding the edit distance between two trees, which is equivalent to finding the delta between two consecutive resultset DOM trees in a query session. Facebook’s React (https://facebook.github.io/react/) uses heuristics to further reduce this complexity from O(n3 ) to O(n). Impact of Animation: There is a significant body of work studying and motivating the role of animation in user interfaces. Gonzalez [7] established through user studies that smooth, realistic, and interactive animations can facilitate decision making. Heer and Robertson [8] studied the effects of animated transitions in graphical perception of changes between statistical data graphics. Their findings suggest animated transitions are favored by users even in the cases where they do not significantly aid in perception of changes, heavily motivating our work. Tversky et al. [26] present the conditions required for animated graphics to be better than their static counterparts, and proposed the congruence and apprehension principles for building successful animated graphics, which we follow. Robertson et al. [20] justify the use of animation, remarking that “user interfaces must maintain continuity as abrupt transitions cause a momentary sense of disorientation in users.” While these principles and insights are designed for graphical animations, there has not been any work studying applicability of these principles to structured information, which this paper investigates. Animation and Visualization techniques: Wu et al. [28] presented animation techniques to visualize focus and context regions in volumetric data, and their 3D relationships. Wittenberg and Sigman [27] used variable font scaling and color to accomplish visual emphasis in their animated transitions for Web Information Treeviewer. Building upon this work, we use visual cues such as colors, action annotation, and directional arrows alongside animation to highlight regions of focus, and positional layout of the animation to establish context and data lineage. Temporal data visualization: Kim and Cova [12] introduced a rule-based grammar for interpolating between discrete temporal snapshots of geographic processes. They use a generalized set of process-informed rules to provide a tweening sequence in a better geographical context. Our tweening grammar is a rule-based grammar where the rule antecedent is the change or delta between two consecutive queries. Tweening in query sessions can be thought of as event-based visualization in case they involve a human-inthe-loop. Muller and Schumman [15] in their work present a study of visual exploration of time-dependent or event-based data using aforementioned visualization techniques.
Performance Experiment
We evaluated the efficiency of our tweening sequence generation framework for two OLAP workloads. Configuration: Workloads were executed on a web app running an in-memory database set up with sql.js – a JavaScript port of SQLite (https://github.com/kripken/sql.js/). Performance was recorded inside Google Chrome running on a Ubuntu 16.04 PC (Intel Core i7-6500U CPU, 12GB RAM). Datasets and Workloads: We ran our performance experiment on two datasets - IPUMS, and Datacenter. Datacenter conforms to the motivating example in [11], with a table events (3 dimensions, two of which are hierarchical): location[zone:datacenter:rack], time[month:week:hour], iops The table comprises of 1000 generated tuples. The workload run against this dataset is a concatenation of 5 user query sessions from the DICE user studies, with 10 aggregate queries in each session. The IPUMS dataset is based on the Integrated Public Use Microdata Series, International and uses a 2000 unit sample extracted from the 1980 US census IPUMS[22]. The database table consists of 4 dimensions, 3 of which are hierarchical: city[region:state:city], race[mrn:racegroup:race], sex, occupation[category:subcategory:branch:occupation] A workload with an exploratory user query session of 13 aggregate queries against this dataset was generated using the CubeLoad [19] parametric OLAP workload generator. The table size used for studies is well over the number of rows displayable on a regular screen without visual clutter. Results: For both workloads, we ignore the execution of the 1st query as the first result in the query session is not tweened. The total time taken for execution of rest of the queries along with tweening sequence generation is compared against the total time taken for the execution of queries without tweening. The execution times are averaged over 5 runs. For IPUMS, the total time required for workload execution with tweening is 830.7 ms – 57.11 ms more than without tweening. Tweening adds on an overhead of about 7.3 percent. The average query execution time goes up from 64.47 ms to 69.23 ms which is low enough to maintain interactivity. For Datacenter, the total time taken for query execution without tweening is 747.91 ms. Tweening adds a 2.63 percent overhead to make the total execution time 767.55 ms. The average query execution time goes up from 15.26 ms to 15.66 ms, showing little change. This validates that our approach of tweening generation can provide substantial benefits without sacrificing interactivity.
6.
RELATED WORK
While our research focuses on solving a core database problem, we build our ideas upon a wide body of literature, ranging from data-focused research in provenance and data diffing to animation and visualization research. Provenance Visualization: Cheney et al. [5] describe the notion of provenance (“why”, “how”, and “where” prove-
671
7.
CONCLUSION AND FUTURE WORK
8.
REFERENCES
[1] Bille, Philip. A Survey on Tree Edit Distance and Related Problems. TCS, pages 217–239, 2005. [2] M. Bostock et al. D3 Data-Driven Documents. TVCG, pages 2301–2309, 2011. [3] Catmull, Edwin. The Problems of Computer-assisted Animation. SIGGRAPH, pages 348–353, 1978. [4] P. Cavanagh et al. Tracking Multiple Targets with Multifocal Attention. Cognitive Sciences, pages 349–354, 2005. [5] J. Cheney et al. Provenance in Databases. Foundations and Trends in Databases, pages 379–474, 2009. [6] R. Ebenstein et al. FluxQuery: An Execution Framework for Highly Interactive Query Workloads. SIGMOD, pages 1333–1345, 2016. [7] Gonzalez. Does Animation in User Interfaces Improve Decision Making? SIGCHI, pages 27–34, 1996. [8] Heer, Jeffrey and Robertson, George G. Animated Transitions in Statistical Data Graphics. TVCG, pages 1240–1247, 2007. [9] Idreos, Stratos and Liarou, Erietta. dbTouch: Analytics at your Fingertips. CIDR, 2013. [10] Kaizhong Zhang and Dennis Shasha. Simple Fast Algorithms for the Editing Distance between Trees and Related Problems. SIAMJC, pages 1245–1262, 1989. [11] N. Kamat et al. Distributed and Interactive Cube Exploration. ICDE, pages 14–25, 2014. [12] T. H. Kim et al. Tweening Grammars: Deformation Rules for Representing Change between Discrete Geographic Entities. CEUS, pages 317–336, 2007. [13] R. Kosara et al. Thoughts on User Studies: Why, How, and When? CGA, pages 20–25, 2003. [14] Luuk Peters. Change Detection in XML Trees: a Survey. 3rd Twente Student Conference on IT, 2005. [15] M¨ uller, Wolfgang and Schumann, Heidrun. Visualization Methods for Time-dependent Data-an Overview. Winter Simulation Conference, pages 737–745, 2003. [16] Nachar, Nadim. The Mann-Whitney U: A Test for Assessing whether Two Independent Samples. Quant. Methods for Psychology, pages 13–20, 2008. [17] Nandi, Arnab and Jiang, Lilong and Mandel, Michael. Gestural Query Specification. VLDB, pages 289–300, 2013. [18] E. D. Ragan et al. Characterizing Provenance in Visualization and Data Analysis. TVCG, pages 31–40, 2016. [19] S. Rizzi et al. CubeLoad: A Parametric Generator of Realistic OLAP Workloads. AISE, pages 610–624, 2014. [20] G. G. Robertson et al. Information Visualization Using 3D Interactive Animation. Communications of the ACM, pages 57–71, 1993. [21] Root, Christopher and Mostak, Todd. MapD: A GPU-powered Big Data Analytics and Visualization Platform. SIGGRAPH, pages 73–74, 2016. [22] S. Ruggles et al. Integrated Public Use Microdata, 2004. [23] Sagiv, Yehoshua and Yannakakis, Mihalis. Equivalences Among Relational Expressions with the Union and Difference Operators. JACM, pages 633–655, 1980. [24] Shneiderman, Ben. Direct Manipulation: A Step Beyond Programming Languages. Sparks of innovation in HCI, page 17, 1993. [25] Todorovic, Dejan. Gestalt principles. Scholarpedia, 2008. [26] Tversky, Barbara and Morrison, Julie Bauer and Betrancourt, Mireille. Animation: Can It Facilitate? IJHCS, pages 247–262, 2002. [27] Wittenburg, Kent and Sigman, Eric. Visual Focusing and Transition Techniques in a Treeviewer for Web Information Access. IEEE SVL, pages 20–27, 1997. [28] Y. Wu et al. Focus+ Context Visualization with Animation. AIVT, pages 1293–1302, 2006.
In this paper, we introduce the concept of data tweening, and detail a framework for the incremental visualization of SQL resultset transformations that considers both the resultsets and the queries in the session. Through controlled user studies, we demonstrate that tweening helps users gain more information about data transforms as compared to the standard visualization. While the inclusion of new visual feedback is a concern, we discovered that tweening does not negatively affect the users’ understanding. Additionally, we verified that generating tweening sequences during a query session execution does not add a significant overhead. We began with establishing the need for animation in resultset transformations, especially for highly interactive direct manipulation interfaces. We designed a visual grammar based on established graphics and animation design principles, and developed a framework to automatically interpolate between resultsets and generate tranformation sequences based on changes in the resultsets, using the visual grammar. Further, we were able to generate better tweenings by considering not just the changes in the resultsets, but also looking into changes in the query itself. We then conducted user studies to verify the efficacy of tweening in correct portrayal of transformations, and its advantages over standard visualization of transforms. We found significant advantages of tweening over standard transformation visualization, with a majority of the users preferring tweening over standard visualization. Users found tweening helpful in understanding a complex transformation – the pivot operation, most of them citing “highlighted groupings” and “breaking down into simpler steps” as primary reasons. We conducted a performance experiment to establish that tweening sequence generation can be performed without hampering system’s interactivity during a query session. For two different OLAP workloads, we compared the total execution time of queries with and without tweening. We found that introducing tweening increases the overall execution time by a small fraction. A natural follow-up for this work would be tweening for very large resultsets. The grammar provided here works well for data that fits on screen, with ample space to accommodate changes in layout because of operations like ‘separate’ and ‘rotate’. One way to handle large resultsets would be to provide template tweening sequences for a smaller sample of the resultset and providing visual generalization cues for the rest of the resultset. The template tweening sequence will have to satisfy the following constraints: ‚ The maximum number of tuples in any of the intermediate resultsets in the tweening sequence cannot exceed a certain number which is limted by the screen size ‚ The sequence of micro-operations in the template tweening sequence should be the same as that in the original tweening sequence (tweening sequence with no screen size constraint) We also plan to study the difference in user performance and satisfaction for data analysis tasks on direct manipulation based query specification interfaces with and without tweening. Acknowledgements We acknowledge the support of the U.S. National Science Foundation under awards IIS-1422977, IIS-1527779, CAREER IIS-1453582, and IIS-1564351.
672