Date Fruits Classification Using Probabilistic Neural Networks M. Fadel College of Food and Agriculture, U.A.E. University, Al-Ain, P.O.Box:17555, U.A.E.; E-mail:
[email protected]
ABSTRACT Fruits of five Date cultivars (Phoenix dactylifera,L.) were studied and Probabilistic Neural Networks (PNN) techniques were used to develop a classifier of them. Color properties of Berhi, Bomaan, Khalas, Lolo and Fard in RGB color space were used as segregation criteria. Images of fifteen fruits of each cultivar were used to train the classifier. The input, radial basis and competitive layers were used to build the developed classifier in a Matlab 6.5 environment. The developed classifier was examined using twenty five non-training fruit images under different spread values as a smoothing factor. Final results showed a great influence of the spread value on the classification accuracy within. Final classification accuracy was 100%, 80%, 80% 60% and 80% for Fard, Khalas, Lolo, Bomaan and Berhi respectively. Keywords: Date fruits, fruit classification, probabilistic Neural Network. UAE 1.
INTRODUCTION
There are more than eighty cultivars of dates in the United Arab Emirates. Most of the commercially produced dates are consumed in the Tamr stage when moisture content is low and sugar content exceeds 95%. Classifying Tamr fruits is a great challenge. Fadel et al. (2006) reported that few research papers focused on applying machine vision techniques on date fruits; therefore, it was necessary to study several cultivars of date together to lay the foundation for a machine vision system which has the capability to differentiate among various date cultivars. The UAE grows about 40 million palm trees, which produce around 500,000 tons of Tamr annually (UAE University, Datepalm Research & Development Programme 2005). The objective of this study was to develop and test a probabilistic neural network based image processing algorithm for the classification of five date cultivars. Raji and Alamutu (2005) reviewed computer vision automated sorting systems in agricultural process while Al-Janobi (2000) developed a color computer vision system for sorting and grading Saudi dates (Sifiri cultivar) based on a color threshold technique into four quality classes. Wulfsohn et al. (1989) quoted Al-Janobi (2000) studied the use of image techniques on two date cultivars (Majhul & Zahid). Their work addressed separating defective dates using thresholding techniques. ________________________________________________________________________ M. Fadel “Date Fruits Classification Using Probabilistic Neural Networks”. Agricultural Engineering International: the CIGR Ejournal. Manuscript IT 07 003. Vol. IX. December, 2007.
SimÕes et al. (2002) applied neural networks to automated visual sorting of orange fruits. They added that for humans color identification apparently involves many physical and psychological concepts, making it difficult to properly model and process color in an image. Soriano et al. (2001) presented a classification technique of fluorescent spheres with a supervised back-propagation neural network that uses as inputs the major color histogram representation of the fluorescent image to be classified. They also applied Kohonen's selforganizing feature map (SOFM). They concluded that classification with SOFM-generated histograms as inputs to the classifier neural network achieved the best recognition rate (90%) for cases of normal, scaled, defocused photobleached and combined images. In however Codrea et al. (2004) classified apple fruits using fluorescence imaging; they used size, perimeter, circularity, elongation and localization as classification parameters to improve classifier results. Paliwat et al. (2003) explored the possibility of using flatbed scanners to classify cereal grains using a four layer back-propagation neural network (Jayes et al. 2000, Paliwal et al. 2001) . They considered three groups of 40, 20 and 10 features. They mentioned that both colors as well as textural features were important for classification and all the three color primaries (R, G and B) played important roles in characterizing the grains. Bulanon et al. (2006) developed a computer algorithm to locate the apple fruit on the tree and differentiate between the fruit and tree leafs. There are various neural network architecture models Lippmann (1987), Hush and Horne (1993), Rumbelhart et al. (1994), Widrow and Lehr (1990). One network architecture that has not been published widely in the agricultural literature is the Probabilistic Neural Network (PNN), (Steenhoek et al. 2001) state that PNN essentially works as a look-up table. They added that advantages of PNNs are quick training, as only one pass through the data is required and they have only one free parameter, the smoothing factor to be adjusted by the user. On the hand, a major disadvantage of the PNN architecture is that it requires one node or neuron for each training exemplar. They quoted Ward Systems Group (1993) who suggested a smoothing factor range of 0.01 to 1. Steenhoek et al. (2001) reported that classification accuracy of Corn grains on the smoothing samples was 79, 87, 93, and 89% for blue-eye mold, germ damage, hard starch, and soft starch, respectively, for an overall classification accuracy of 86%. Overall accuracy of the network on validation records was 75% with 62, 66, 73, 88, 81 and 84% accuracy for blueeye, germ damage, and shadow in sound germ, sound germ, hard starch and soft starch respectively. Fadel et al. (2006) concluded that red color ingredient intensity can be used to discriminate Berhi from Bomaan and Berhi from Fard, whereas green can be used to distinguish between Fard and Berhi and Bomaan and Fard. 2.
MATERIALS AND METHODS
The hypothesis of this experiment was that, on statistical basis date cultivars can be categorized utilizing PNN according to the RGB information for each of the five cultivars. Image data of Fard, Khalas, Lolo, Bomaan, and Berhi cultivars (Fadel et al. (2006), an image of each sample was captured using a Sony Mavica digital camera. Image resolution was 1912 x 916 pixels. Fluorescent light was the illumination source as recommended by Davies and ________________________________________________________________________ M. Fadel “Date Fruits Classification Using Probabilistic Neural Networks”. Agricultural Engineering International: the CIGR Ejournal. Manuscript IT 07 003.
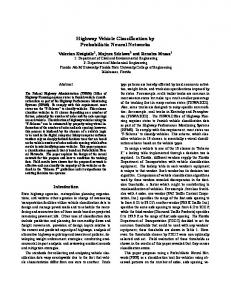
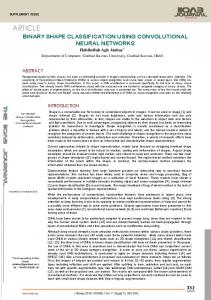
Perkins (1991).) The RGB frequency distribution and statistical characteristics such as mean and variance for each color ingredient are shown in figure1 and table1.
(a)
(b)
(d)
(e)
(c)
Figure 1. Color properties of (a) Fard, (b) Khalas, (c) Lolo, (d) Bomaan, and (e) Berhi in RGB color space
1.2
V/M Ratio
1 0.8 Blue Green
0.6
Red 0.4 0.2 0 Fard
Khalas
Lolo
Bomaan
Berhi
Cultivar
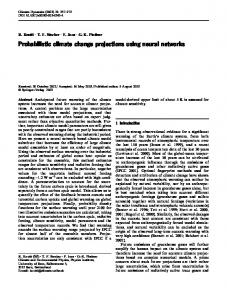
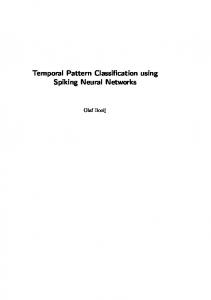
Figure 2. Variance / Mean Ratio Figure 1 displays the color intensity in RGB space of each cultivar; forty samples of each cultivar were used to generate the displayed charts where figure 2 displays variance to mean (V/M) values of each cultivar. It may be concluded that, Lolo is the most distinctive cultivar in this parameter and both Fard and Khalas are the highest among them in (V/M) value.
________________________________________________________________________ M. Fadel “Date Fruits Classification Using Probabilistic Neural Networks”. Agricultural Engineering International: the CIGR Ejournal. Manuscript IT 07 003. Vol. IX. December, 2007.
Table 1. Mean and Variance values of each cultivar Cultivar Fard Khalas Lolo Bomaan Berhi
Red 0.110 0.138 0.113 0.152 0.122
Mean Value Green 0.100 0.121 0.114 0.135 0.120
X1
Blue 0.122 0.201 0.166 0.292 0.295
Red 0.034 0.039 0.003 0.037 0.031
X2
XN
... ... ... ... fA(X)
fB(X)
Variance Green 0.035 0.045 0.002 0.044 0.042
Blue 0.038 0.060 0.002 0.052 0.037
Input Units
Radial Basis Layer Competitive Layer
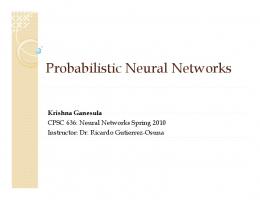
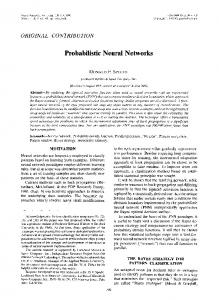
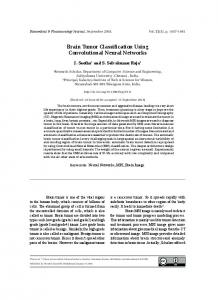
Output Units Figure 3. PNN architecture Figure 3 displays a PNN built in three layers of neuron units. It is actually a parallel implementation of a standard Bayesian classifier. It is a three layer network, with input, radial basis, and competitive layers that can perform pattern classification. The radial basis network is a feed-forward network but has only one hidden layer. The training vectors become the weight vectors in the first layer of the network, similar to Hamming network. Figure 4 displays the output of the Radial Basic Network; the neurons of this type of network have localized receptive fields because they only respond to inputs that are close to their centers. It trains faster than multilayer perception networks, but requires many neurons for high-dimensional input spaces. 2.1. Competitive Network Neurons in the competitive layer are capable of recognizing frequently presented input vectors. It finds the index of the neuron with the largest input and sets its output to 1 with ties attached to the neuron with the lowest index, and sets all other output to 0. ________________________________________________________________________ M. Fadel “Date Fruits Classification Using Probabilistic Neural Networks”. Agricultural Engineering International: the CIGR Ejournal. Manuscript IT 07 003.
The Neural Network Toolbox of Matlab 6.5 ™ was used to develop a brief code for image processing and classification of the studied date cultivars, and network simulation is displayed in figure 5. 2.2. Data for network training Fifteen sample images of each cultivar were used to train the network. Each of the used images has 3650 pixels. RGB information of each image was extracted and passed to the PNN code to be used to build the targeted network. 2.3. PNN Validation Two classification tests were run to validate the developed PNN. The first test used the fifteen training images of each cultivar to examine the developed PNN and find out its classification accuracy and the second test used twenty five un-trained images of each cultivar. Test results are shown in table 2.
Figure 4. First Layer Radial Base Network output
________________________________________________________________________ M. Fadel “Date Fruits Classification Using Probabilistic Neural Networks”. Agricultural Engineering International: the CIGR Ejournal. Manuscript IT 07 003. Vol. IX. December, 2007.
Figure 5 Network simulation
3.
RESULTS AND DISCUSSION
Color characteristics of forty images (about 146000 pixels) of each cultivar were extracted and plotted in RGB space as shown in figure 1. Mean and variance values are tabulated in table 1. The spread value (S.V.) of the radial basis function was used as a smoothing factor and classifier accuracy was examined when different values of S.V. were used. If S.V. is near zero, the network will act as a nearest neighbor classifier, and the network will take into account several nearby design vectors if its value becomes larger. The developed PNN were examined using twenty five un-trained samples from each cultivar. Results are shown in Table 2 and Figure 6. As shown in Table 2, classification accuracy of the un-trained samples for four S.V.s 0.0001, 0.001, 0.01, and 0.1 of Fard cultivar ranged from 100% to 76%; from 65% to 20% for Khalas; and from 57% to 28% for Lolo. However, classification accuracy was improved to 72% instead of 20% when spread value increased from 0.0001 to 0.1 for Berhi and the classification accuracy of Bomaan ranged between 40% and 24% when S.V. changed from 0.0001 to 0.01. Table 2. Total classification accuracy for un-trained samples Cultivar
Fard Khalas Lolo Bomaan Berhi
Total classification accuracy,% Spread Value 0.0001 0.001 0.01 0.1 100 77 87 76 40 65 60 20 35 57 52 28 40 40 40 24 20 40 69 72
________________________________________________________________________ M. Fadel “Date Fruits Classification Using Probabilistic Neural Networks”. Agricultural Engineering International: the CIGR Ejournal. Manuscript IT 07 003.
(a)
(b)
(c) ________________________________________________________________________ M. Fadel “Date Fruits Classification Using Probabilistic Neural Networks”. Agricultural Engineering International: the CIGR Ejournal. Manuscript IT 07 003. Vol. IX. December, 2007.
(d)
(e) Figure 6. The effect of S.V. change on classification accuracy of the five cultivars (a) Fard, (b) Khalas, (c) Lolo, (d) Bomaan, and (e) Berhi Figure 6 displays the effect of changing S.V. as a smoothing factor on the classification accuracy of Fard, which showed 100% accuracy when S.V. was 0.0001. However, for Khalas, the classifier presented an accuracy of 65% when S.V. was 0.005 and deteriorated to about 30% when S.V. was 0.05, and dropped drastically to 20% when it was 0.1. On the other hand, Berhi had very bad classification accuracy when S.V. was 0.0001, but it improved to 80% when S.V. was 0.025. Classifier performance reached to 55% when S.V. was 0.005 in Lolo and approached 40% when S.V. was 0.01 in Bomaan. The matching matrix (Table 3) displays the accuracy of the developed classifier in a different way. The classifier predicted Fard images perfectly however it is confused when it is trying to predict Khalas, Lolo or Bomaan.
________________________________________________________________________ M. Fadel “Date Fruits Classification Using Probabilistic Neural Networks”. Agricultural Engineering International: the CIGR Ejournal. Manuscript IT 07 003.
Table 3. Confusion matrix of the classification process Actual Cultivar
Fard
Khalas
Lolo
Bomaan
Berhi
25
-
9
6
-
Khalas
-
16
1
-
-
Lolo
-
3
14
3
-
Bomaan
-
1
-
10
5
Berhi
-
5
1
6
20
Classifier Prediction Fard
Additional classification code was developed to segregate overlapping cultivars, and the final accuracy of the classification of Fard, Khalas, Lolo, Bomaan and Berhi was 100%, 80%, 80% 60% and 80% respectively. 4.
CONCLUSIONS
A probabilistic Neural network based image processing algorithm for the classification of fruits of five date cultivars (Fard, Khalas, Lolo, Bomaan, and Berhi) was developed using properties of RGB color space of each of them. Fifteen images of each cultivar were used to train the PNN classifier and tests were run on different groups of date fruits images to examine classifier accuracy. One of the tested groups contained the fifteen trained images of each cultivar and the other group contained twenty five un-trained images. The developed classifier was examined under different spread values as a smoothing factor. Classification accuracy for Fard, Khalas, Lolo, Bomaan, and Berhi ranged from 100% to 76%; 65% to 20%; 57% to 28%; 40% to 24%; and from 72% to 20% according to the spread value. After developing an additional classification code to segregate overlapping cultivars, final accuracy may reach up 100%, 80%, 80%, 60%, and 80% for Fard, Khalas, Lolo, Bomaan and Berhi classification respectively 5.
REFRENCES
Al-Janobi A. 2000. Date inspection by color machine vision. Journal of King Saud University. Vol.(12):69-79 Bulanon D. M. , T. Kataoka, Y. Ota and T. Hiroma. 2006. A Machine Vision System for Apple Harvesting Robot. Agricultural Engineering International: the CIGR Journal of ________________________________________________________________________ M. Fadel “Date Fruits Classification Using Probabilistic Neural Networks”. Agricultural Engineering International: the CIGR Ejournal. Manuscript IT 07 003. Vol. IX. December, 2007.
Scientific Research and Development. Manuscript PM 01 006. Vol. III Codrea M. C. and Nevalainen O. S. 2004. Classifying apples by the means of fluorescence imaging. International Journal of Pattern Recognition and Artificial Intelligence. Vol.18(2):157-174 Davies, J. and Perkins, R.M. 1991. Effect of illumination in grading dates. ASAE Paper No. 91-3547. Fadel M, Kurmestegy L., Rashed M. and Rashed Z. 2006. Fruit color properties of different cultivars of dates (Phoenix dactylifera, L.). Agricultural Engineering International: the CIGR EJournal of Scientific Research and Development. Vol. VIII , March 2006. Hush D.R. and Horne B. G. 1993. Progress in supervised neural networks, what’s new since Lippmann. IEEE Signal Processing Magazine 10(1):8-39 Jayas D.S., Pilwal J. and Visen N.S. 2000. Multi-layer neural networks for image analysis of agricultural products. Journal of Agricultural Engineering Research. 77(2):119-128 Lippmann R. P, 1987. An introduction to computing with neural nets. IEEE Acoustics, Speech and Signal Processing Magazine 4(2):4-22 Paliwal J., Visen N.S. and Jayas D.S. 2001. Evaluation of neural network architecture for cereal grain classification using morphological features. Journal of Agricultural Engineering Research. 79(4):361-370 Pilwal J., Borhan M. S. and Jayas D.S. 2003. Classification of cereal grains using a flatbed scanner. ASAE Annual Meeting, Las Vegas, USA. Paper Number:036103 Raji A. O. and A. O. Alamutu. 2005. Prospects of Computer Vision Automated Sorting Systems in Agricultural Process Operations in Nigeria. Agricultural Engineering International: the CIGR Ejournal. Manuscript Vol. VII. Invited Overview. February 2005. Rumelhart D.F., Widrow B. and Lehr M.A. 1994. The basic ideas in neural networks. Communications of the ACM 37(3):87-91 SimÕes A.S., Costa A. H., Hirakawa A. R and Saraiva A. M. 2002. Proceedings of the World Congress of Computers in Agriculture and Natural Resources. 13-15 March 2002, Iguacu Falls, Brazil. ASAE publication number 701P0301 Soriano M., Garcia L. and Saloma C. 2001. Florescent image classification by major color histogram and neural network. Optics Express, Optical Society of America. Vol(8),5 Steenhoek L.W., Misra M.K., Batchelor W.D. and Davidson J.L. 2001. Probabilistic neural networks for segmentation of features in corn kernel images. Applied Engineering in Agriculture. Vol.17 (2):225-234 UAE University 2005. Datepalm Reaserch & Development Programme. Retrieved December 26, 2007, from http://datepalm.uaeu.ac.ae/subpages/doYouKnowfacts.html Ward Systems Group 1993. Neuro Windows Neural Network Dynamic Link Library. Frederick, M.D.: Ward Systems Group Inc. ________________________________________________________________________ M. Fadel “Date Fruits Classification Using Probabilistic Neural Networks”. Agricultural Engineering International: the CIGR Ejournal. Manuscript IT 07 003.
Widrow B. and Lehr M.A. 1990. 30 years of adaptive neural networks: perception, madaline, and machine vision. Proceeding of the IEEE 78(9):1415-1441 Wulfson D., Sarig Y. and Algazi R. V. 1989. Preliminary investigation to identify parameters for sorting of dates by image processing. ASAE paper No.89-6610
________________________________________________________________________ M. Fadel “Date Fruits Classification Using Probabilistic Neural Networks”. Agricultural Engineering International: the CIGR Ejournal. Manuscript IT 07 003. Vol. IX. December, 2007.