Demand-Driven Software Race Detection using Hardware Performance Counters Joseph L. Greathouse
Zhiqiang Ma
University of Michigan
Intel Corporation
[email protected] [email protected] Matthew I. Frank Ramesh Peri Todd Austin Intel Corporation
Intel Corporation
[email protected] [email protected]
University of Michigan
[email protected]
ABSTRACT
1. INTRODUCTION
Dynamic data race detectors are an important mechanism for creating robust parallel programs. Software race detectors instrument the program under test, observe each memory access, and watch for inter-thread data sharing that could lead to concurrency errors. While this method of bug hunting can find races that are normally difficult to observe, it also suffers from high runtime overheads. It is not uncommon for commercial race detectors to experience 300× slowdowns, limiting their usage. This paper presents a hardware-assisted demand-driven race detector. We are able to observe cache events that are indicative of data sharing between threads by taking advantage of hardware available on modern commercial microprocessors. We use these to build a race detector that is only enabled when it is likely that inter-thread data sharing is occurring. When little sharing takes place, this demand-driven analysis is much faster than contemporary continuous-analysis tools without a large loss of detection accuracy. We modR Inspector XE to utilize our ified the race detector in Intel hardware-based sharing indicator and were able to achieve performance increases of 3× and 10× in two parallel benchmark suites and 51× for one particular program.
Parallel programming has quickly entered into the mainstream. Consumer processors are already well into the multicore domain, and it does not appear that the trend will abate. Software performance increases currently hinge on programmers taking advantage of more processing cores, but parallel programming is marred with difficulties, chief among these are concurrency bugs such as data races [20]. Significant efforts have yielded powerful tools to help in this process, including systems for automatically finding data races. These race detectors can help a developer locate code that contains improperly synchronized memory accesses without requiring tedious code reviews or long debugging sessions. Without automated tools, these errors can be difficult to detect (until a crash occurs!) and even harder to locate. Race detectors are categorized into static tools, those that analyze the software for data races without executing the code, and dynamic tools that monitor the runtime state of the program. While dynamic analysis tools can only find errors in executed sections of code, static analysis tools suffer from a state space explosion problem that makes large programs difficult to analyze. These systems are often complementary, and we focus on dynamic tools in this work. Dynamic data race detectors observe when two threads access a shared memory location and calculate if it is possible for the threads to do this in an unordered way. Happensbefore race detectors, the style optimized in this paper, indicate a race when two threads access a shared variable, at least one is a write, and there is no intervening synchronization event between them. This type of race can lead to nondeterministic output because external factors such as scheduling, bus contention, and processor speed will ultimately determine the ordering of these accesses. This yields ultimate control of the program to these factors, which is rarely the programmer’s intent. Dynamic race detectors can be powerful but are also slow. It is not uncommon to see overheads of 300× in commercial race detectors. Such overheads are especially troublesome for dynamic analysis tools because they reduce the degree to which programs can be tested within a reasonable amount of time. Beyond that, high overheads slow debugging efforts, as repeated runs of the program to hunt for root causes and verify fixes also suffer these slowdowns. There have been numerous methods proposed to accelerate dynamic data race detectors. Some software-based mechanisms, for example, attempt to filter out accesses that
Categories and Subject Descriptors D.2.5 [Software Engineering]: Testing and Debugging— debugging aids, testing tools; D.1.3 [Programming Techniques]: Concurrent Programming
General Terms Design, Performance
Keywords Performance Counters, Data Race Detection, Demand Analysis, Cache Coherency
Permission to make digital or hard copies of all or part of this work for personal or classroom use is granted without fee provided that copies are not made or distributed for profit or commercial advantage and that copies bear this notice and the full citation on the first page. To copy otherwise, to republish, to post on servers or to redistribute to lists, requires prior specific permission and/or a fee. ISCA’11, June 4–8, 2011, San Jose, California, USA. Copyright 2011 ACM 978-1-4503-0472-6/11/06 ...$10.00.
cannot possibly cause races in order to reduce the number of calls to the detector [37]. These mechanisms can mitigate race detection slowdowns to a certain degree, but the software filtering mechanism itself will still contribute large overheads even if it filters most memory operations. Other researchers have proposed embedding race detectors in hardware [34, 47]. Though these increase performance, they incur large hardware overheads for non-upgradable, singlepurpose designs. CORD, for instance, requires extra storage equaling 19% of the last-level cache in addition to the hardware used to calculate data races [34]. In this work, we present a novel approach to optimizing the performance of software-based race detectors. We implement a demand-driven race detector – an analysis system that is only enabled when it is dealing with potential races. This demand-driven detector turns on when data is shared between two threads and turns off when there is no sharing. To enable this capability, we describe a hardware sharing monitor that informs the software detector when sharing begins, allowing us to watch for data sharing with no runtime overhead. We built our sharing monitor using hardware performance counters that interrupt execution on cache sharing events, an indicator of inter-thread data sharing. While normal software race detectors must check if the race detection algorithm should analyze each memory access, we are able to utilize hardware to perform this in parallel with the original application. This can yield a large increase in performance over a continuous-analysis software race detector when little datasharing occurs. We demonstrate that we can increase the R Inspector XE performance of the race detector in Intel by 3× and 10× for two benchmark suites. Because the cache events may miss some racy accesses (due to limited cache capacity, for example), we also study the accuracy of this demand-driven race detector. In our experiments, our design finds most data races seen by the slow continuousanalysis tool. We then study mitigation techniques for the few situations where our system misses races. We present the following contributions in this paper: • We develop an efficient sharing indicator that detects, at little runtime overhead, when expensive analyses should run. • We introduce a demand-driven approach to race detection that only invokes expensive analyses when it is possible for races to occur. • We build and evaluate a commercial-grade implementation of the technology and show that it was able to find new data races in a popular parallel benchmark suite while reducing the overheads by 3-10×. This paper is organized as follows: we review background works in Section 2. We present our design of a demanddriven race detector using idealized hardware in Section 3 and discuss methods of monitoring data sharing in order to build the detector in Section 4. Because the hardware available to us is less than ideal, we then design a demanddriven tool that uses performance counters in Section 5. We detail our experimental setup in Section 6 and show our results in Section 7. Finally, we discuss related works in Section 8 and conclude in Section 9.
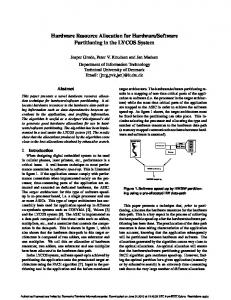
THREAD 1 1. if (ptr == NULL) { 4. ptr = malloc(1); 5. memcpy(ptr, benign, 1); }
Value of ptr ptr = NULL ptr = large_buf ptr = small_buf ptr = small_buf ptr = small_buf
THREAD 2 2. if (ptr == NULL) { 3. ptr = malloc(256);
6. memcpy(ptr, hostile, 256); }
Figure 1: A data race resulting in a security flaw. The numbers represent dynamic execution order. Both threads attempt to initialize the shared pointer (1, 2). Due to the lack of synchronization, thread 1 allocates a small buffer (4), but thread 2 then copies a large amount of data into it. This particular ordering can cause a buffer overflow, exposing a potential security flaw. If (4) occurred before (2), this code would run correctly; (3) and (6) would not execute due to the conditional check at (2).
2. BACKGROUND Concurrent execution can lead to bugs that would not occur in sequential code. Data races, for instance, occur when two parallel threads of execution access a single shared memory location without a guaranteed order of operations between them. More formally, a data race occurs when two or more threads access a single memory location, at least one access is a write, and there is no enforced order between the accesses [30]. These situations can introduce unintended, and sometimes dangerous, values into the program when they arise, as demonstrated in Figure 1. This example is drawn from CVE-2010-3864, a security flaw found in some versions of the OpenSSL TLS library [29]. This flaw allowed two threads to access a shared pointer without synchronization. In some circumstances, each thread may attempt to initialize it to a different heap object, subsequently attempting to copy data into the object. If, however, the accesses to the pointer are interleaved (as shown in the figure), one thread may attempt to copy a large amount of data into a small heap object, causing a potentially dangerous heap overflow [33]. No overflow would occur if the memory accesses were performed in a different order. This data race could therefore allow a heap-smashing attack to take place, potentially giving a remote attacker the ability to run arbitrary and dangerous code on the machine. There are three types of data races that can affect the output of a program: • W→W (a.k.a. WAW): one thread writes a variable and another thread then writes to the same location • R→W (a.k.a. WAR): one thread reads a variable and another thread then writes to the same location • W→R (a.k.a. RAW): one thread writes a variable and another thread then reads from the same location R→W and W→R races are related; the difference between the two is the observed order of the accesses. For example, if the reading thread in an R→W race happened later, the race could become a W→R race. Data races can be mitigated by ensuring that there is some enforced order on the accesses to a variable. For instance, putting mutual exclusion boundaries around each thread’s accesses to a variable will ensure that no other thread will operate on that variable at the same time, forcing a partial order on the program. It is difficult to manually find data races because they can cause the program to behave contrary to the intuitive sequential ordering implied by the programming language. Their side effects may also occur infrequently, making them difficult to trace. To combat this, dynamic race detectors
observe the execution of the program and automatically detect when the program is performing a racy access. The happens-before race detector utilized in this paper uses Lamport clocks to divide programs into segments based on thread synchronization operations [19]. On memory accesses and synchronization operations, it updates and analyzes the values of these clocks to determine if two segments that access the same variable could execute in parallel, indicating that a data race could occur [2, 3]. While dynamic race detectors are useful when searching for concurrency bugs, they come at a high runtime cost. They must check each access to memory in some manner, yielding high overheads. It is not uncommon to see overheads ranging from 20× [39], to 200× [42], to upwards of 1000× [21] in commonly used race detectors. Besides making these tools more difficult to use, these slowdowns negatively affect their capabilities. Dynamic analysis tools can only observe errors in portions of programs reached during a particular execution, and slow tools limit the number of runtime states that can be observed.
3.
DEMAND-DRIVEN RACE DETECTION
Software dynamic race detectors have extremely high overheads because they conservatively perform sharing analysis on every memory access. As Sack et al. pointed out, many memory operations need not go through the entire race detection algorithm because they could not possibly cause data races [37]. However, the very act of checking whether a memory access should be sent to the race detector will cause slowdowns in a software-based analysis tool. In this section, we describe a demand-driven race detector that is only active when the software-under-test is executing instructions that should be sent through the race detection algorithm. We then show a hardware model that allows us to design a race detector that causes no runtime slowdowns when no races could occur.
3.1 Unsynchronized Sharing Causes Races In the most general sense, race detection is only important when data sharing is occurring between threads or processes. As Netzer and Miller described, apparent data races are “failures in programs that access and update shared data in critical sections” [30]. For a dynamic race detector, this means that accesses to unshared data need not be sent through the race detection algorithm. For instance, if two threads are writing to and reading from thread-local data, a happens-before race detector could not possibly observe a data race – each variable is accessed by a single thread whose Lamport clock is monotonically increasing. Additionally, shared variables need not be sent through the race detector on every access. A happens-before race detector will not return a different result if a variable it is checking has not been shared since the last time it was checked. Figure 2 shows two examples of this. For these orderings, the subsequent accesses to the variable x by thread 2 cannot result in a different answer in either case. Sack et al. take advantage of these insights by using software filters to reduce race detection overheads [37]. Their FSM filter utilizes the first insight to filter all accesses to a variable until multiple threads touch it. Their duplicate filter removes checks on variables that have previously been analyzed since the last time they were shared. While this software-based filtering improves the total race detection
THREAD 2
THREAD 1 1: Lock(m1); No Races 2: x = 256; 3: UnLock(m1);
4: Lock(m1); 5: x++; 6: x *= local_var1; 7: x += 256; 8: UnLock(m1);
(a) THREAD 1 1: x = 256;
THREAD 2 R->W and W->W Races
2: x++; 3: x *= local_var1; 4: x += 256;
(b) Figure 2: Multiple race checks yielding the same answers. The numbers represent dynamic execution order. (a) The race checking on instructions 6 and 7 will always yield the same ”no races” answer as instruction 5, because they are all protected by the same lock. (b) Each check in thread 2 will show the same data races on x as no other threads are interleaved.
performance, it is still quite slow. Even if the programunder-test has little data sharing, and thus most operations are not analyzed, each memory access must still be analyzed by the sharing filter.
3.2 Performing Race Detection When Sharing Data To best take advantage of the fact that races are tied to inter-thread data sharing, we designed a software race detector that is only enabled when a thread is operating on shared data. This detector relies on the hardware to inform it of data sharing events; when none are occurring, it need not attempt to find races. The hardware utilized in this section is idealized and performs the checks illustrated in Figure 3 on each memory access. On each memory operation, it checks if the accessed location is thread-local or at least not currently participating in a write-share. If either case is true, the access need not be sent through the race detector, as explained in Section 3.1. We accomplish this check through a form of eager conflict detection, like those implemented in hardware transactional memory [25] or race recording systems [16]. This detection mechanism compares the ID of the thread that previously touched this location with the current thread ID; if they are different and either is a write, the system should check if a data race has occurred. To this end, a thread gains ownership of a variable when accessing it. This can be done with ownership records similar to those described by Damron et al. [10] or by keeping meta-data alongside each byte in memory. Regardless, inter-thread data sharing is detected using the ownership of a variable. If thread 1 owns a variable and thread 2 accesses that location, there is data sharing. The hardware must now check if either access was a write, and give thread 2 ownership of the variable for this type of access, as it is now the most recent thread to touch it. If the data is write-shared, then the software race detector should be run on this instruction. For example, if thread 1 write-owned a variable, and thread 2 attempted to write to it, there is W→W data sharing. Thread 2 is granted write-ownership of the variable and the access is sent through the software race detector. This demand-driven analysis system begins by performing no race detection, instead only tracking the Lamport clocks associated with each thread and lock (as, for instance, LiteRace does when its race detector is disabled [23]). When the software attempts to execute a synchronization opera-
Thread Executes Instruction
Synchro Operation?
NO
YES
Memory Operation?
YES
NO
Variable Owned by this Thread?
NO
YES
Last Owned by this Thread?
NO
YES
Write shared?
YES
NO
Lose All Ownership Run Race Detection Update Lamport Clocks
Update Lamport Clocks
Gain Variable Ownership
Figure 3: Ideal Hardware-assisted Demand-Driven Race Detector This algorithm details an ideal demand-driven race detector. The dark boxes are performed within the hardware, which tells the software race detector to run only when it detects data sharing that could cause races.
tion (or other operation that increments its Lamport clock), it asks the hardware to revoke all of this thread’s ownerships. This is done so that the next time a variable is accessed by this thread, the hardware will cause the software race detector to update the location’s Lamport clock, even if no other thread has touched it. While the program is running, it checks the ownership of each memory access. Unlike a transactional memory system, this occurs at every access in a multi-threaded program because we cannot rely on races to exist only within demarcated regions. If this thread owns the memory location, the access will complete without intervention. If not, the hardware must then check if some other thread currently owns (or most recently owned, as described above) this variable. If this is not the case, this thread gains ownership of the variable and the hardware signals to the race detector to updates the variable’s clock appropriately. Subsequent accesses by this thread to that variable will not cause any hardware events, and the program can run at full speed. If the variable is or was most recently owned by another thread, however, this access causes data sharing between two or more threads. The hardware will detect this and, if one or both accesses to this variable were writes, will inform the race detector that it must check this access for data races. This system ensures that the software data race detector does not perform any actions unless they are required. The race detector does not perform the slow analysis algorithm when the threads access unshared variables. When data sharing occurs, the signals from the hardware precisely inform the race detector when it should activate, ensuring that no time spent in analysis is wasted.
4.
MONITORING DATA SHARING IN HARDWARE
As described in the previous section, the hardware to enable our demand-driven race detector needs a number of capabilities to perform the checks for inter-thread data sharing. Beyond the logic previously described, the architecture must be able to: 1. Set thread-ownership of individual memory locations. 2. Keep separate read/write ownerships. 3. Invoke fast faults or interrupts to the race detector. Without the first two, it would be impossible for the hardware to properly perform sharing detection. If it had no concept of thread-ownership, the hardware would be unable to detect inter-thread sharing. Similarly, separate read/write
ownership is needed to avoid performing race detection during read-only sharing, a common occurrence in parallel programs. Without the third capability – fast interrupts – it is unlikely that this system would be any faster than performing the race detection in software. If each fault needed to go through the kernel in order to run race detection on a single memory operation, sections of parallel software with large amounts of data sharing would become unbearably slow. No hardware with these abilities currently exists, though some researchers have described designs that nearly fit the bill. Witchel’s Mondriaan Memory Protection system [44] and UFO as described by Baugh et al. [4] are examples of fine-grained memory protection systems that could be repurposed to provide threads ownership of memory regions. Even then, application-specific hardware (or a programmable state machine such as described in MemTracker [43]) would need to be added to perform the sharing analysis. These systems would require significant changes to the architecture of existing processors, so it is unlikely that they will be built to accelerate our single application. Instead, we look elsewhere for hardware mechanisms that, while not perfect, may help us build a “best effort” demand-driven race detector.
4.1 Cache Events We can observe data sharing by watching for particular cache events. A W→W memory sharing event occurs when two threads write to the same location. Assuming that each thread is in its own core, and each core has its own MESIstyle private, coherent cache, the first write transitions the cache line that contains the variable into a modified state. When the second thread reads the line, the data is fetched from a remote cache that was in the modified state. Similarly, W→R data sharing occurs whenever one cache contains a line in the modified state and another cache attempts to read the modified line with a read-for-ownership operation. R→W sharing is slightly different, as it does not begin with a cache line in the modified state. Nonetheless, it can be seen when a cache line reads-for-ownership from an exclusive or shared line in another cache. Because of limitations inherent to caches, it is not readily possible for our race detector to observe every data sharing event by using cache information because: 1. Caches have limited capacity. If, for instance, thread 1 wrote to a location, the line was evicted, and then thread 2 read the location, no cache events would signal this sharing. 2. Cache events are performed on a processor, not process
3. 4. 5. 6.
or thread, basis. Two threads that share data may be scheduled on the same processor at different times, allowing data sharing through the common L1 cache. It is possible to have more threads than processors. Cache sharing events may overlook data that was shared between active and inactive threads. Simultaneously multithreaded (SMT) systems have multiple threads share the same cache, so some data sharing is not visible with inter-cache events. The cache events must be observable by software if our race detector is to use them. False sharing can cause races to be missed. If thread 1 writes variable x, putting its cache line into the modified state, thread 2 may read variable y, moving the same line to shared. This would make it difficult to observe a later access to x by thread 2.
The first problem has been addressed by researchers of hardware-based race detectors and transactional memory systems. For instance, Prvulovic measured the differences in races seen within the L2 cache versus a theoretical infinitesize cache in CORD and found little difference in the total accuracy [34]. Intuitively, racy accesses that happen closer together in time (and are thus still contained within the cache) may be the most important races because they are more likely to have their orders changed by timing perturbations. Zhou et al. summarize this intuition by stating in their report on HARD, “This [cache-sized] detection window is usually enough because most races occur within a short window of execution” [47]. Problems 2, 3, and 4 can usually be mitigated through software mechanisms such as pinning threads to individual processors (2), reducing the maximum number of threads to match the number of cores (3), and disabling SMT (4) when performing race detection. In this paper we only perform the latter two. It is also important to note that we have found that caveat 2 occurs infrequently enough that, despite the potential problem, we never observed it in practice. The next step in building our demand-driven race detector is therefore a method of informing the software of these events. Previous research has proposed hardware structures that solve this problem by making memory events available to the user [15]. More recently, Nagarajan and Gupta proposed ECMon, a hardware mechanism that can take user-level interrupts when a program causes particular cache events [27]. ECMon also solves the first problem by causing an interrupt whenever a cache line is evicted. In order to quickly take the subsequently large number of events, ECMon requires user-level interrupts. While making every cache event available to the user is a fruitful area of work, we desire a less intrusive hardware design. To this end, we abandon the requirement of signalling the software on every cache event. Instead, as we will detail in the next section, we settle for observing a subset of cache events. If we enable the race detector for long periods of time (rather than for a single instruction), we can disable the detector when no sharing is observed, yet enable it when it appears that sharing is happening. This has the added benefit of solving the last problem in the common case.
4.2 Performance Counters Performance counters, a class of hardware devices contained in most modern microprocessors, can be programmed
to count the number of times specified dynamic events occur within a processor. One of the most common counters, for example, is the number of instructions committed since the counter was enabled. When these counts are made available to software, they can be used to find and remove software inefficiencies [41]. While performance counters can easily track the number of events that occur within a processor, it is more difficult to use them to find which instruction causes a particular event. One common method is to set the initial value of a counter to a negative number, take an interrupt to the kernel when the counter overflows, and observe the state of the machine from within the interrupt handler. Recent Intel processors have introduced a number of advanced performance counter events; the most interesting for this work are the events that describe cache state. For example, in processors based on the Nehalem core, the event MEM UNCORE RETIRED.OTHER CORE L2 HITM (which we refer to as HITM) allows a core to count the number of times it loads a cache line that was stored in the modified state within another core’s private L2 cache. R 4 also include a hardIntel processors since the Pentium ware facility called Precise Event Based Sampling (PEBS) that allows the hardware to automatically save information about instructions that cause performance events. For instance, PEBS can automatically store the instruction pointer and register values of the operation that causes a cache miss event into a buffer. When this memory buffer becomes full, the hardware will raise an interrupt, allowing the kernel to read out the data and make it available to analysis tools. In our design, we use the PEBS hardware on performance counter overflows to obtain information about the thread that caused the data sharing. By taking a PEBS interrupt when the HITM event occurs, a core is able to inform the software that a W→R data sharing event has happened. We use this, then, as the mechanism for informing our demanddriven race detector that data is being shared. There are impediments to using the HITM performance counters as the signal to begin performing race detection. 1. Current HITM counters do not count reads-for-ownership that cause HITMs. This means we are unable to directly observe W→W data sharing. 2. There is currently no performance counter event to directly observe R→W data sharing. 3. Current performance counters only count cache events that are caused by instructions. They cannot count when the hardware prefetchers load a cache line that is in the modified state in another processor’s cache. We quantify the effect of problems 1 and 2 on the accuracy of our demand-driven race detector in Section 7 and then test methods for mitigating these problems. It is often possible to disable the hardware prefetcher with BIOS or UEFI settings, eliminating the third issue. We were unable to do this during our tests, but noticed no adverse effects in any of our benchmarks. We therefore do not study the third problem further in this work.
5. OUR DEMAND-DRIVEN RACE DETECTOR DESIGN Our goal of a demand-driven race detector requires that we have hardware events that will inform it of data sharing events. Though the cache-based performance counter
NO
Thread Executes Instruction
Synchro Operation?
NO
Analysis Enabled?
YES
YES
Update Lamport Clocks
Run Race Detection
NO
Causes HITM?
YES
Interrupt to Kernel
Caused by Program Under Test? NO YES
Data Sharing Recently?
NO
Disable Analysis
Enable Analysis
YES
Figure 4: HITM-based Demand-Driven Race Detector. This algorithm uses hardware events (dark boxes) to watch for data sharing. If sharing is detected, the slow race detection is enabled until the software race detector finds no more data sharing. With no sharing, the system quickly goes through the steps within outlined box.
events we described in the previous section allow this by taking faults to the kernel whenever data sharing occurs, these interrupts are too slow to be used to signal every memory operation that must be sent to through the race detector. Instead, we use these events to infer that we are in a section of the program that has data sharing. Working under the hypothesis that data sharing often happens in bursts, this is a signal to enable the software-based race detector for a period of time. The demand analysis algorithm for our system, shown in Figure 4, is therefore: 1. Run the software under test with race detection disabled (but paying attention to synchronization operations) and HITM performance counters enabled. 2. Observe HITM performance events. If these occur within the program’s instruction space, enable the software race detector and disable the HITM performance counters. Synchronization functions such as pthread mutex lock that cause HITMs are observed but do not cause the race detector to start. 3. Run the software with race detection enabled and keep track (with software mechanisms) of data sharing. If the race detector finds that the program is no longer in a section of code with data sharing, disable the race detector and return to step 1. Enabling race detection for a length of time whenever the hardware indicates that the software is in a region with shared memory helps alleviate two of the limitations of our hardware sharing indicator. First, it reduces the number of interrupts, which can devastate the performance of a system if they occur too often. Second, it raises the chance of detecting W→W and R→W data races in the vicinity of detected W→R sharing, the two race types that our current hardware sharing indicator cannot detect. Because these races are likely to happen in regions of code that have other data sharing, they may be caught by the software race detector after it is enabled by a W→R sharing event. When the performance counters in our design are enabled, a HITM event increments PMC0, the first performance counter. When this counter overflows, it arms the PEBS hardware, which will fire on the next HITM event. When the PEBS hardware fires, it writes the current architectural state into a physical memory buffer and causes an interrupt to the kernel. The interrupt handler first checks that the software-under-test (SUT) was scheduled when taking the interrupt (as other processes or the kernel could have caused the event) before sending a signal to the race detector and resetting PMC0. The signal causes the race detector to
access the performance counter driver to read the information that the PEBS hardware wrote into physical memory. It uses this information to decide whether the HITM was caused by the SUT or the detector itself. Finally, if the interrupt was caused by the SUT, the detector requests that the driver disable the counter and enables full race detection. The race detector, when enabled, keeps track of interthread data sharing using software mechanisms. It does this in order to enable the previously detailed filters, where instructions working on thread-local data are not sent through the race detection algorithm. If no inter-thread data sharing has taken place within some user-defined period of time, the software race detector will disable itself. Before allowing any further instructions to run, it also asks the driver to again enable the HITM performance counters. This puts the software back into the initial state where it runs at nearly full speed, with no race detection occurring. The particular timeout we used in this work is dependent on the internal workings of our race detector. Broadly, the sharing check occurred every few thousand instructions. As we mentioned in Sections 4.1 and 4.2, this system is not guaranteed to find all races, as the caches may miss some data sharing events. However, we agree with the assertion of other researchers that it is better to have a race detector that is usable but slightly inaccurate than one that is unusable [37]. For some developers, the performance offered by a demand-driven race detector may be worth the chance at missing some races. At other times, they may choose to disable the demand-driven aspects and run the continuousanalysis detector. Both options are possible with our system.
6. EXPERIMENTAL SETUP R Inspector XE We built our system on top of the Intel race detector, a software-based happens-before race detector built using Pin [22]. The Inspector XE pintool performs few actions (such as updating Lamport clocks on synchronization points) when race detection is disabled, but there is still some slowdown due to the instrumentation overhead. When race detection is enabled, the tool checks every memory operation in some way and disables the performance counters to avoid unnecessary interrupts. R CoreTM i7Our experiments were performed on an Intel 870, a 2.93 GHz processor with 8 MB of shared L3 cache and 256KB of private L2 cache per core. This is normally a fourcore processor with 8 logical cores, but SMT was disabled for these experiments. The test system was equipped with 8 GB of DDR3 DRAM and ran 64-bit SUSE Linux Enterprise Server 11.0, kernel version 2.6.27.19.
Table 1: Our selection of concurrency bugs from RADBench These bugs were used to test the accuracy of our demanddriven race detector versus a system that always analyzes memory accesses. SpiderMonkey-0 is not described by Jalbert et al, as it was removed in the final version of RADBench. SpiderMonkey-0
A data race in the Mozilla SpiderMonkey JavaScript Engine, Mozilla bug 515403
SpiderMonkey-1
A data race and atomicity violation in the Mozilla SpiderMonkey JavaScript Engine, Mozilla bug 476934
SpiderMonkey-2
A data race in the Mozilla SpiderMonkey JavaScript Engine, Mozilla bug 478336
NSPR-1
Mutexes being incorrectly allocated (resulting in improper locking) in Mozilla NSPR, Mozilla bug 354593
Memcached-1
Thread-unsafe incrementing of global variables in memcached, Memcached bug 127
Apache-1
List in Apache httpd incorrectly locked, causing crashes. Apache bug 44402
Two benchmarks suites were used to ascertain the performance of our demand-driven race detection system. The first, the Phoenix shared memory map-reduce benchmarks, represents programs that, while parallel, have little data sharing [36]. We also use the PARSEC suite version 2.1, a collection of parallel applications with a wide range of data access patterns, concurrency paradigms, and data sharing [6]. All benchmarks were run with four threads, and all except for freqmine were compiled with GCC 4.3 using pthreads. Freqmine used ICC 10.1 and was parallelized with OpenMP. The Phoenix benchmarks were given default inputs, while the PARSEC benchmarks used the simlarge input set. Each benchmark was run multiple times to increase statistical confidence, and the first run of every test was discarded in order to preload data from the hard disk. We also ran the Phoenix and PARSEC suites to compare the race detection accuracy of our demand analysis system versus the original continuous-analysis Inspector XE. In addition, we tested the accuracy of our system with a prerelease version of RADBench by Jalbert et al. [17]. We list the particular benchmarks from this suite that we used in Table 1. Because we were only testing the accuracy of our race detector, we did not run the two deadlock benchmarks (NSPR-2 and NSPR-3). Similarly, we did not test Apache2 because it was an atomicity violation only, and our race detector would not find it. We also tested a SpiderMonkey bug that was not included in the final version of the suite, SpiderMonkey-0. We also did not run the Chrome benchmarks, as we were unable to compile either version of Chromium within our particular version of Linux. In all cases, for both the continuous and demand-driven tools, we configured the race detector to search for races but not cross-thread stack accesses or deadlocks. We enabled the software filtering available within Inspector XE, meaning that it would not run race detection on a variable until it was accessed by at least two threads, and one of those threads performed a write. We kept no call stack for debugging purposes for any of the performance-related benchmarks.
7.
EXPERIMENTAL RESULTS
7.1 Performance Improvement Our initial tests quantify the performance improvements that our demand-driven race detector could yield. We first
ran each benchmark with the original race detector, configured as previously described, which yielded the baseline slowdowns for continuous-analysis as shown in Figure 5. The slowdowns between the benchmarks range from 5.3× for raytrace in the PARSEC suite to 278× for matrix multiply in the Phoenix suite. The former spends most of its time in single-threaded code where the race detector causes little slowdown, while the latter is slowed heavily due to the software filtering algorithm. On the whole, the Phoenix benchmark ran 83× slower while inside the race detector than on the bare hardware, as shown in Figure 5a. While all of these algorithmic kernels utilized similar forms of data parallelism in their concurrent sections, the slowdowns caused by the race detector can differ by an order of magnitude. Because these benchmarks are written in a map-reduce manner (where one thread assigns independent work to all the others), the software filtering stops most of the memory accesses from going through the slow race detection algorithm. The benefit of this can be seen in benchmarks such as string match and word count, where overheads are relatively low (28× and 23.5×, respectively). Unfortunately, the memory access filtering can itself cause high overheads, as can be seen in linear regression and matrix multiply. These benchmarks also have few shared memory locations, but their particular memory access patterns bring out inefficiencies in the filtering algorithm. As such, even though the memory operations are not sent through the slow race detector, the filtering mechanism itself causes overheads of 261× and 278×, respectively. The PARSEC benchmark suite contains a collection of large programs with many different styles of parallelism. These differences in the methods of concurrency can be seen in Figure 5b. While benchmarks with little communication, such as blackscholes and raytrace have little overhead (28.4× and 5.3×, respectively), the program dedup has a significant amount of sharing and runs much slower (99× slowdown). Many of these benchmarks spend a large period of their time either running in the race detection algorithm or going through the software filtering mechanism. The geometric mean of the slowdowns for the PARSEC suite is 74.7×. We then ran the same benchmarks under our HITM-based demand detection system. For these benchmarks, we chose to ignore HITMs that occurred in some library calls (such as malloc and free) because they had needless sharing that should not cause data races. Performance differences between these experiments and the baseline are due to our demand system disabling the race detector and software filters when they are not needed. The results of these experiments are presented in Figure 6. Figure 6a shows the performance improvements yielded by the HITM-based race detector in the Phoenix suite. The average slowdown dropped from 83× to 8.3×, a 10× performance improvement. This can be seen most dramatically in the matrix multiply benchmark. In this case, the hardware is able to observe that very little data sharing occurs, and it keeps the race detector disabled for the majority of the benchmark. With the race detector disabled, no memory operations are sent through the software filter, yielding a 51× performance improvement. This reduction of the filter overhead is also seen throughout the other benchmarks, including those that originally had relatively little slowdown.
300
250
250 Slowdown(x)
Slowdown (x)
300
200 150 100
200 150 100
50
50
0
0
(b) PARSEC Suite
(a) Phoenix Suite
18 16 14 12 10 8 6 4 2 0
51.0
Speedup (x)
Speedup (x)
Figure 5: Continuous-analysis race detection slowdowns. Bars represent the mean slowdown; error bars represent 95% confidence intervals. The dashed line is illustrative of a 75× slowdown. These benchmarks see a range of slowdowns, averaging (a) 83× and (b) 75×. Much of the time in the high-overhead benchmarks is spent within the software filtering mechanism or the Lamport clock algorithm. 18 16 14 12 10 8 6 4 2 0
(a) Phoenix Suite
(b) PARSEC Suite
Figure 6: Speedups for to demand-driven race detection compared to continuous-analysis detection. Bars represent the mean performance gain; error bars represent 95% confidence intervals. The dashed line is the baseline performance of the continuous race detector. (a) The Phoenix map-reduce benchmarks see large speedups because they contain little data sharing between the worker threads. (b) The PARSEC suite contains more data sharing, but the average speedup is still 3×.
The slowdown of the word count benchmark, for instance, is reduced to 4.3×. The concurrency model of the Phoenix benchmark suite is well suited for our method of demand-driven race detection. Each benchmark shares very little data, so the vast majority of memory accesses need not be sent through the race detector. Without the hardware sharing detector, these memory operations would still be sent through some type of analysis to determine if they should be checked for races. Figure 6b details the performance improvements of the PARSEC benchmark suite. The geometric mean of the speedups in these benchmarks is 3×, reducing the slowdown from 74.7× to 25.2×. Freqmine sees the highest performance gains (13.5×), as it is an OpenMP data parallel program, similar to the benchmarks in the Phoenix suite. Other benchmarks, such as x264 and canneal see less performance gain (3.2× and 2.1×) because they have a significant amount of inter-thread communication that must be sent through the race detector. A few benchmarks (e.g. vips and streamcluster) do not contain a large amount of sharing, but still do not gain much performance (22% and 23%). This appears to occur primarily because what little sharing the programs perform causes the race detector to run for a period of time, exit, and quickly reenter on the next sharing event or falsely shared cache line. The speedups of all
the benchmarks are mitigated somewhat by the overheads of going to the kernel to deal with performance monitor interrupts, but it is especially apparent in these benchmarks that have a small amount of data sharing. Taken together, these benchmarks verify that a demandbased race detector can result in higher performance than a continuous-analysis detector, even when the latter uses advanced software filtering techniques. Even programs that contain a high amount of data sharing gain some performance benefits, as there are bound to be sections of code that are not operating on shared data. Meanwhile, programs with large sections of code that do not share data can be analyzed much faster.
7.2 Accuracy of Demand-Driven Race Detection The next question in regards to our demand-driven race detector is its accuracy compared to the slower continuousanalysis race detector. If our system was faster but found no errors, it would be of little use. We compared the data races we found in the Phoenix, PARSEC, and RADBench suites using the demand-driven race detector against the races found with the continuousdetection system. These races include both benign races (such as threads checking a variable in a racy way before
Table 2: Accuracy of the demand-driven race detector The demand-driven race detector finds most of the races observed by the continuous race detector (including previously unknown races in facesim and freqmine). The W→W races that are missed are due to the lack of HITMs on reads-for-ownership, while cache size limitations cause the missed races in facesim.
W→W R→W W→R W→W R→W W→R Total
kmeans facesim ferret freqmine vips 1/1 (100%) 0/1 (0%) 1/1 (100%) 0/1 (0%) 2/2 (100%) 2/2 (100%) 1/1 (100%) 2/2 (100%) 1/1 (100%) 2/2 (100%) 1/1 (100%) SpiderMonkey-0 SpiderMonkey-1 SpiderMonkey-2 NSPR-1 0/9 (0%) 0/1 (0%) 0/1 (0%) 3/3 (100%) 3/3 (100%) 1/1 (100%) 1/1 (100%) 8/8 (100%) 1/1 (100%) 2/2 (100%) 4/4 (100%) 55/69 (79.7%)
attempting to acquire a lock and rechecking the variable) and actual data races. We report every observed race because the difference is meaningless to the tool; it is up to the programmer to designate a race either benign or real. The accuracy results are presented in Table 2, which only lists benchmarks with data races detected by the continuous-analysis tool. Our system misses no W→R races, the type of sharing that our hardware performance counters can observe. We also find most W→W and R→W races, verifying our assumption that, quite often, W→R sharing is an indicator of shared sections of the program. In total, our demand-driven race detector observes nearly 80% of the races visible to the continuous analysis race detector. We also note that among the races observed with the demand-driven race detector, two were true data races that had not been previously reported. Facesim contained a W→R data race due to a mistake in the code that did not appropriately create thread-local copies of the working data. Freqmine (the OpenMP benchmark with a high speedup) contained a W→R error due to a missing OMP critical statement. Both bugs were reported to the PARSEC developers and confirmed, and we have developed patches to be deployed in the next version of PARSEC. We also found a true data race in x264 that had previously been reported to the developers and patched. We found that debugging these races was easier than normal thanks to the increased speed of our demand-driven race detector. The multiple runs we performed to pinpoint the locations and call-stacks of the error in freqmine, for instance, were completed before the continuous-detection run completed for the first time.
7.3 Races Missed by the Demand-Driven Detector Despite these benefits, our demand-driven tool misses 20% of the data races found with the continuous-analysis system. The first reason for these inaccuracies is because executing a read-for-ownership (RFO) on a cache line stored in the modified state within another cache does not increment the HITM performance counter. This is why we do not observe the W→W race in streamcluster, for instance; there is no W→R sharing in the section of code that causes this race. Additionally, the limited size of the L2 cache makes it difficult to observe the remaining races in facesim. The initial write and subsequent racy accesses are far apart (with a large amount of data written by all threads in between), and thus the modified line is evicted from the cache before it can cause a HITM event.
x264 streamcluster 0/1 (0%) 3/3 (100%) 1/1 (100%) 3/3 (100%) 1/1 (100%) Memcached-1 Apache-1 1/1 (100%) 1/1 (100%) 7/7 (100%) 2/2 (100%)
7.4 Observing more W→W Data Sharing If it were possible to detect RFO accesses that cause HITM events, we should be able to detect some W→W races that we previously could not. One way to do this would be to modify the HITM performance counter event in future processors to also count stores that cause RFO HITMs. In order to test this solution on our existing system, we modified our race detection pintool to insert an innocuous load before every store. This load should cause a HITM performance event at the same location that would cause an event on a processor that counted RFO HITMs. We reran the accuracy tests and observed that this indeed allowed us to detect the missing W→W races. The total detection accuracy is listed in Table 3. In total, this modification raises the accuracy of our demand-driven tool from 80% to 97% in our tests. The only extra overhead would come from the additional time spent in the race detector from W→W sharing events if it were possible to detect these events in hardware. Instead, inserting the extra loads using binary instrumentation slows the program an additional 5–130% of its original speed. This reduces the performance gains seen by the demand-driven race detector by less than 5% in all cases (e.g. the speedup seen by freqmine is reduced from 13.5× to 12.9×).
7.5 Negating the Limited Cache Size Even when observing RFO HITM events, we do not observe the remaining races in facesim. As mentioned, these data races are missed because the data from the first write is evicted from the L2 cache before the second thread’s read or write. This is an inherent limitation of our cache-eventbased race detection architecture. There are a number of ways that this shortcoming might be mitigated. 1. Ignore the problem, as races that take place far apart (such that the cache has enough time to evict the modified line) may be less likely to affect the program’s output. 2. Increase the size of the monitored L2 cache. 3. Take events when data is evicted from the cache, as ECMon does [27]. 4. Perturb the schedules of the threads such that the sections that may race are put closer to one another by, for instance, placing sleep() calls throughout the code to perturb the regular schedules [32]. This is an active area of research in concurrency bug analysis [11]. We choose to focus on method 4, leaving a more in-depth analysis of the tradeoffs in this area for a future work. We
Table 3: Change in detection accuracy with HITMs on RFOs. By taking HITM events on the innocuous loads before the stores to shared variables, we are able to observe the previously missed W→W races, though we still miss the races in facesim due to cache size limitations. This table lists only the benchmarks that previously had less than 100% accuracy. facesim
streamcluster
SpiderMonkey-0
SpiderMonkey-1
W→W
0/1 (0%)
1/1 (100%)
9/9 (100%)
1/1 (100%)
1/1 (100%)
R→W
0/1 (0%)
1/1 (100%)
3/3 (100%)
-
1/1 (100%)
Total
found that by modifying the scheduling of the threads, we were able to cause the racy regions to overlap, and were able to detect both remaining races in facesim. This process, however, was labor-intensive in its current form, and we think a more systematic method (such as those in the literature) would help. In general, through a combination of techniques, our demand-driven race detector was able to observe all data races that the continuous-analysis Inspector XE race detector observed.
8.
RELATED WORK
8.1 Data Race Detection Data races are common concurrency bugs that affect many parallel programs. Netzer and Miller formalized the definitions of both feasible data races (those that could happen in some possible program ordering) and apparent data races (those that can be inferred based on the explicitly observed synchronization of the program) [30]. This work focuses on the latter. R Inspector XE [2, 3], but This paper focuses on Intel there are also other commercial and open-source race detectors in use. Examples include Valgrind’s Helgrind tool [18], Google ThreadSanitizer [39], IBM Multicore SDK [35], and Oracle (formerly Sun) Thread Analyzer [42]. Some of the race detection algorithms used in these tools are based on detecting violations of Lamport’s happens-before relation [19], while others use the lockset algorithm [38] or a hybrid combination of the two [31]. In general, these tools all suffer from high overheads. For example, our measurements put Helgrind at about the same order of magnitude as the continuous-analysis Inspector XE. We feel that our demand-driven analysis technique would be amenable to many, if not all, of these race detectors.
8.2 Software Acceleration Methods Dynamic data race detectors can have extremely high overheads, so researchers have looked at software mechanisms for improving their performance. Choi et al. use static analysis methods to find memory operations that are subsumed by more important accesses [9], while Sack et al. looked into ways of filtering superfluous race detection in software [37]. FastTrack shows that by carefully using scalar clocks instead of vector clocks, a happens-before race detector can be made much faster without significant loss of accuracy [12]. In a different vein, Umbra shows methods for making the shadow memory accesses needed for dynamic analysis tools much more efficient [46]. Though these works show large performance improvements, current dynamic data race detectors are still quite slow. As we show in this work, our hardware-assisted demand-driven race detection method is able to achieve much higher per-
SpiderMonkey-2
67/69 (97%)
formance than a commercial race detection tool that uses a number of the mechanisms present in the literature. A somewhat different software method of increasing race detection performance is to use memory access sampling. LiteRace [23] and PACER [7] present methods of performing data race detection on a user-controllable subset of the dynamic memory accesses of a program. In doing so, they are able to make the overheads user-controlled at the expense of missing some races. The choice of sampling is orthogonal to our work, however, as sampling could be added to a demand-driven race detector, with the higher performance of the demand-driven tool yielding fewer false negatives under a performance threshold. We previously showed this combination of demand analysis and sampling for other dynamic analysis systems [13].
8.3 Hardware Race Detection Hardware race detection systems take advantage of the fact that cache events are related to software data sharing by tracking these events and using them as signals to other hardware mechanisms. One popular area of research in hardware race detection is hardware race recorders, which are used for post-mortem data race debugging [1]. Systems such as FDR record enough information about inter-processor cache events (and other metrics) to backing store that it is possible to deterministically replay the multi-threaded software execution afterwards to observe the bug occurring again [16, 28, 45]. These systems are unable to perform online race detection. There has also been work in performing dynamic race detection within hardware. Min and Choi described one of the earliest works in this area; their system performs happens-before analysis on the cache line level, and uses inter-processor cache events to detect sharing [24]. Their system came with a number of limitations, however, as they assume that cache evictions will be caught by the OS and virtualized (a slow proposition), and that shared variables will be contained on their own cache line. More recently, CORD and HARD described hardware happens-before and lockset race detectors, respectively [34, 47]. The former uses inter-processor cache events to detect data sharing and studies the accuracy loss of ignoring races that happen outside of the cache. The latter uses bloom filters to detect when a variable has associated lockset data that is stored alongside the cache (and in main memory). Muzahid et al. describe a signature-based mechanism, SigRace, where accesses that conflict in a lossy filter will cause the hardware to roll back execution and enable hardware race detection [26]. Despite their ability to find data races while running the original application at (close to) full speed, these hardware race detectors require application-specific additions to the processor’s pipeline and cache system. Unlike our proposed solution, these systems do not currently exist in processors,
though some of their additions may be useful in making a more accurate demand-driven software race detector.
8.4 Observing Hardware Events Other researchers have proposed hardware structures that make memory events available to the user. Horowitz et al. described Informing Memory Operations, or memory operations that cause execution to branch to a user-defined handler whenever a cache miss occurs [15]. Nagarajan and Gupta proposed ECMon, a hardware mechanism that can take user-level interrupts when a program causes particular cache events [27]. They mention that these events could be used to perform lockset-based race detection, though they do not give any details of an implementation. Regardless, both IMO and ECMon require user-level interrupts, as their designers expect to perform actions on every cache or memory event. In comparison, this work describes a way to perform demand-driven detection while requiring many fewer hardware changes and taking many fewer interrupts. We were able to do build our demand-driven race detector by utilizing the performance counter system that already exists on commercial microprocessors. Post-silicon verification of hardware operation and offline software optimization are the most common uses of these performance counters [41], but a number of researchers have looked into new ways of using these devices. Because processor activity can be monitored using these counters, Singh et al. use them to estimate power usage in a processor [40]. Additionally, Singh et al. and Chen et al. both propose using performance counters as input to the process scheduler in an effort to better utilize processor resources [8, 40].
8.5 Demand Analysis Our demand-driven race detector is not the first demanddriven dynamic analysis tool. Ho et al. described a system that uses a virtual machine monitor in combination with a software emulator to perform demand-driven taint analysis [14]. By marking pages that contained tainted values as unavailable in the virtual memory system, they were able to take page faults whenever accessing memory near a value they wanted to analyze. This allowed them to disable their analysis routines until they began working on data that needed to be analyzed, yielding significant performance improvements when not operating on tainted data. Unfortunately, this mechanism is not usable for data race detection between threads within the same process space, as each thread exists within the same virtual memory space. Berger et al. sidestepped this problem in their tool, Grace, by limiting it to fork/join parallel code and starting a new process, rather than thread, at each fork [5]. Nonetheless, using the paging system for sharing detection could lead to a significant number of false positives, as pages are usually much larger than the granularity on which data is shared. By using cache lines, which are much smaller, we avoid most false sharing cases.
9.
CONCLUSION AND FUTURE WORK
In this paper we designed a demand-driven race detector. Because happens-before race detectors find apparent data races by observing data sharing events that are not appropriately protected, there is no need to execute the race detection analyses if there is no data sharing. Our demanddriven tool therefore does not perform race detection until
a hardware-based indicator informs it that the program has entered a section that is potentially sharing data. We then described how to use the performance counter facilities on current consumer processors to build this hardware sharing indicator and used this to build a demand-driven race detector. We showed that demand-driven race detection can significantly increase the performance of software race detectors. We were able to achieve a mean performance improvement of 10× in the Phoenix benchmark suite because its programs have little data sharing, while we observed 3× performance improvements in the PARSEC suite. While using cache events to perform demand-driven analysis can cause the race detector to miss some races, we show a number of solutions to combat these inaccuracies. Our demand-driven detector was able to catch 97% of the races observed using a continuous-analysis detector, two of which were new bugs in the PARSEC suite that have been reported to the developers. Future research directions include new methods of automatically scheduling threads so that their potentially racy regions are in the cache at the same time. Current works in this area focus on perturbing thread schedules in order to cause errors to manifest, which is slightly different than the data-oriented idea of observing cache-line sharing. Another potentially fruitful direction of research may come from expanding the use of architectural performance counters to accelerate other software analyses. For example, detectors such as Valgrind’s MemCheck that only care about uninitialized values may benefit from only operating on data that has recently missed in the cache. Finally, there are more useful directions to take fine-grained memory analysis. This demand-driven race detection would benefit from systems such as ECMon and MemTracker, but these hardware systems will not be built if they do not offer enough advantages to offset their design and verification costs. The ideal demand-driven detector described in this paper is one more work that would benefit from a generalized memory analysis framework.
10. ACKNOWLEDGMENTS We wish to thank Matt Braun and the rest of the Inspector XE team for their help and insights throughout this project. Thanks to Lee Baugh for his suggestions about testing RFOs, and to Debapriya Chatterjee, Jason Clemons, and Andrea Pellegrini for their edits and suggestions. The authors acknowledge the support of the Gigascale Systems Research Center.
11. REFERENCES [1] D. F. Bacon and S. C. Goldstein. Hardware-assisted replay of multiprocessor programs. In ACM/ONR Workshop on Parallel & Distributed Debugging, 1991. [2] U. Banerjee, B. Bliss, Z. Ma, and P. Petersen. A theory of data race detection. In Workshop on Parallel and Distributed Systems: Testing and Debugging, 2006. [3] U. Banerjee, B. Bliss, Z. Ma, and P. Petersen. Unraveling data race detection in the Intel Thread Checker. In Workshop on Software Tools for MultiCore Systems, 2006. [4] L. Baugh, N. Neelakantam, and C. Zilles. Using hardware memory protection to build a high-performance, strongly-atomic hybrid transactional memory. In Int’l. Symp. on Computer Architecture (ISCA), 2008. [5] E. D. Berger, T. Yang, T. Liu, and G. Novark. Grace: Safe multithreaded programming for C/C++. In Conf. on
[6]
[7]
[8]
[9]
[10]
[11]
[12] [13]
[14]
[15]
[16]
[17]
[18]
[19]
[20]
[21]
[22]
[23]
[24]
[25]
Object-Oriented Programming Systems, Languages, and Applications (OOPSLA), 2009. C. Bienia, S. Kumar, J. P. Singh, and K. Li. The PARSEC benchmark suite: Characterization and architectural implications. In Int’l. Conf. on Parallel Architecture and Compilation Techniques (PACT), 2008. M. D. Bond, K. E. Coons, and K. S. McKinley. PACER: Proportional detection of data races. In Conf. on Programming Language Design and Implementation (PLDI), 2010. H. Chen, W.-C. Hsu, J. Lu, P.-C. Yew, and D.-Y. Chen. Dynamic trace selection using performance monitoring hardware sampling. In Int’l Symp. on Code Generation and Optimization (CGO), 2003. J.-D. Choi, K. Lee, A. Loginov, R. O’Callahan, V. Sarkar, and M. Sridharan. Efficient and precise datarace detection for multithreaded object-oriented programs. In Conf. on Programming Language Design and Implementation, 2002. P. Damron, A. Fedorova, Y. Lev, V. Luchangco, M. Moir, and D. Nussbaum. Hybrid transactional memory. In Int’l Conf. on Architectural Support for Programming Languages and Operating Systems (ASPLOS), 2006. O. Edelstein, E. Farchi, Y. Nir, G. Ratsaby, and S. Ur. Multithreaded java program test generation. IBM Systems Journal, 41:111–125, 2002. C. Flannagan and S. N. Freund. FastTrack: Efficient and precise dynamic race detection. In PLDI, 2009. J. L. Greathouse, C. LeBlanc, T. Austin, and V. Bertacco. Highly scalable distributed dataflow analysis. In Int’l Symp. on Code Generation and Optimization (CGO), 2011. A. Ho, M. Fetterman, C. Clark, A. Warfield, and S. Hand. Practical taint-based protection using demand emulation. In European Conf. on Computer Systems (EuroSys), 2006. M. Horowitz, M. Martonosi, T. C. Mowry, and M. D. Smith. Informing memory operations: Memory performance feedback mechanisms and their applications. Trans. on Computer Systems, 16:170–205, 1998. D. R. Hower and M. D. Hill. Rerun: Exploiting episodes for lightweight memory race recording. In Int’l Symp. on Computer Architecture (ISCA), 2008. N. Jalbert, C. Pereira, G. Pokam, and K. Sen. RADBench: A Concurrency Bug Benchmark Suite. In Workshop on Hot Topics in Parallelism (HotPar), 2011. A. Jannesari, K. Bao, V. Pankratius, and W. F. Tichy. Helgrind+: An efficient dynamic race detector. In Int’l Parallel & Distributed Processing Symp. (IPDPS), 2009. L. Lamport. Time, clocks, and the ordering of events in a distributed system. Communications of the ACM, 21(7):558–565, 1978. S. Lu, S. Park, E. Seo, and Y. Zhou. Learning from mistakes - a comprehensive study on real world concurrency bug characteristics. In Int’l Conf. on Architectural Support for Programming Languages and Operating Systems (ASPLOS), 2008. S. Lu, J. Tucek, F. Qin, and Y. Zhou. AVIO: Detecting atomicity violations via access interleaving invariants. In Int’l Conf. on Architectural Support for Programming Languages and Operating Systems (ASPLOS), 2006. C.-K. Luk, R. Cohn, R. Muth, H. Patil, A. Klauser, G. Lowney, S. Wallace, V. J. Reddi, and K. Hazelwood. Pin: Building customized program analysis tools with dynamic instrumentation. In Conf. on Programming Language Design and Implementation (PLDI), 2005. D. Marino, M. Musuvathi, and S. Narayanasamy. LiteRace: Effective sampling for lightweight data-race detection. In Conf. on Programming Language Design and Implementation (PLDI), 2009. S. L. Min and J.-D. Choi. An efficient cache-based access anomaly detection scheme. In Int’l Conf. on Architectural Support for Programming Languages and Operating Systems (ASPLOS), 1991. K. E. Moore, J. Bobba, M. J. Moravan, M. D. Hill, and D. A. Wood. LogTM: Log-based transactional memory. In Int’l Symp. on High-Performance Computer Architecture (HPCA), 2006.
[26] A. Muzahid, D. Su´ arez, J. Torrellas, and S. Qi. SigRace: Signature-based data race detection. In Int’l Symp. on Computer Architecture (ISCA), 2009. [27] V. Nagarajan and R. Gupta. ECMon: Exposing cache events for monitoring. In Int’l Symp. on Computer Architecture (ISCA), 2009. [28] S. Narayanasamy, G. Pokam, and B. Calder. BugNet: Continuously recording program execution for deterministic replay debugging. In Int’l Symp. on Computer Architecture (ISCA), 2005. [29] National Vulnerability Database. Vulnerability Summary for CVE-2010-3864: OpenSSL 1.0.0. http: //web.nvd.nist.gov/view/vuln/detail?vulnId=CVE-2010-3864, 2010. [30] R. H. B. Netzer and B. P. Miller. What are race conditions? some issues and formalizations. ACM Letters on Programming Languages and Systems, 1(1):74–88, March 1992. [31] R. O’Callahan and J.-D. Choi. Hybrid dynamic data race detection. In Symp. on Principles and Practice of Parallel Programming (PPoPP), 2003. [32] S. Park, S. Lu, and Y. Zhou. CTrigger: Exposing atomicity violation bugs from their hiding places. In Int’l Conf. on Architectural Support for Programming Languages and Operating Systems (ASPLOS), 2009. [33] J. Pincus and B. Baker. Beyond stack smashing: Recent advances in exploiting buffer overruns. IEEE Security and Privacy, 2(4):20–27, 2004. [34] M. Prvulovic. CORD: Cost-effective (and nearly overhead-free) order-recording and data race detection. In Int’l Symp. on High-Performance Computer Architecture (HPCA), 2006. [35] Y. Qi, R. Das, Z. D. Luo, and M. Trotter. MulticoreSDK: A practical and efficient data race detector for real-world applications. In Workshop on Parallel and Distributed Systems: Testing, Analysis, and Debugging, 2009. [36] C. Ranger, R. Raghuraman, A. Penmetsa, G. Bradski, and C. Kozyrakis. Evaluating MapReduce for multi-core and multiprocessor systems. In Int’l. Symp. on High-Performance Computer Architecture (HPCA), 2007. [37] P. Sack, B. E. Bliss, Z. Ma, P. Petersen, and J. Torrellas. Accurate and efficient filtering for the Intel Thread Checker race detector. In Workshop on Architectural and System Support for Improving Software Dependability, 2006. [38] S. Savage, M. Burrows, G. Nelson, P. Sobalvarro, and T. Anderson. Eraser: A dynamic data race detector for multithreaded programs. Trans. on Computer Systems, 15(4):391–411, 1997. [39] K. Serebryany and T. Iskhodzhanov. ThreadSanitizer – data race detection in practice. In Workshop on Binary Instrumentation and Applications, 2009. [40] K. Singh, M. Bhadauria, and S. A. McKee. Real time power estimation and thread scheduling via performance counters. In Workshop on Design, Architecture, and Simulation of Chip Multi-Processors, 2008. [41] B. Sprunt. The basics of performance-monitoring hardware. IEEE Micro, 22(4):64–71, 2002. [42] C. Terboven. Comparing Intel Thread Checker and Sun Thread Analyzer. Parallel Computing: Architectures, Algorithms and Applications, 38:669–676, 2007. [43] G. Venkataramani, I. Doudalis, Y. Solihin, and M. Prvulovic. MemTracker: An accelerator for memory debugging and monitoring. ACM Transactions on Architecture and Code Optimization, 6(2):1–33, 2009. [44] E. Witchel. Mondriaan Memory Protection. PhD thesis, Massachusetts Institute of Technology, January 2004. [45] M. Xu, R. Bodik, and M. D. Hill. A “Flight Data Recorder” for enabling full-system multiprocessor deterministic replay. In Int’l Symp. on Computer Architecture (ISCA), 2003. [46] Q. Zhao, D. Bruening, and S. Amarasinghe. Umbra: Efficient and scalable memory shadowing. In Int’l Symp. on Code Generation and Optimization (CGO), 2010. [47] P. Zhou, R. Teodorescu, and Y. Zhou. HARD: Hardware-assisted lockset-based race detection. In Int’l Symp. on High-Performance Computer Architecture (HPCA), 2007.