tions and the underlying IT infrastructure, such as servers and databases. ... of a management system is to monitor vital attributes of network in an auto- ... management and integrated management tools that automatically monitor the.
Dependency Detection Using a Fuzzy Engine Dimitrios Dechouniotis1 , Xenofontas Dimitropoulos2 , Andreas Kind2 , Spyros Denazis1 1
2
University of Patras, Rion Patras 26500, Greece. IBM Zurich Research Laboratory, 8803 Rueschlikon, Switzerland. {ddexouni,sdena}@ece.upatras.gr, {xed,ank}@zurich.ibm.com
Abstract. The discovery of dependencies between components of a network can reveal relationships among components of multi-tier applications and the underlying IT infrastructure, such as servers and databases. Knowledge of these dependencies is thus important for the management of large distributed, heterogeneous and virtualized systems, where it is difficult to maintain an accurate view of how network assets are functionally connected. In this paper we present a passive method that uses attributes of traffic flow records and derives traffic dependencies among network components using a flexible fuzzy inference mechanism. Simulations and evaluation with real traffic traces show the applicability of the approach for flow-based dependency detection.
1
Introduction
In the past several years, a result of the rapid growth of the Internet is the development of distributed, heterogeneous and virtualized networks. Monitoring and management of such systems have become a critical issue. The purpose of a management system is to monitor vital attributes of network in an automatic manner and to take action whenever needed. Furthermore, with the rapid evolution of enterprise networks, many different applications and services are being developed. Most of them are distributed and consist of different components. Availability and performance of these services are important for revenuegenerating business processes, so enterprises enter service level agreement (SLA) with Internet service providers (ISPs). The monitoring of the performance of the services, according to the SLA, is a crucial issue of network management. Due to the financial impact of SLAs, there is great research interest in service management and integrated management tools that automatically monitor the performance of multi-tier applications and that can also autonomously handle arising problems. A functional and structural model of a service or application is a powerful tool for the maintenance, expansion and performance analysis of the service. It helps administrators to detect which component of a service is responsible for a possible failure and which other business processes will be affected. These two problems are known as root cause analysis and business impact analysis, respectively. The first step in building an operational model of a service is to completely understand the interaction of the network components that comprise an integrated application. Because of the complexity and the heterogeneity
of enterprise networks, there are many types of relationships and dependencies between the parts of multi-tier applications. In [1], Keller et al. presents a good definition and classification of the different types of dependencies among service components. This classification is based on many characteristics, such as locality, domain, component type and activity as well as dependency detection method and strength. Our work focuses on the problem of detecting dependencies between IT components by examining attributes of flow records in enterprise networks. This is particularly useful for administrators in order to predict the impact of low service performance and to detect which network component is at the root of a problem. It potentially reduces recovery time and is useful to predict the impact of maintenance operations on the performance of the entire system. Furthermore, it is a powerful designing tool for expanding the IT infrastructure, reducing operational costs and complexity as well as decoupling the various parts of different services and business processes. This work investigates the problem of detecting dependencies between network components in order to reveal relationships between parts of multi-tier applications and, more generally, of business processes. We present a novel method of discovery using attributes of traffic records and a fuzzy inference engine. A fuzzy inference mechanism is appropriate for dependency detection for two major reasons. First, there are many quantitative features so that it is more natural to use a modelling approach in terms of fuzziness than based on sharp boundary intervals. Second, the fuzziness employed in representing these features helps to smooth the strict separation of dependency versus non-dependency. The remainder of the paper is structured as follows. The next section discusses related work. Section 3 contains an analytical description of our algorithm, which is based on collecting traffic attributes of network and analyzing them with the help of a fuzzy system. Section 4 describes the implementation and evaluation of the approach using real data as well as some simulations. In Section 5, we discuss the limitations of our method. The paper finishes with the conclusions and an outlook in Section 6.
2
Related Work
Kind et al. [2] present an ad hoc passive method that uses NetFlow records and the start and end timestamps to discover relationships between network assets. A similar approach is presented in [3], which uses the start and end timestamps of a flow record to produce dependency graphs between network components. Chen et al. provide a framework in [4] to identify which components are used to satisfy each individual request by instrumenting the middleware and the communication layer between network components. Brown et al. [5] present an active dependency discovery method to determine the dynamic relationships between parts of a service. Kar et al. [6] use data collected from system information repositories, such as the IBM AIX Object Data Manager (ODM), which keeps track of the installed software package, file sets and their versions to enable a de-
pendency analysis for managing application services. Another ad hoc technique is proposed in [7], the authors use Leslie graphs to represent the relationships between components of IT systems. A passive statistical approach based on the timestamps of flow records is presented in [8]. It provides a direct dependency estimation method that calculates the probability with which a transaction of a flow is contained in at least one other transaction. Kashima et al. propose a concrete modelling method for discovering direct dependencies by calculating the service call frequency matrix and the service call ratio (SCR) matrix, which reveal dependency values regardless of the work load intensity. In [9], a neural network approach is used for automated generation of service dependency models. The behaviour of hosts was monitored repeatedly by collecting time series of their activities, such as CPU activity of a host, communication bandwidth used by a system. The neural networks are fed with these time series to determine whether there is a dependency. Finally a data-mining technique exists that can be used to discover correlation between data of databases. In [10], the author proposes a method of detecting time correlations in time-series data streams in order to discover service relationships and analyze the business impact analysis.
3
Dependency Discovery
We consider the problem of detecting dependencies between IT elements by examining attributes of flow records in enterprise networks. These relationships can be classified into intra-system and inter-system dependencies. Intra-system dependencies are the dependencies between components of an enterprise network located within a single site. Inter-system dependencies describe the relationships between components of an enterprise network that are distributed across more than one site. The existing approaches for identifying relationships can be classified into active and passive methods. The basic idea of active discovery methods is to generate traffic flows from a starting point and use an iterative algorithm to explore the entire network up to an end point. Passive mapping performs the collection and analysis of traffic characteristics without generating any kind of traffic. The collection of the necessary information can be done by any traffic meter that exports NetFlow/IPFIX flow information, such as many routers and switches (see [11]). NetFlow provides flow-based traffic information, such as source/destination IP address, protocol and source and destination ports. Apart from the tuple that defines a flow, we can collect other attributes such as packet and octet volumes. In our approach, we are interested in detecting dependencies by examining the attributes of flow records. The most important characteristics are the start and end timestamps of flows. By examining these time stamps we would like to decide whether a flow triggers the start of another flow. This trigger can be interpreted on the functional level of a service as the connection of two different components to execute a specific task that is part of the same service or business process. By identifying all these relationships between network components of a service, we can obtain a clear overview in terms of which elements of network infrastructure are responsible for the provision of a particular ser-
vice and business process. Before we formalize what a flow dependency is, it is essential for our algorithm to introduce a formal definition of the flow concept. 3.1
Flows and Events
We define a flow f as a 3-tuple of the following basic traffic attributes f = (srcIP, dstIP, dstP ort) ∈ F, where srcIP and dstIP are the IP address of source and destination host, respectively, and dstPort is the TCP/UDP service port of destination host. The set of all flows is denoted by F. We only use dstPort because it can be assumed that in most TCP-based server environments the destination port is identical to the service port. The source port is, however, randomly chosen and thus not useful for further analysis. If we had used source port for flow definition, then two different requests from the same source host to the same destination would create two different flows. This is not desirable because these two flows are related with the same task. An event—typically a NetFlow record—is defined as e = (f, ts , te , octs, pkts) ∈ E, where f is the flow as defined and ts and te are the start and end timestamps of a flow event respectively, octs and pkts are the number of bytes and packets of a flow respectively. The set of all events is denoted as E. Finally we denote the set of all events of a given flow f as E(f ) = {e ∈ E | fe = f }. The dstPort cannot be assigned to an application but it can be only an indication of it, because nowadays many applications use unpublished or dynamically assigned ports. By the definitions of flow and event and analyzing the event attributes, we can easily distinguish whether a specific host acts as server or client. As a server always accepts requests in a specific port, all requests from the same source host are represented by the same flow. This fact can be exploited for focusing our attention on some entities, such as server and databases, which are integral components of multi-tier distributed services and applications. Running our algorithm for extended time periods many dependencies that are not so obvious will reveal such as the use of a secondary or backup server. 3.2
Flow Pair and Event Pair
An event can present the attributes of a connection between two hosts, but it cannot reveal any relationship among many hosts that are integral parts of a process or service. Nowadays, most of the applications and services are multi-tier. This means that they are based on different individual components, which are distributed and strongly depended one on the other. Hence, the main goal of our algorithm is to identify network assets that are parts of a multi-tier application
and to measure the strength of their dependency. The basic principle of our approach is to identify which flow pairs (or chains of flows) occur more often than other pairs do. The existence of specific frequent flow pairs can show a functional dependency between specific hosts. For the aforementioned reason we must define what a flow pair is. We consider that any two flows in F define a flow pair if the following two conditions are satisfied: - the destination IP address of the first flow is identical to the source IP address of the second flow. - the destination of the second flow is not identical to the source of the first flow. We exclude the case that the destination IP of second flow is identical to the source IP of the first flow, because this reveal a client-server relationships. Since we are interested in detecting relationship between more than two hosts that are components of multi-tier services, client-server relationships cannot reveal such kind of dependencies. Assuming any two different flows fi and fj in F, where fi = (srcIPi , dstIPi , dstP orti ) fj = (srcIPj , dstIPj , dstP ortj ) the flow pair function is defined as 1 if dstIPi = srcIPj ∧ srcIPi 6= dstIPj fp (fi , fj ) = 0 otherwise. After the definition of the flow-pair function, we define the set of all event pairs for any two different flows fi and fj in F. Assuming any two different events ek ,el in E, ek = (fi , tsk , tek , octsk , pktsk ) ∈ E(fi ). el = (fj , tsl , tel , octsl , pktsl ) ∈ E(fj ). the set of all event pairs P for any two flows fi and fj in F, with fi 6= fj , is defined as P (fi , fj ) = {(ek , el ) | 0 ≤ tsl − tsk < tmax ∧ fp (fi , fj ) = 1}. As shown in the above definition, two events are considered an event pair if they satisfy the flow-pair function and the difference of their start timestamps is less than tmax . The main idea of using this time difference as a criterion of dependency is that flow events close in time are likely to be really dependent. The value of tmax is critical for the success of the algorithm. If it is too small, then dependencies between heavily-loaded servers can not be identified. On the other side, if it is too large, then it is possible to identify false dependencies between hosts that they do not have any operational relationship. Also tmax depends mostly on the time that a server or a database needs to process a request and reply. This processing time varies and depends on the complexity of the request and the work-load of the server. From our experience a logical value for tmax can be 10 seconds.
3.3
Confidence Variables
The time difference of the start timestamps of two events cannot be a safe metric of dependency by itself. In heavily-loaded networks there is high probability of discovering many erroneous event pairs, which were created by chance. To reduce the erroneously recognized dependencies between hosts, we use a metric to express how confident we are that an event pair is real. We define two confidence variables based on the following concepts: - If a specific event pair occurs many times, then our confidence for this pair is high. - Assume that there is a set of event pairs between any two flows f1 and f2 . If the ratio between the number of these event pairs and the number of events e1 and e2 that do not belong to any of these event pairs is high, then we are more confident that the event pair exhibits a dependency. We encode the previous considerations in the math expressions of two confidence variables c1 (f1 , f2 ) and c2 (f1 , f2 ): - c1 (f1 , f2 ) =
|P (f1 ,f2 )| , µ
where |P (f1 , f2 )| is the number of event pairs and µ is the average number of elements of all P P sets of all event pairs described by the expression: P (fi ,fj ) µ = i=1..m j=1..m m - c2 (f1 , f2 ) =
|P (f1 ,f2 )| |P (f1 ,f2 )|+|E(f1w )|+|E(f2w )|
where |P (f1 , f2 )| is the same as before, |E(f1w )| and |E(f2w )| are the numbers of sets E(f1w ) and E(f2w ), respectively, which are defined, given a P (f1 , f2 ), as follows: E(f1w ) = {e1 | e1 �E(f1 ) and e1 6∈ P (f1 , f2 )} E(f2w ) = {e2 | e2 �E(f2 ) and e2 6∈ P (f1 , f2 )}. In other words, |E(f1w )| and |E(f2w )| represent how many events of flows f1 and f2 , respectively, do not participate in the creation of an event pair that is an element of set P (f1 , f2 ). We can also define different confidence variables or a combination of the variables defined above. 3.4
Fuzzy system
Fuzzy systems have demonstrated their ability to solve different kinds of problems in various applications. Our method of discovering relationships between network hosts and service components is based on fuzzy logic. We can build a fuzzy inference engine that can determine how strong or weak the dependency of an event pair is. The advantages of a fuzzy inference mechanism are that it has a simple and flexible structure and can be used in different networks. In addition, it can describe, in an intuitive and user-friendly manner, the problem
mf(x)
Rule base
Outputs
Defuzzifcation
Fuzzifc iation
Inputs
Inference mechanism
1 S
M
H x
Fig. 1. Structure of a fuzzy system and membership functions
of detecting relationships without making assumptions about the nature of the correlated traffic. But, in fact, these assumptions may not be valid or absolutely correct. Also, fuzzy logic helps to smooth the strict separation of dependency and non-dependency and the quantitative features (e.g., time and confidence variables) can be modelled in terms of fuzziness rather than using hard boundary intervals. The fuzzy system is based on the transformation of our knowledge into a set of fuzzy rules. Input and output of the fuzzy system are expressed by the linguistic values of the fuzzy variables of the system. A fuzzy system [12] (Fig. 1) is composed of the following four elements: - A fuzzification interface, which converts the inputs into fuzzy information that the inference mechanism can easily use to activate and apply rules. - A rule base (a set of If-Then rules), which contains a fuzzy logic quantification of the linguistic description of our knowledge. - An inference mechanism which emulates the expert’s decision making in interpreting and applying knowledge about how to compute the correct output. - A defuzzification interface, which converts the conclusions of the inference mechanism into numerical output. Note that the fuzzification and defuzzification interfaces of a fuzzy system have to be described in greater detail. Each input and output of the system is described by linguistic values and their membership functions (Fig. 1). Linguistic values are terms, such as LOW, HIGH, MEDIUM, that intuitively describe the fuzzy input/output parameters. Membership functions of a linguistic value describe the degree of certainty of the numeric value of an input or output to be classified under the specific linguistic value. Typical membership functions can be triangular, such as that at the right side in Fig. 1, but can also have different shapes, like Gaussian or trapezoid. One interesting property of membership functions is that a numerical input can be converted into two linguistic values simultaneously. This feature is appropriate for modelling quantitative attributes that do not use hard boundary intervals like time and confidence variables. 3.5
Fuzzy System for Dependency Detection
In our approach, we build a fuzzy system with three input parameters and one output parameter. The input parameter are the following
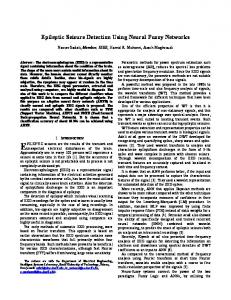
Fig. 2. Dependency surface
- The difference between the start timestamps of two event of a event pair, dt = ts2 − ts1 . - The confidence variable c1 (f1 , f2 ) of an event pair, as defined above, which represents our confidence to the most frequent event pairs. - The confidence variable c2 (f1 , f2 ) of an event pair, as defined above, which is used to separate correctly correlated from wrongly identified event pairs. The output of the fuzzy system is the degree of dependency for every event pair, dep(f1 , f2 )�[0, 1]. Each of the three input/output parameter are described by five linguistic values (VERY SMALL, SMALL, MEDIUM, HIGH, VERY HIGH) with triangular membership functions. We select triangle membership functions because they are simple and can represent the fuzziness of input and output parameter in a effective manner. The rule base consisted of 125 rules, which can describe all possible combinations of the input parameters. Furthermore, rules can be merged into a smaller set because some of them can be merged into a single rule. Another interesting feature of fuzzy systems, which illustrates their ability of describing complex systems, is the control surface. The name comes from the use of fuzzy system to control complex industrial systems and processes. In our approach, we can call it dependency surface because it presents all possible values of a dependency according to input values. Fig. 2 depicts the dependency surface for c1 (f1 , f2 ) = 85 and every possible value of time difference and confidence variable c2 (f1 , f2 ). This figure reveals that a fuzzy system can convert our knowledge -expressed in linguistic terms- into a non-linear surface that represents the inference mechanism of extracting dependencies between events. We can easily adapt our fuzzy inference engine and its dependency surface by changing the rule-base and the membership functions of linguistic values. This feature allows us to change the properties of our fuzzy mechanism and adapt it
Proxy Server
Real Data
1
1
0.8
0.8
0.8
0.6
0.4
0.2
0
Dependency
1
Dependency
Dependency
Simulation
0.6
0.4
0.2
0
5
Time[s]
10
0
0.6
0.4
0.2
0
5
Time[s]
10
0
0
5
10
Time[s]
Fig. 3. Dependency using known event pairs, a proxy server and real data
according to the various attributes of enterprise networks. This surface is more flexible and effective than an assumption that the correlation between flows and events can be modelled by a specific time distribution.
4
Implementation and Evaluation
The dependency algorithm was tested in three different scenarios. Firstly, we ran some simulations generating random events and mixed them with a known number of related events. In the second evaluation test, some hosts were connected to a network through a proxy server. The hosts generated events by browsing on the Internet. Our algorithm analyzed these flow events with the aim to discover the known relationships. We use flow-based network profiling system developed in the IBM Aurora project [13] for the collection and processing of flow events. The system can collect, store, and analyze NetFlow/IPFIX records. Finally we tested our algorithm using real flows from a high-speed enterprise network to discover relationships between servers. The steps in the algorithm for dependency detection are the following, i Parse NetFlow records and sort events by start timestamps. ii Walk through events with a time window of tmax and compute confidence variables for each event pair. iii Walk through events and compute the output of the fuzzy system (dependency) for each event pair. iv Sort event pairs by their dependency. v Generate a file of event pairs having a high dependency. In the first evaluation test, we generate files containing a large number of random events and inject it events that create specific event pairs. We analyze
these data with our algorithm to test whether it can identify and separate the known event pairs from wrongly identified event pairs. The results show that the algorithm identifies all correct event pairs and distinguishes them correctly from the false event pairs produced. The left part of Fig. 3 illustrates the results of simulation using 5x10⁴ random events mixed with events which create 10 known event pairs. The correlated events are produced by random Gaussian distributions with a mean value between 0 and tmax = 10 and unitary standard deviation. The dependency for correct event pairs is around 0.9. The dependency of flow event pairs that were randomly generated ranges between 0 and 0.36. This means that our algorithm managed to identify successfully all real pairs, assign them large dependency values and distinguish them from the false pairs having lower dependency values. Furthermore we compared our method with the algorithm presented in [2]. We used exactly the same simulation data to test the two algorithms. The results in Table 3 show that our algorithm is more accurate. The algorithm in [2] failed to identify event pairs, if the difference of their start timestamp is large (≥ 7s). Also the correlation confidence value in [2] was very low, almost zero, for the pre-known event pairs and it was impossible to separate them from the erroneously generated. On the contrary the fuzzy inference engine identified successfully all the real event pairs and assigned them high dependency value. Table 1 illustrates the comparison of the two methods. Table 1. Accuracy of Fuzzy Inference Engine and Time Correlation Algorithm
identified known event pairs dependency value of known pairs
Fuzzy Inference Engine Time Correlation Algorithm 10 7 ˜ ˜ 0.9 0
In the second test, we used a network setup with client machines in a subnet that is connected to the Internet using a proxy server. The machines produce ca. 105 events per hour when browsing on the Internet. The algorithm for discovering dependencies processed the collected events in order to identify the relationship between individual hosts, proxy server and web server. On the middle of Fig. 3, the graph shows the highest dependent event pairs (dep � [0.9, 0.99]), which correspond to the events that represent the connections between 10 hosts to the proxy server and the connections between the proxy server and the web server. Many wrong event pairs were produced, but their dependency was low. Fig. 3 also shows the 10 false event pairs having the highest dependency. It clearly visible that their dependency is significantly lower than the correct event pairs. Also another advantage of fuzzy system is that the dependency of false event pairs continuously decreased as the time passed. Finally our algorithm was tested with real data, collected from an enterprise network of 700 hosts. We collect 2.2x10⁵ flow records, which corresponds to one hour of data traffic in a larger enterprise. We applied the fuzzy inference
mechanism to detect the relationships between network components of multi-tier services and applications. Most of the event pairs produced (i.e, 96%) were false pairs having a low and very low dependency value. There are about 20 event pairs with a dependency value higher than 0.7. Some of them represent relationships between DNS servers, whereas the remaining event pairs reveal relationships between servers and databases of specific applications. As we can see on the right side of Fig. 3, there is a clear distinction of correct and false pairs. Our algorithm succeeds in identifying real pairs and assigning high dependency value to them. Moreover, it produces low dependency values for wrongly generated event pairs. Also it is not surprising that our algorithm identified few (about 20) event pairs with high dependency value, since correlated flows represent usually a small percentage of the overall traffic load of an enterprise network. The results of all tests were successful for our algorithm of relationship discovery. In every case, the fuzzy inference mechanism succeeded in identifying all correct event pairs and assigned them high dependency values. Additionally it separated correctly the correct event pairs by assigning low dependency values to the randomly generated event pairs. For the first two tests, the accuracy of the detection algorithm was 100%. The accuracy of our algorithm is also high for the third test. The event pairs with the highest dependency value correspond to correct dependencies between network assets like DNS servers and servers of particular applications. It would be useful to define a threshold value of dependency in order to decide if an event pair correctly represent a dependency. This threshold can vary for different networks, but it should be high (i.e., ≥ 0.7).
5
Limitations
The major limitation of the algorithm is the generation of a large number of false event pairs(≥ 95%). Most of them have very low dependency value. However, there are some pairs with high values, because they represent some network components that are used by more than one application or they are not frequently used. Another limitation is that if the traffic load is very heavy, the number of flow records we have to process can increase the processing time and the computational resources necessary. To reduce the vast amount of data, we can use some NetFlow techniques, like flow aggregation or sampling.
6
Conclusion and Future Work
This paper presented an algorithm for discovering relationships between network components using a fuzzy inference engine. Dependencies between certain network assets can correspond to operational relationships between parts of a specific service or application. A fuzzy inference mechanism is appropriate for dependency detection for two major reasons. First, there are many quantitative features, such as time correlation, for which it is more natural to be modelled in terms of fuzziness than using sharp boundary intervals. Second, the fuzziness employed in representing these features helps to smooth the strict separation
between dependency and non-dependency. Another advantage of the proposed method is that it is passive so that it does not produce any additional traffic load. To increase the flexibility of our method and reduce the generation of false dependencies, our future work will focus on using fuzzy adaptive and learning techniques based on neural networks and genetic algorithms.
References 1. Keller, A., Blumenthal, U., Kar, G.: Classification and computation of dependencies for distributed management. In: Proc. of the 5th IEEE Symposium on Computers and CommunicationsISCC. (2000) 78–83 2. Kind, A., Gantenbein, D., Etoh, H.: Relationship discovery with netflow to enable business-driven it management. In: Proc of the First IEEE/IFIP International Workshop on Business-Driven IT Management,BDIM. (2006) 63–70 3. Gupta, M., Neogi, A., Agarawal, M.K., Kar, G.: Discovering dynamic dependencies in enterprise enviroments for problem determination. In: Proc. of the 14th IEEE/IFIP International Workshop on Distributed Systems: Operations and Management. (2003) 4. Chen, M., Kiciman, E., Fratkin, E., Fox, A., Brewer, E.: Pinpoint:problem determination in large,dynamic internet services. In: Proc. of the International Conferance on Dependable Systems and Networks DSN. (2002) 595–604 5. Brown, A., Kar, G., Keller, A.: An active approach to characterizing dynamic dependencies for problem determination in a distributed enviroment. In: Proc of the International IFIP/IEEE Symposium on Intergrated Network Management. (2001) 377–390 6. Kar, G., Keller, A., Calo, S.: Managing application services over service provider networks: Architecture and dependency analysis. In: Proc. of the 7th International IFIP/IEEE Network Operations and Management Symposium NOMS. (2000) 61– 74 7. Bahl, P., Barham, P., Black, R., Chandra, R., Goldszmidt, M., Isaacs, R., Kandula, S., Li, L., MacCormick, J., Maltz, D., Mortier, R., Wawrzoniak, M., Zhang, M.: Discovering dependencies for network management. In: Proc. of the 5th Workshop on Hot Topics in Networks HotNets V. (2006) 97–102 8. Kashima, H., Tsumura, T., Ide, T., Nogayama, T., Etoh, R.H.H., Fukuda, T.: Network-based problem detection for distributed systems. In: Proc. of the 21th International Conference on Data Engineering ICDE. (2005) 978–989 9. Ensel, C.: New approach for automated generation of service dependency models. In: Proc. of the 2th Latin American Network Operation and Management Symposium LANOMS. (2001) 10. Sayal, M.: Detecting time correlations in time-series data streams. In: HP Technical Report HPL-2004-103. (2004) 11. CISCO: Netflow. http://www.cisco.com/en/US/products/ps6601/product ios protocol group home.html (2007) 12. Passino, K., Yurkovich, S.: FUZZY CONTROL. Addison-Wesley (1998) 13. IBM: Aurora – network traffic analysis and visualization. http://www.zurich. ibm.com/aurora (2007)