2001- 01- 0559
OBD Engine Fault Detection Using a Neural Approach Carlo N. Grimaldi and Francesco Mariani University of Perugia, Italy
Copyright © 2001 Society of Automotive Engineers, Inc.
ABSTRACT The present work is the continuation of the research activity developed by the same authors in last years about the use of recent technologies (Artificial Neural Networks) for the set up of "software redundancy" modules to be implemented On Board for the use in Diagnostic Systems. In the present work, a system based on Artificial Neural Networks models for automotive engines Fault Diagnosis and Isolation purposes is set-up and analysed. Four sensors/actuators (throttle valve, rotational speed, torque and intake manifold pressure) are considered, and the respective acquired data are used to train and test four ANN modules correlating the different quantities. An FDI scheme is presented which generates fault codes sequences by suitably treating the primary residuals, obtained by comparing experimental data with the calculated ones by the ANN modules. The robust fault isolation capabilities of the proposed FDI system are presented and discussed. The proposed model architecture appears as suitable to solve either OBD problems or quality controls at factory engine production lines. INTRODUCTION The aim of the present work is the design and the performance test of a Fault Diagnosis and Identification system (FDI) based on software redundancy modules set up using Artificial Neural Networks (ANNs) models [1, 2, 3]. Possible applications range from On Bord Diagnosis (OBD-II, E-OBD) to quality control systems at engines production lines. This study is a further step of a research line developed by the same authors in last years [4, 5, 6] in which ANNs showed a good behavior in modeling automotive engines, due to their efficiency in non-linear problem
applications, very short run time, limited amount of onboard data. After a first encouraging application limited to one only ANN module [4], in [5], a wide analysis was presented of the capability of ANNs to predict torque (T), throttle valve position (α), rotational speed (N) and intake manifold pressure (p) of a SI, 2000 cc, 5 cylinder engine. In [6] the ANNs performance was enhanced in terms of response to fast transients, while different parameter estimation modules were implemented in an on-line system connected to the engine, mounted on a test bench. Different schemes have been proposed for FDI purposes, by recurring to linear or nonlinear residual generation schemes as Observer Based Residual Generation (OBRG), Parity Equation Residual Generation (PERG), Nonlinear Parity Equation Residual Generation (NPERG), depending on the characteristics of the system to be identified. In particular automotive engines fault diagnosis was deeply analysed by Gertler et.al [7]. Krishnaswami et.al [8] presented an automotive engine application based on the use of the Nonlinear AutoRegressive Moving Average modeling with eXogenous inputs (NARMAX) system identification technique to implement a NPERG FDI scheme. In this paper a FDI strategy is presented for the isolation of faults on four different sensors/actuators, based on ANNs models, and the results in terms of residuals sensitivity to gauges signal perturbations of different strength are discussed. EXPERIMENTAL SET-UP AND DATA ACQUISITION For the training and the test of the ANN modules used in the FDI system proposed in this paper, they were utilised the same experimental data collected for the set-up of the Nets presented and discussed in [6]. Experimental data acquisitions were carried out on a FIAT SI engine, model M648A, 1998 cm3, electronic injection, five cylinders, 20 valves (maximum power: 114 kW at 6200 rpm; maximum torque: 186 Nm at 4000 rpm).
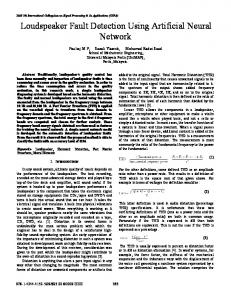
The engine was connected to a low inertia eddy current brake; the signals supplied by the throttle valve position, rotational speed, torque and intake manifold pressure gauges were acquired by a National Instruments™ board and recorded on a PC by using an interface developed in LabVIEW® environment. Experimental acquisitions were performed at 10 Hz sampling rate. For the use in ANNs, the measured quantities were suitably normalised. The size of training and test data sets, reported in Figure 1, was 720 samples each. THE FAULT DETECTION SCHEME FDI methods are based on the generation and analysis of residuals computed by comparing experimental data with the ones calculated by suitable models which constitute the "software redundancy". In an ideal condition, residual zero / one values correspond to no fault / fault conditions respectively. Noise presence and/or models inaccuracies in effective systems can on one side generate false alarms, on the other side lead to miss the detection of faults. In order to point out a sensor / actuator fault, a correspondence between each gauge and a specific fault code sequence has to be univocally determined. In this work, all the four gauges used for the experimental data acquisitions are taken into account: the respective fault code sequences, obtained under the assumption of a single gauge fault at any one time, are reported in Table 1. Table 1. FDI fault codes Fault codes G a u g e s
α
1
1
0
0
T
1
0
1
1
P
0
1
1
0
N
1
1
1
1
3. Tp_N
4. T_N
1. ANdN _T 2. ANdN _p
ANN modules The generation of the fault codes from primary residuals ri’, defined as the difference between the values calculated by each ANN module and the gauge output
ri' (t j ) = Vcalc (t j ) − V gauge (t j )
(1)
will be later explained in detail. The index i is referred to the different modules which generate the respective primary residuals. The minimum number of residuals needed for the fault detection of four gauges is three; however, in order to achieve a careful design in terms of FDI system robustness [7], an higher number is suitable. According
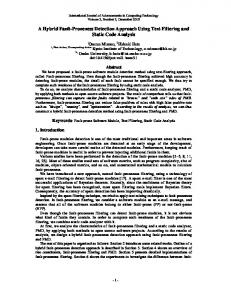
to the aim of this work, i.e. a first check of an ANN based architecture for engines fault diagnosis, four residuals were considered. As far as the selection of the suitable ANN modules for the Vcalc computation is concerned, the choice was based on the results of the exhaustive analysis, carried out in [5], of all the possible Net architectures that can correlate the four considered quantities. Among the 18 modules showing an RMStest below 0.045, the following were selected: ANdN_T, ANdN_p, Tp_N and T_N, which generate the primary residuals ri (i=1,…,4). The acronym meaning is: the ANdN_T module, as an example, outputs T as a function of α, N and dN; the dN neuron (the rotational speed differential dN=N(t)-N(t-dt), being dt the sampling time interval) was introduced in [6] in order to enhance the ANNs response in fast engine transients, accounting for inertial phaenomena. The good performance of the four ANN modules can be evaluated by examining the results of the tests shown in Figure 2. The global FDI scheme is reported in Figure 3. The generation of the fault codes from the primary residuals is performed, for each module, by considering a time window and comparing each element of the ri’(tj) sequence with a threshold Rthr,i: if the amount of elements exceeding the threshold (expressed as a percentage of the window size) is higher than a “suitable” value (the “time threshold” Tthr,i), the fault code is set to 1. The Rthr,i and the Tthr,i suitable values have to be determined through an optimization process, in order to achieve a good FDI system performance. The reasons that lead to this procedure appear evident looking at the plots of the primary residuals, shown in Figure 4, obtained by: •
presenting to the ANN modules perturbed test data at input nodes and by comparing the output with gauge (e.g., in the ANdN_T module, by multiplying the α experimental values by 1.1 and comparing the resulting output T values with the experimental ones, likewise for N);
•
comparing the ANN results from unperturbed input data with the perturbed signal from output quantity gauge (e.g., in the ANdN_T module, by comparing the ANN output T values with the T experimental values multiplied by 1.1).
In Figure 4 the trends are presented of the residuals of the TP_N module either unperturbed or obtained, in one time window, by perturbing the data by 10%, 15% and 20%: as it can be noted, the uneven time history hinders the simple application of a unique threshold, since a low value could generate false alarms even in normal conditions, while a high value could lead to fault detection failures. Consequently, it is necessary to add to the threshold check a statistical criterion by observing the residual during a suitable time period [8]. For the TP_N module Figure 5 shows an example for the computational process of the fault code from a residual threshold value (Rthr = 0.0269) applied to a perturbation level of 15% on the experimental data of T.
throttle-valve position,α, non-dimensional
1,0
experimental data for test
0,8
0,8
0,6
0,6
0,4
0,4
0,2
0,2
0,0 0,0
rotational speed, N, non-dimensional
1,0
experimental data for training
0,2
0,4
0,6
0,8
1,0
0,0 0,0
1,0
1,0
0,8
0,8
0,6
0,6
0,4
0,4
0,2
0,2
0,2
0,2
0,4
0,6
0,8
1,0
0,0 0,0
0,6
0,8
1,0
experimental data for test
experimental data for training 0,0 0,0
0,4
0,2
0,4
0,6
0,8
1,0
0,8
1,0
0,8
1,0
1,0
1,0
torque, T, non-dimensional
experimental data for training 0,8
0,8
0,6
0,6
0,4
0,4
0,2
0,2
intake manifold pressure, p, non-dimensional
0,0 0,0
0,2
0,4
0,6
0,8
1,0
1,0
0,0 0,0
experimental data for test
0,2
0,4
0,6
1,0
experimental data for training
experimental data for test
0,8
0,8
0,6
0,6
0,4
0,4
0,2
0,2
0,0 0,0
0,2
0,4
0,6
0,8
1,0
0,0 0,0
0,2
0,4
0,6
Figure 1. Experimental non-dimensional values of α, N, T, and p versus non-dimensional time
intake manifold pressure, p, non-dimensional
1,0
1,0
exp. calc.
torque, T, non-dimensional
ANdN_T test 0,8
exp. calc
ANdN_P test
0,8
0,6
0,6
0,4
0,4
0,2
0,2
residuals
residuals
0,0
0,0 0,0
0,2
0,4
0,6
0,8
0,0
1,0
rotational speed, N, non-dimensional
rotational speed, N, non-dimensional
TP_N test
0,8
0,6
0,4
exp. calc. residuals
0,0 0,0
0,4
0,6
0,8
1,0
1,0
1,0
0,2
0,2
0,2
0,4
0,6
0,8
1,0
T_N test 0,8
0,6
0,4
0,2
exp. calc. residuals
0,0
-0,2 0,0
0,2
0,4
Figure 2. Test of AndN_t, Andn_p, TP_N and T_N modules versus non-dimensional time
0,6
0,8
1,0
Figure 3. Global FDI scheme
RESULTS AND COMMENTS In Table 2 the results are reported of the analysis carried out in order to optimize the Rthr,i and the Tthr,i values, for the achievement the best FDI system performance, i.e. the presence of zero false alarms and zero fault detection failures. Results shown in Table 2 were obtained by considering three consecutive time windows, each long 240 samples. For each ANN module were determined, either in unperturbed or in different perturbed conditions for each ANN node, the following quantities: - the amount of points in which the primary residual output exceeds Rthr,i (see Figure 5); PET is the percentage value to the time window size; - the maximum of the three values (one per window) in unperturbed condition, PET unp (e.g. for ANdN_T module, i=1: PET unp = 15.83%); - the minimum of the three values (one per window) for each perturbed condition PET, pert (e.g. for i=1: PET, A15% = 23.75%, PET, N15% = 92.92%, PET, T15% = 75.00%,); - the differences between each PET, pert value and the PET unp one, ∆PET,pert; (e.g. for i=1: ∆PET, A15% = 7.92%, ∆PET, N15% = 77.08%, ∆PET, T15% = 59.17%,); - the minimum value between the ∆PET,pert values, ∆PET,min (e.g. for i=1: ∆PET, min=∆PET, A15% = 7.92%);
- the time threshold value Tthr,i , pertaining to the determined ∆PET,min (e.g. for i=1: Tthr,1 =(15.83+23.75)/2= 19.79%). The data reported in Table 2 are the optimum values for each perturbation level, resulting by searching the maximum ∆PET,min value, as a function of Rthr,i. The ∆PET,min value is very important, since offers an evaluation of the capability of the FDI scheme to suitably separate the “faults region” from the “no fault” one. In other words, the higher will be the ∆PET,min value, the higher will be the system efficiency and robustness. When the maximum ∆PET,min value for each condition is determined, Tthr,i value is set to the mean value among the PET, pert value (pertaining to the ∆PET,min node) and PET unp. Only if ∆PET,min values higher than zero are found, a proper corresponding Tthr,i value can be defined, which ideally ensures the absence of wrong operation in terms either of false alarms in normal state, or of detection failures in faulty conditions. By examining the results in Table 2, it can be evidenced the FDI performance. It can be noted that a very neat separation can still be found at low perturbation levels (say, 15%), even though also 10% perturbations are ideally still failure free (a ∆PET, min= 2.92% value was found). The last column of the same table represents the suitable values to be used for a robust FDI system operation obtained considering the 15% value as minimum detectable perturbation level.
rotational speed residuals (calc. - exp.)
0,12
TP_N module 0,08
0,04
0,00
unperturbed pert. 10% pert. 15% pert. 20%
-0,04
-0,08 0
40
80
120
160
200
240
first time window samples Figure 4. Residuals of TP_N module generated by three different perturbation levels on T
1
rotational speed residuals
0,20
0,15
TP_N residuals with 15% perturbation on T
fault code
0,10
0,05
0
0,00
Rthr threshold
-0,05 0
240
480
720
samples Figure 5. Fault code [0,1] generation from the residuals of the TP_N module generated with a perturbation level of 15 % on T.
Table 2. Results of the analysis to optimize the Rthr,i and the Tthr,i values for the four ANN modules
Rthr,i=0.0286
1° time window samples PET
2° time window samples PET
3° time window Samples PET
∆PET,
∆PET,min
Tthr,i
7.92
19.79
∆PET,min
Tthr,i
20.00
59.58
∆PET,min
Tthr,i
8.75
26.04
∆PET,min
Tthr,i
20.83
50.41
pert
Unperturbed A pert. 15% N pert. 15% AndN_T T pert. 15% (i=1) A pert. 20% N pert. 20% T pert. 20% Rthr,i=0.0080
37 79 223 205 96 218 215
15.42 32.92 92.92 85.42 40.00 90.83 89.58
1° time window samples PET
38 57 233 180 76 240 191
15.83 23.75 97..08 75.00 31.67 100.00 79.58
2° time window samples PET
37 73 239 225 91 239 230
15.42 30.42 99.58 93.75 37.92 99.58 95.83
Max = 15.83 Min = 23.75 Min = 92.92 Min = 75.00 Min = 31.67 Min = 90.83 Min = 79.58
3° time window samples PET
7.92 77.08 59.17 15.84 75.00 63.75 ∆PET, pert
Unperturbed A pert. 15% AndN_p N pert. 15% p pert. 15% (i=2) A pert. 20% N pert. 20% p pert. 20% Rthr,i=0.0269
58 177 167 240 200 172 240
24.17 73.75 69.58 100.00 83.33 71.67 100.00
1° time window samples PET
119 215 180 240 228 186 240
49.58 89.58 75.00 100.00 95.00 77.50 100.00
2° time window samples PET
91 210 167 240 229 178 240
37.92 Max = 49.58 87.50 Min = 73.75 69.58 Min = 69.58 100.00 Min = 100.00 95.42 Min =83.33 74.17 Min =71.67 100.00 Min =100.00
3° time window samples PET
24.17 20.00 50.42 33.75 22.09 50.42 ∆PET, pert
Tp_N (i=3)
Unperturbed T pert. 15% p pert. 15% N pert. 15% T pert. 20% p pert. 20% N pert. 20% Rthr,i=0.0260
51 168 79 231 191 96 234
21.25 70.00 32.92 96.25 79.58 40.00 97.50
1° time window samples PET
52 170 92 240 173 114 240
21.67 70.83 38.33 100.00 72.08 47.50 100..00
2° time window samples PET
44 162 78 240 202 73 240
18.33 67.50 32.50 100.00 84.17 30.42 100.00
Max = 21.67 Min = 67.50 Min = 32.50 Min = 96.25 Min =72.08 Min =30.42 Min =97.50
3° time window samples PET
45.83 10.83 74.58 50.41 8.75 75.83 ∆PET, pert
T_N (i=4)
Unperturbed T pert. 15% N pert. 15% T pert. 20% N pert. 20%
96 146 231 186 235
40.00 60.83 96.25 77.50 97.92
89 147 240 176 240
37.08 61.25 100.00 73.33 100.00
88 174 240 212 240
36.67 72.5 100.00 88.33 100.00
Max = 40.00 Min = 60.83 Min = 96.25 Min = 73.33 Min =97.92
20.83 56.25 33.33 57.92
CONCLUSION AND FUTURE WORK A system based on Artificial Neural Networks models for automotive engines Fault Diagnosis and Isolation purposes was set-up and analysed. Four sensors/actuators (throttle valve, rotational speed, torque and intake manifold pressure) were considered, and the respective acquired data were used to train and test four ANN modules correlating the different quantities. An FDI scheme was presented which generates fault codes sequences by suitably treating the primary residuals, obtained by comparing experimental data with the calculated ones by the ANN modules.
The robust fault isolation capabilities of the presented FDI system were demonstrated and discussed: it was found that an efficient behavior should be guaranteed until gauge signals perturbation levels as low as 15%. Future work will further verify the effective robustness of FDI system by implementing it on-line for prolonged test runs. The present research line will be also extended by enhancing system robustness by adding modules to the scheme and by considering further engine sensors and actuators.
ACKNOWLEDGMENTS
6. Grimaldi, C. N., Mariani, F. “On Line Working Neural Estimator of SI Engines Operational Parameters” , SAE-No. 2000-01-1247, Detroit, Michigan, USA, 6-9 March, 2000. 7. Gertler, J., J., Costin, M., Fang, X., W., Hira, R., Kowalczuk, Z., Luo, Q., “Model-Based On-Board Fault Detection and Diagnosis for Automotive Engines”, Control Engineering Pratice, Vol. 1, N° 1, pp. 3-17, 1993. 8. Krishnaswami, V., Luh, G., C., and Rizzoni, G., “Nonlinear Parity Equation Based Residual Generation for Diagnosis of Automotive Engine Faults”, Control Engineering Pratice, Vol. 3, N° 10, pp. 1385-1392, 1995.
The authors thank the FIAT AUTO for having kindly supplied the engine used for experimental runs, in particular Mr. Giardina, Mr. Ugaglia and Mr. Dalla Pria. CONTACT Carlo N. GRIMALDI: E-mail:
[email protected] Phone: +39 075 585 3735 Francesco MARIANI: E-mail:
[email protected] Phone: +39 075 585 3732 Fax: +39 075 585 3736 REFERENCES 1. Dayhoff, Y., "Neural Network Architectures", Van Nastrand Reinhold, New York, 1990. 2. Nguyen, D., and Widrow, B., "Improving the Learning speed of 2-Layer Neural Networks by Choosing Initial Values of the Adaptive Weights", International Joint Conference of Neural Networks, vol. 3, pp. 21-26, 1990. 3. Rumelhart, D., E., and McClelland, J. L., "Parallel Distributed Processing", Vols. 1 & 2. Cambridge, Mass.: MIT Press, 1986. 4. Grimaldi, C. N., Mariani, F., "On Board Diagnosis of Internal Combustion Engines: a New Model Definition and Experimental Validation", SAE-No. 970211, Detroit, 1997. SAE 1997 Transactions: Journal of Commercial Vehicles, Section 2, pp. 21-29. 5. Grimaldi, C. N., Mariani, F., "Prediction of Engine Operational Parameters for On Board Diagnostics Using Free Model Technology ", SAE-No. 1999-01-1224, Detroit, Michigan, USA, March 1-4, 1999.
DEFINITIONS, ACRONYMS, ABBREVIATIONS α or A N p PET Rthr,i T t Tthr,i V
throttle valve position rotational speed intake manifold volume pressure percentage of points exceeding threshold residual threshold for the module i torque non-dimensional time time threshold for the module i experimental and calculated generic value
SUBSCRIPTS calc exp i j thr unp
calculated value experimental value module index sample index threshold level unperturbed condition