Dr. Ch.Sai Babu, EEE, Professor in JNTU University, Kakinada,. Andhra Pradesh. J. Surya Kumari, EEE, Assistant professor in R.G.M College of. Engineering ...
ISSN: 2278 – 7798 International Journal of Science, Engineering and Technology Research (IJSETR) Volume 2, Issue 10, October 2013
Design and Implementation of different MPPT Algorithms for PV System Ch. Kalpana, Ch. Sai Babu, J. Surya Kumari Abstract— Solar photovoltaic (PV) systems are used to utilize energy of sun in power generation during recent years. PV systems require maximum power point tracking (MPPT) techniques to maximize available energy due to the nonlinear PV characteristics. The most commonly used MPPT techniques are perturb and observe (P&O) techniques. P&O techniques are classified as Conventional P&O with fixed perturb, modified P&O with fixed perturb, Conventional P&O with adaptive perturb and modified P&O with adaptive perturb. The difference between conventional and modified techniques is in conventional methods either voltage or current is used as perturb signal, duty cycle is used in latter case. P&O with fixed perturb either conventional or modified suffers from disadvantages such as oscillations around maximum power point (MPP), tracking versus oscillations tradeoff problem and predefined constants [1]-[3] because of using fixed perturb value. To overcome these problems adaptive tracking techniques are used. Adaptive technique varies perturb value automatically according to the system changes. In this paper Conventional P&O with adaptive perturb and modified P&O with adaptive perturb are presented. These techniques are treated as extensions of P&O technique with fixed perturb values. These techniques perform adaptive tracking without having oscillations around the MPP and also do not use predefined constants. These techniques also track MPP for rapid changing weather conditions which is not achieved by P&O technique. Matlab/simulation results show that both techniques gives improved performance in transient state, steady state and modified adaptive P&O gives better efficiency compared with adaptive P&O. Index Terms—Adaptive Perturb and Observe (AP&O), Matlab/simulink Environment, Maximum Power Point Tracking (MPPT), Modified Adaptive Perturb and Observe (MAP&O), Perturb and Observe (P&O), Photovoltaic (PV) system.
I. INTRODUCTION The global demand for electrical energy has increased continuously over the last few decades. In today’s world energy and environment have become serious concerns. Hence alternative sources of energy became more important. Among all renewable energy sources PV sources will have biggest contribution to electric power generation in coming years because installation capacity of PV sources is increasing year by year. In 2009 , 7.4GW of new PV capacity was added worldwide and new PV installations grew by a massive 130% to reach 17.5GW in 2010.Installations could
see double digit growth in 2011 to reach 20.5GW making a total capacity of 58GW by the end of the year. IMS research predicts that installation of 35GW will come up by 2014. Photovoltaics (PV) is a method of generating electrical power by converting solar irradiation into direct current electricity using semiconductors which exhibit Photovoltaic effect. Photovoltaic effect is the creation of voltage or current in a material upon exposure to light. Photovoltaic power generation employs solar panels composed of a number of solar cells made up of photovoltaic material. Photovoltaic materials include mono crystalline silicon, polycrystalline silicon, amorphous silicon. When power required is more than delivered by a single cell, cells are electrically connected to form PV modules. Again PV modules are grouped to form PV array for high power applications. The photovoltaic systems have applications in stand-alone configurations and grid connected configurations. Stand-alone applications include water pumping, domestic and street lighting, electric vehicles, military and space applications whereas grid connected configurations include hybrid systems and power plants etc. Because of advances in technology and increasing manufacture scale the cost of PV has decreased steadily since the first solar cells are manufactured. But there are two major problems with PV generation systems. One is the low conversion efficiency of solar energy into electrical power and the other is the non linear characteristics of PV array which makes the electrical power generated vary with temperature and solar irradiation [2], [3]. In general there is only one point on P-V and V-I curve called the maximum power point. At this point only PV system operates with maximum efficiency and produces maximum output power. But this maximum power point is not known hence calculation models or search algorithms known as maximum power point tracking techniques are used to find the maximum power point. A common MPPT Technique is well known as power feedback method which measures the power of PV array and uses it as feedback variable. Based on power feedback there are three important tracking techniques used in PV systems. They are the Perturbation and Observation (P&O), the hill climbing method, the incremental conductance method. In both P & O and Incremental conductance methods the voltage at maximum power point ( ) is continuously tracked till it satisfies the equation
Ch. Kalpana, EEE, pursuing M.Tech from JNTU University, Kakinada, Andhra Pradesh Dr. Ch.Sai Babu, EEE, Professor in JNTU University, Kakinada, Andhra Pradesh J. Surya Kumari, EEE, Assistant professor in R.G.M College of Engineering and Technology, Nandyal, Andhra Pradesh
where P represents
PV array output power and V is voltage. But in hill climbing method is tracked by making where D is duty cycle. Among all MPPT methods P&O techniques are widely 1926
All Rights Reserved © 2012 IJSETR
ISSN: 2278 – 7798 International Journal of Science, Engineering and Technology Research (IJSETR) Volume 2, Issue 10, October 2013 used because of simplicity and good performance. But P&O techniques suffer with speed versus oscillations trade off problem because of using fixed perturb value. Hence for improved performance adaptive P&O and modified adaptive P&O are used. These techniques are simulated under varying weather conditions. This paper is organized into sections. Following the introduction in section Ι, main block diagram of PV system is illustrated in section II. Working of PV cell and Mathematical modeling of PV cell are given in section III and ΙV. The proposed Adaptive P&O and Modified Adaptive P&O Techniques are discussed in section V. Finally simulation results and conclusions are made in sections VΙ and VIΙ respectively.
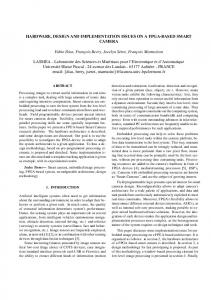
Fig2.Stucture of a PV cell The electric field within PV cell is developed by sandwiching two separate semi conductors. The p and n types of semi conductors correspond to positive and negative because of holes or electrons. Even though both materials are electrically neutral, n type silicon has excess electrons and p type has excess holes. Sandwiching these together create a p-n junction at their interface and creates electric field required [5].
II. BLOCK DIAGRAM OF PV SYSTEM The Fig. 1 shows PV system block diagram with MPPT Technique. It consists of PV array, Boost converter, MPPT block, and finally load. Combination of Series and parallel solar cells constitute PV array. Series connection of solar cells boost up the array voltage and parallel connection increases the current. In order to change the input resistance of the panel to match the load resistance (by varying the duty cycle), a DC to DC converter is required [4]. Boost converter is used to obtain more practical uses from solar panel. The input of boost converter is connected to PV array and output is connected to load. MPPT block receives and signals from PV array. The output of MPPT block is series of pulses. These pulses are given to boost converter. Converter works based on these pulses to make the PV system operate at Maximum power point (MPP).
IV. MODELING OF PV CELL The PV cell model is represented by equivalent electrical circuit shown in Fig. 3. The model contains a current source , diode, series resistance Rs, shunt resistance and load. The current source produces which depends on radiation. The output current is the difference between photo current and diode current .
Fig3.PV cell model The equations of PV module are as follows: Current output of PV module is Fig1. Block diagram
III. WORKING OF PV CELL PV cell converts sunlight into electricity by using photovoltaic effect. Sunlight is composed of particles of solar energy known as photons. Photons contain different amounts of energy corresponding to different wavelengths of solar spectrum. When photons strike a PV cell they may be reflected or absorbed or they may pass right through. But only the absorbed photons generate electricity. Then the energy of photon is transferred to an electron in an atom of the cell which is a semi conductor. With this energy the electron is able to escape from its normal position to become part of the current in an electrical circuit. A built in electrical field provide the voltage needed to drive the current through the external load. The structure of PV cell is shown in Fig. 2
Output voltage of PV cell is
The PV cell output voltage is a function of the photocurrent that mainly determined by load current depending on the solar irradiation level during the operation [5]. Module photo current:
Module reverse saturation current: 1927
All Rights Reserved © 2013 IJSETR
ISSN: 2278 – 7798 International Journal of Science, Engineering and Technology Research (IJSETR) Volume 2, Issue 10, October 2013 load operating point coincides with this point maximum power is delivered by PV array. Module saturation current: V. BOOST CONVERTER
Where : Light generated current in a PV cell : PV cell Saturation current in (A) : Output current of PV cell in (A) : Output voltage of PV cell in (V) : Number of cells connected in series : Number of cells connected in parallel A : Ideality factor =1.6 K : Boltzmann constant = 1.3805e-23Nm/K T : Cell operating temperature in Kelvin : Reference temperature in kelvin q : Electron charge=1.6e-19 coulombs : Temperature coefficient : Short circuit current in (A) : Reverse saturation current in (A) : Band gap energy for silicon = 1.1 eV : Series resistance of PV cell in (Ω) : Shunt resistance of PV cell in (Ω) λ : PV cell illumination (MW/m2)= 1000 MW/m2 B : Ideality factor =1.6 k and t should have same temperature unit either in Kelvin or Celsius and ideality factor A is used to make the I-V characteristics to fit the curve actual characteristics [6], [7]. Full array voltage is calculated by multiplying the voltage of PV cell with number of cells connected in series. Similarly array current is obtained by dividing cell current with number of cells connected in parallel. This is valid only for certain operating temperature of cell T and solar irradiation. Change of temperature and irradiation changes voltage and current outputs of PV array. Figures shows P-V and V-I characteristics of PV array for different temperature and solar irradiance conditions.
Fig4. Maximum Power Point (Vmp, Imp) Characteristic V-I curve of a practical PV device with three remarkable points shown in figure. These are short circuit (0, ), MPP (Vmp, Imp) and open circuit (Voc, 0). V-I curves has only one maximum power point (Vmp, Imp). If
Boost converter is also called as step up converter. It converts low input voltage to high output voltage. It functions like a reversed buck converter [8]. Boost converter circuit consists of inductor, diode, switch and capacitor. By making on and off of switch periodically the boost converter works. When the switch is on the inductor stores the energy and when switch is off the sum of inductor energy and supply appears at output. The average output voltage is determined by the below equation. =
Fig5. Boost Topology Boost converter boost the voltage to maintain the maximum output voltage constant irrespective of weather conditions. The boost converter is shown in figure5.
VI. MPPT TECHNIQUES The efficiency of solar cell is very low. In order to increase the efficiency methods should be undertaken to match source and load properly. One such method is the MPPT. MPPT technique used to obtain the maximum possible power from a varying source. In PV systems V-I characteristics is non linear, thereby making it difficult to be used to power a certain load. This is done by utilizing boost converter whose duty cycle is varied by using MPPT algorithm. A. Conventional P&O with fixed Perturb This method is most common and simple. In this method very less number of sensors are used. The operating voltage is sampled and the P&O algorithm changes the operating voltage towards the maximum power point by periodically increasing or decreasing the PV array voltage. This is done by comparing power quantities between the present and past instants. If the power in the present instant is increased than the past value, the perturbation is continued in the same direction in the next perturbation cycle, otherwise the perturbation direction is reversed. This way, the operating point of the system gradually moves towards the MPP. This algorithm is not suitable when the variation in the solar irradiation is high. The voltage never actually reaches an exact value but perturbs around the maximum power at MPP. The block diagram of P&O method is illustrated in Fig. 6. 1928
All Rights Reserved © 2012 IJSETR
ISSN: 2278 – 7798 International Journal of Science, Engineering and Technology Research (IJSETR) Volume 2, Issue 10, October 2013 quickly reach the MPP, and as the MPP is approached, the perturb value needs to be decreased to avoid large oscillations around this maximum output power operating point.
Fig6. Block diagram of P&O MPPT The flow chart of P&O method is shown below. Fig8.Block diagram of Adaptive P&O Technique The proposed adaptive technique utilizes the error between two successive array power signals calculated from the measured array voltage and current signals to create an adaptive perturb. Basically, at the start of the hill climbing process, this error is large and decreases as the maximum power operating point is approached at steady state. Therefore, this error can be treated like an error signal in a closed-loop system that needs to be minimized at steady state. The simplest clue to achieve all these targets is to treat this error signal using a conventional PI controller, which is the main core of the proposed technique. This PI controller is utilized as the adaptive perturb value generator for the reference array voltage.
Fig7.Flow chart diagram of P&O MPPT method P&O with fixed perturb value suffers with demerits. For fixed perturb values the oscillations in steady state are proportional to perturb value. If perturb value is high oscillations are high, if perturb value is low the output response is very slow. Hence with fixed perturb value tradeoff problem exists between faster response and steady state oscillations. Hence to increase performance a variable perturb is used. B. Conventional P&O with Adaptive Perturb The conventional P&O involves perturbation in the array operating voltage or current [9]. Perturbing means either incrementing or decrementing PV array voltage. If PV array voltage is increased, power of PV array increases. Hence in the next perturbation also voltage is increased. This process is continued till power reaches Maximum Point. At maximum point if voltage is increased further PV array power decreases. Hence perturbation is made negative at this point that means voltage is decreased. The system oscillates at this maximum point. To reduce these oscillations the perturbation size is decreased but this smaller perturbation size slows down the system. Hence speed versus oscillations problem exists with conventional P&O method with fixed Perturb value. To avoid this problem adaptive perturb method is used. The block diagram of Proposed Technique is shown in Fig. 8. The main idea behind the proposed technique is that at the start of any P&O technique, large perturb steps are needed to
C. Modified Adaptive P&O MPPT Technique In this method instead of using array voltage or current as the perturbed signal converter duty ratio is used. The block diagram and flow chart of MAP&O are shown in Fig. 9 and Fig.10 respectively. These method uses automatic parameters tuning to decide perturb value.
Fig9.Block diagram of Modified Adaptive P&O Technique In modified P&O with fixed perturb Technique tradeoff problem exists between dynamic response and steady state performance because of fixed value of incremental step of duty cycle. Duty cycle incremental size should be large during transient stage and small in steady state. This is achieved by automatic tuning of incremental step of duty cycle in MAP&O. The automatic tuning of duty cycle perturb value is decided 1929
All Rights Reserved © 2013 IJSETR
ISSN: 2278 – 7798 International Journal of Science, Engineering and Technology Research (IJSETR) Volume 2, Issue 10, October 2013 large step of “a" only. During this period, the ordinary P&O method is adopted. In this technique directly duty cycle is used as perturb value hence there is no need of using PI controller. The output of MPPT is given to boost converter.
by following equation
Where a (k) = perturb value of duty cycle a (k-1) = historic value of a(k) Δp = p(k) – p(k-1) At the start of hill climbing process power change is high so the tuner will give large value of ‘a’ from the above equation. This large value of ‘a’ satisfies the fast response requirement. At steady state power change is small so the tuner will make the controller to give small value of ‘a’ which reduces steady state oscillations and dynamic response requirements are satisfied [10]. In this way adaptive value of duty cycle is generated which satisfies both fast response and low oscillation requirements.
VII. SIMULATION RESULTS The PV array is simulated by using matlab/simulink environment. The P-V and V-I curves of PV array at different temperatures and different irradiances are shown in figures. The curves depicts that as the irradiance is increased by making temperature constant the output power of PV array is increased. P-V curves also depicts that if temperature is increased the output power decreases.
Fig11.P-V Curve of solar array for constant temperature of 25°C
different irradiations and
Fig12.V-I Curve of solar array for different irradiations and constant temperature of 2
Fig10.Flowchart of Modified Adaptive P&O Technique In some specific cases, the traditional P&O method make the operating point to deviate from the optimal point when insolation changes rapidly. This problem also avoided by switching the control mode. The control algorithm is demonstrated in flow chart format shown in Fig.10, where "P" and "D" represent the PV power level and the duty cycle value respectively. is called switching criterion. If the value of
is greater than the threshold "e", the controller
understands that the power variation was mainly caused by the solar insolation, so the increment of duty cycle is continued in the same direction as , the change of power condition. The perturbation direction is represented by "Slope" in the flow chart (Fig. 10). If the value of is
Fig 13. P-V Curve of solar array for different temperatures Constant irradiance of 1000W/m2.
small, the controller assumes that the system control is within the stead state, or the large change on power is caused by the 1930 All Rights Reserved © 2012 IJSETR
ISSN: 2278 – 7798 International Journal of Science, Engineering and Technology Research (IJSETR) Volume 2, Issue 10, October 2013
Fig14. V-I Curve of solar array for different temperatures Constant irradiance of 1000W/m2.
Fig16(a). PV array output power for Adaptive P&O MPPT technique
Fig15(a). PV array output power for P&O MPPT technique Fig16(b). PV array output voltage for Adaptive P&O MPPT technique
Fig15(b). PV array output voltage for P&O MPPT technique
Fig16(c). PV array output current for Adaptive P&O MPPT technique The output power, voltage and current with adaptive perturb and observe technique are shown by Fig.16(a),16(b),16(c) respectively. By using this technique power tracking is improved from 88.86% to 95.71%.
Fig15(c). PV array output current for P&O MPPT technique The output power, voltage and current with perturb and observe technique are shown by Fig. 15(a),15(b),15(c) respectively. P&O technique tracks 1038W from available PV array power of 1162W which is 88.86%.
Fig17(a). PV array output power for Modified Adaptive P&O MPPT technique 1931
All Rights Reserved © 2013 IJSETR
ISSN: 2278 – 7798 International Journal of Science, Engineering and Technology Research (IJSETR) Volume 2, Issue 10, October 2013
Fig17(b). PV array output voltage for modified Adaptive P&O MPPT technique
Fig18(b) Fig18. Simulation results of sudden insolation change from 1000 to 900 for Adaptive tracking
Fig17(c). PV array output current for modified Adaptive P&O MPPT technique Fig19(a) The output power, voltage and current with modified adaptive perturb and observe technique are shown by Fig17(a),17(b),17(c) respectively. This technique improves power tracking from 95.71% to 97%. Solar irradiation is changed randomly and rapidly to evaluate the performance of adaptive MPPT techniques. Simulated results for changing irradiance conditions are shown in Fig. 18 and Fig. 19. The results depict that adaptive algorithms track new values of power whenever irradiation changes. In each technique power extracted from PV is well controlled. Fig 19(b) Fig19. Simulation results of sudden insolation change from 1000 to 900 for Modified Adaptive tracking Table1: comparison of MPPT methods
Fig18(a)
With and without MPPT technique
Voltage (V)
PV array P&O Adaptive P&O
149.3 138.1 133.9
Modified Adaptive P&O
136.2
Current (A)
Power (W)
Efficiency (%)
2.665 7.515 8.354
397.8 1038 1118
37.91 88.86 95.71
8.317
1134
97
1932 All Rights Reserved © 2012 IJSETR
ISSN: 2278 – 7798 International Journal of Science, Engineering and Technology Research (IJSETR) Volume 2, Issue 10, October 2013 VIII. CONCLUSION The maximum power point tracking techniques are used to deliver maximum possible power from the solar array. P&O with fixed perturb value is having tracking versus oscillations tradeoff problem and it cannot track for rapid change in weather conditions. Hence for improved performance adaptive techniques are used. This paper presents PV array simulation and comparison of P&O, Adaptive P&O and Modified Adaptive P&O Techniques. The results of all techniques are shown in table1. The results depict that adaptive techniques are more efficient compared to fixed perturb techniques. The Fig. 18 and Fig. 19 prove that both adaptive techniques track new values of power for irradiance change conditions.
J. Surya kumari was born in Kurnool, India in 1981. She received the B.Tech (Electrical and Electronics Engineering) degree from S.K University, India in 2002 and the M.Tech (High voltage Engineering) from J.N.T University, Kakinada in 2006. In 2005 she joined the Dept. Electrical and Electronics Engineering, R.G.M. College of Engineering and Technology, Nandyal, as a Assistant Professor. She has published several National and International Conferences. Her field of interest includes Power electronics, Photovoltaic system, Power systems and High voltage engineering.
REFERENCES T. Esram and P. L.Chapman, “Comparison of photovoltaic array maximum power point tracking techniques,” IEEE Trans. Energy Conv., vol. 22, no. 2, pp. 439–449, Jun. 2007. [2] M. Liserre, T. Sauter, and J. Y. Hung, “Future energy systems: Integrating renewable energy sources into the smart power grid through industrial electronics,” IEEE Ind. Electron. Mag., vol. 4, no. 1, pp. 18–37, Mar.2010. [3] S. Jain and V. Agarwal, “Comparison of the performance of Maximum Power Point Tracking schemes applied to single-stage grid-connected photovoltaic systems,” IET Electr. Power Appl., vol. 1, no. 5, pp. 753 – 762,Sep. 2007. [4] Ali Chermitti, Omar Boukli-Hacene, Bencherif Mohamed Improvement of the “Perturb and Observe MPPT Algorithm in Photovoltaic System under Rapidly Changing Climatic Conditions” International Journal of Computer Applications (0975 – 8887) Volume 56– No.12, October 2012 [5] J.Surya Kumari, Ch. Sai Babu and J. Yugandhar3 “Design and Investigation of Short Circuit Current” Based Maximum Power Point Tracking for Photovoltaic System”, International Journal of Research and Reviews in Electrical and Computer Engineering (IJRRECE) Vol. 1, No. 2, June2011. [6] I.H. Altas; A.M. Sharaf, “A Photovoltaic Array Simulation Model for Matlab-Simulink GUI Environment”. Proceedings of IEEE, IEEE 2007. [7] G.Raja Sekhar, Ch.Sai Babu, J.Surya Kumari “ Comparison Analysis of P&O and improved P&O MPPT Technique for PV system’ International journal of Engineering and Technology(IJEIT) Volume 1, Issue 5, May 2012. [8] Somali Surawdhaniwar and Mr. Rithes Diwan “ Study of Maximum Power Point Tracking using Perturb and Tracking method” International Journal of Advanced Research in Computer Engineering & Technology(IJARCET)” Volume 1, Issue 5, July 2012. [9] Ahmed K. Abdelsalam, Ahmed M. Massoud , Shehab Ahmed, and Prasad N. Enjeti, “High-Performance Adaptive Perturb and Observe MPPT Technique for Photovoltaic-Based Microgrids” IEEE Transactions on Power Electronics, Vol. 26, No. 4, April 2011. [10] W. Xiao and W. G. Dunford, “A modified adaptive hill climbing MPPTmethod for photovoltaic power systems,” in Proc. IEEE 35th Annu. Power Electron. Spec. Conf., Jun. 20–25, 2004, vol. 3, pp. 1957–1963. [1]
Ch. Kalpana received B.Tech (Electrical and Electronics Engineering) from JNTU University Kakinada in 2010 and pursuing M.Tech (Advanced Power Systems) from JNTUK. Her field of interest includes Power systems, Power Electronics and photovoltaic systems. Ch. Sai Babu received the B.E from Andhra University (Electrical & Electronics Engineering), M.Tech in Electrical Machines and Industrial Drives from REC, Warangal and Ph.D in Reliability Studies of HVDC Converters from JNTU, Hyderabad. Currently he is working as a Professor in Dept. of EEE in JNTU, Kakinada. He has published several National and International Journals and Conferences. His area of interest is Power Electronics and Drives, Power System Reliability, HVDC Converter Reliability, Optimization of Electrical Systems and Real Time Energy Management.
1933 All Rights Reserved © 2013 IJSETR