Biogas can reduce landfill use if produced from waste ...... WWTP by island-operation of the SOFC modules. .... A. Iyengar, D. Keairns, K. Krulla, and D. Newby,.
Proceedings of the ASME 2016 14th International Conference on Fuel Cell Science, Engineering and Technology FUELCELL2016 June 26-30, 2016, Charlotte, North Carolina
FUELCELL2016-59484
DESIGN, ENERGY MODELING AND PERFORMANCE OF AN INTEGRATED INDUSTRIAL SIZE BIOGAS SOFC SYSTEM IN A WASTEWATER TREATMENT PLANT Marta Gandiglio Politecnico di Torino Turin, Italy
Ali Saberi Mehr University of Tabriz, Tabriz, Iran
Andrea Lanzini Politecnico di Torino Turin, Italy
Massimo Santarelli Politecnico di Torino Turin, Italy
ABSTRACT DEMOSOFC [1] is a Fuel Cell & Hydrogen Joint Undertaking (FCH-JU) funded project which foresees the installation of the largest biogas fed Solid Oxide Fuel Cell (SOFC) in Europe. The SOFC will be the sole combined heat & power (CHP) generator within a medium size wastewater treatment plant (WWTP) located in Torino (IT). Three SOFC modules, each rated 58 kWe, will supply around 30% of the internal electrical loads and a variable share of the thermal load depending on the season. The key objective of the project is to demonstrate the industrial readiness of SOFC systems, which are able to guarantee better performance both in terms of electrical efficiency and emission of pollutants with respect to conventional internal combustion engines. SOFC systems have a high potential for integration with local renewable fuels as biogas and/or bio-syngas from waste sources. Looking at the biogas potential in EU, the most common plant size lies in the sub-MW scale. This work aims to describe the DEMOSOFC concept, the approach followed for the design of the integrated system. Energy performance, environmental benefits, underlining advantages and barriers of this integration are presented and discussed.
a series of biological, physical and chemical treatments. Sludge is then conveyed to anaerobic digestion in order to further stabilize it from a biological point of view. The digester effluent is a more stable outlet stream (the digested sludge) which is finally dried and sold for further processes (e.g., the production of compost fertilizer). Anaerobic digestion indeed finds its major applications in the stabilization of concentrated sludges produced from the treatment of municipal and industrial waste water [2]. Biogas production from sludge is indeed a well-known practice which can increase the useful output of a WWTP[3] [4] [5], co-producing heat and electricity which are needed within the plant. Biogas from anaerobic digestion has gathered increased interest in terms of energy exploitation at the industrial level Indeed: Biogas is a renewable source of energy, often produced from substrates which are waste products. Biogas is “carbon neutral” since it is not adding net carbon dioxide emissions to the atmosphere. Biogas can reduce landfill use if produced from waste materials currently disposed of in landfills, dump sites and even farms. Biogas plants are easy to set up and require a reduced capital investment on a small scale basis. Currently, biogas exploitation is achieved by different systems achieving different products, in particular: o Direct combustion systems (boilers, turbines) for producing space heating, water heating, drying, absorption cooling, and steam production [6].
INTRODUCTION WWTPs produce biogas as by-product of their core service toward the municipality that is sanitization of urban and industrial effluents. The reduction of the organic putrescible matter contained in wastewater is often achieved by means of anaerobic digestion. In this treatment process, sludge is collected and separated from water by flocculating the organic content via
1
Copyright © 2016 by ASME
Use in stationary or mobile internal combustion engines (ICE) which may results in shaft horsepower, cogeneration of electricity, and/or vehicular transportation [7] [8] [9]. o Biogas can be concentrated via an upgrading system to a fuel with the same standards as fossil natural gas. The upgraded biogas, called “bio-methane”, can be used then as transportation fuel or injected into local distribution networks. Purified gas must grid standards before injection (in terms of density, Wobbe Index and heating value). Carbon dioxide, water, hydrogen sulphide and particulates must be removed as well down to tolerable limits. Among the cogeneration systems, fuel cells can be an answer to the maximization of the energy revenues. In 2004 Van Herle et al. were already discussing the potential for the integration of sewage biogas with high temperature fuel cells [10] [11]. Over the last years, new research activities aimed to the demonstration of the same concept; in fact, the use of fuel cells in biogas plants can lead to many advantages in terms of environmental and economic aspects [12] [13] [14] [15]. Furthermore, many activities have been also devoted to the analysis of the biogas contaminants like sulfur and siloxanes and on their detrimental effects on the fuel cell [16] [17]. The presented work aims to present a project related to the installation of an SOFC in an industrial environment as the SMAT WWTP, focusing on real problems related to the plant management: fuel clean-up, dealing with biogas supply fluctuations and heat recovery / thermal management of the digester. Results are shown for the energy performance of the integrated biogas SOFC plant based on actual biogas availability and a detailed fuel cell electrochemical model. The SOFC Balance-of-Plant has been also designed and modelled in order to understand the coverage factors of the plant in terms of electrical and thermal loads. Future works will aim to validate results with experimental data from the real system in operation.
(IT)–the WWTP owner –, Convion (FI) – the SOFC system integrator and module supplier –, VTT (FI) – the Finnish research centre – and Imperial College of London for what concerns the business analysis and exploitation plan. The DEMOSOFC installation will include three main sections: The biogas clean-up section is required to remove fuel contaminants – which could be harmful for the SOFC – down to ppb(v) levels. Sulfur, siloxanes and halogenated compounds are detrimental for SOFC operation. The cleanup section will be designed with a lead-and-lag reactors’ configuration which is able to match the advantages of both a parallel and series configuration and have an active safety double-vessel layout. Selective activated carbons for sulfur and siloxanes removal will be used and a continuous online gas analyser will be able to detect the real-time state of the adsorption bed and ensure substitutions only when required. SOFC modules fed with compressed biogas and ambient air will deliver AC power. The high efficiency electrochemical reactions will produce AC electrical power with an efficiency equal or higher than 53%, with a relatively flat efficiency curve from 100 to 50% of the nominal load. The heat recovery section will recover and transfer high temperature heat from the SOFC exhaust to the mesophilic anaerobic digester, where biogas is produced. The digester is not directly heated but thermal power is supplied by heating up the fresh sludge that feeds the reactor. The system will be able to entirely cover summer and shoulder season’s loads, while additional thermal energy will be required during winter. The design of the system has pointed out the need for a detailed and sensitive control of the anaerobic digestion process in order to guarantee that biogas production remain the most possible stable. Biogas fluctuations should be avoided in order to guarantee a stable operating point for the SOFC, avoiding modulations in lower efficiency working points (which are anyway possible in case of shortages) and shut-downs (detrimental for the fuel cell lifetime). Additionally, biogas clean-up is an essential section of the system, both in terms of installation footprint required, economic impact and stringent design specifications. There is not such a commercial solution available on the market that matches the ultra-clean fuel quality requirements of the SOFC without leading to an expensive and complex system layout. Furthermore, SOFC threshold limits for contaminants are in the order of few tens of ppb(v), which result in sophisticated analytical instrumentation able to combine laboratory performance in terms of measurements accuracy with industrial/process performance in terms of installation site and operation reliability. Summarizing, results from the DEMOSOFC system design and future achievements from the industrial operation are intended to accelerate the market introduction of these new clean and efficient technologies, thus realizing their potential in achieving low-carbon energy systems.
o
NOMENCLATURE AC Alternate Current BOD Biological Oxygen Demand CHP Combined Heat and Power COD Chemical Oxygen Demand HP Hypotheses ICE Internal Combustion Engine LHV Lower Heating Value NG Natural Gas PBR Payback Time PID Proportion Integrative Derivative SMAT Società Metropolitana Acque Torino SOFC Solid Oxide Fuel Cell SSV Suspended Solid Volatile (Matter) SST Suspended Solid Total (Matter) WWTP Waste Water Treatment Plant 1. THE DEMOSOFC PROJECT DEMOSOFC [1] involves five different European partners: Politecnico di Torino (IT) – coordinator of the project –, SMAT
2
Copyright © 2016 by ASME
1.1 BIOGAS YEARLY AVAILABITIY IN WWTP A variable biogas supply to the SOFC is expected in the DEMOSOFC installation. The hourly biogas production for 2014 and 2015 (till October) are given in Figure 2 and Figure 3. The main observed features are: a widely fluctuating biogas production throughout the year; a seasonal pattern according to which less biogas is produced in summertime (June to September) due to lower incoming wastewater. The average biogas production has been 63.06 Nm3/hr in 2014, while for 2015 is about 71.58 Nm3/hr. Even if understanding of the digester behaviour and regulation is outside the scope of DEMOSOFC project, fluctuations in biogas production might affect the SOFC operation. For this reason, during the project the main operating parameters of the anaerobic digester have also been analysed in order to better predict the conditions which might lead to biogas shortages.
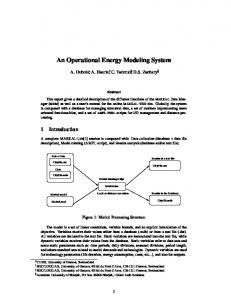
The core part of the installation is a 174 kWe SOFC plant, which consists of three modules (each one rated 58 kWe AC power). The site of the installation is the wastewater treatment plant (WWTP) of Collegno (Torino, IT) managed by project partner SMAT (Figure 1).
DEMOSOFC plant
Figure 1. SMAT Collegno WWTP and DEMOSOFC plant location.
The WWTP currently serves 270’000 equivalent inhabitants – that is only a portion of the overall municipality of Torino – collecting an overall of 59’000 m3 of wastewater on a daily basis that corresponds to ~220 litre/day/capita. Digester gas is available from the anaerobic fermentation of pre-thickened sludge at this facility. The suspended solid volatile (SSV) fraction in the sludge results in 1.34 wt. % leading to a calculated biogas yield of 0.39 Nm3 of biogas per kg of SSV. Table 1. Site specific facts about the SMAT WWTP. Number of equivalent inhabitants served
270’000
Wastewater feed
[m3/day]
59’000
Daily wastewater feed per capita
[l/day/capita]
220
Biogas production rate
Yearly overall [Nm3/y]
706’890
Yearly specific [Nm3/y/capita]
2.62
LHV (average vol. composition 65% CH4 35% CO2)
MJ/kg
20.20
Average SSV (Suspended Solid Volatile) fraction
%
1.34
Average SST (Suspended Solid Total) fraction
%
1.91
Ratio SSV/SST
-
0.70
Sludge feed
Yearly [m3/y]
135’465
Hourly [m3/h]
15.5
Specific [m3/ab]
0.50
SSV feed
kg/year
1’815’231
Specific biogas yield
Nm3 biogas / kg SSV
0.39
Figure 2. Biogas hourly production in 2014.
Figure 3. Biogas hourly production in 2015.
The main variables which affect biogas production rates are the amount of incoming sludge (that is depending on the wastewater intake flow rate) and the digester temperature (that strongly impact on bacterial activity within the anaerobic vessel). The inlet chemical oxygen demand (COD) and biological
Given these site-specific productivity facts, and by taking the biogas-to-electricity efficiency of 53% (LHV basis) for the SOFC generator in nominal operation conditions, the resulting electricity yield is ~1 We/capita. Further details are summarized on Table 1 and are specific data referred to the SMAT Collegno WWTP.
3
Copyright © 2016 by ASME
oxygen demand (BOD) of treated wastewater are also important variables. For instance, the recorded digester mean temperature for 2014 and 2015 is shown in Figure 4. A clear correlation between digester temperature and biogas production has been not established yet since many variables are included.
(FeCl3). Iron chloride is mostly used for phosphorus (P) removal, however sulfur precipitation is also accomplished. Siloxanes originate from silicone based compounds which are more and more often found in consumer products which end up in sewers (e.g., cosmetics, personal care products, adhesives and coatings, sealants, etc.) [21][22]. Siloxanes are indeed the building blocks of silicones. According to literature, the most found compounds in sewage biogas are cyclic volatile polydimethylsiloxanes (D4, D5), with D5 concentration being several times higher than D4. This is trend is fully confirmed in our measurements. Due to their high hydrophobicity and volatility, cyclic volatile methylsiloxanes (cVMS) largely tend to adsorb on activated sludge flocks in aeration tanks within the WWTP [23]. Within the anaerobic digester, where the sludge can reach temperature around and even above 40 °C, siloxanes can significantly volatilize and end up in the biogas. Among the various contaminants, siloxanes are certainly the most detrimental for end-use devices for biogas valorisation into electricity. In the combustion chamber of internal combustion engines, siloxanes are oxidized to silicates (e.g., SiO2) thus increasing maintenance of mechanical parts [24]. Recently it has been shown that siloxanes in digester biogas are highly detrimental also for solid oxide fuel cells, even when present at the ppb(v) levels in the anode feed, causing a rapid and irreversible degradation of the fuel cell performance [25].
Figure 4. Digester mean temperature in 2014 and 2015.
The biogas composition in terms of CH4 and CO2 volumetric fractions is quite stable in the observed period. The average CH4 content is about 64% vol. Having a relatively stable CH4 content in the sewage biogas is beneficial for the SOFC, as a variable LHV of the biogas supply feed would need a continuous adjustment of the fuel flow rate to the SOFC in order to maintain a fixed fuel utilization (FU) for a given current load. Nonetheless, daily or monthly fluctuations in CH4 content might occur during the life-time of the project; therefore an online CH4 sensor will be installed to provide information to the SOFC control system on the instantaneous CH4 fraction in the biogas feed. In this way, a constant FU operation of the SOFC at a given current load can be always assured. Sudden fluctuations (i.e., within minutes or hours) in CH4 content are not expected as a gas holder is placed downstream the digester. This buffer volume is large enough to smooth down possible, even though not likely, hourly variations in biogas production. Biogas flow fluctuations, which have been found to occur from the SMAT historical measurements, will be also managed through a detailed PID controller: the control system will vary the SOFC output power in order to keep constant a chosen gas holder level. The presence of contaminants in the biogas stream is another fundamental aspect to deal with for the integration of SOFC modules within a WWTP. The amount and type of biogas contaminants in the digester gas of the Collegno plant have been monitored in the period from July to October 2015. As expected, the main contaminants are H2S and siloxanes. Mercaptans and other organic sulfur compounds are also present at lower concentrations [18]–[20]. The H2S content is relatively low (25 mg/Nm3 corresponds to ~17 ppm(v)) since in-situ sulfur precipitation is carried out already in the water line through the addition of iron chloride
Table 2. Biogas composition and contaminants in WWTP. Compound Methane Carbon dioxide Oxygen Carbon monoxide Hydrogen sulfide Sulphur Mercaptans Ammonia Total siloxanes D6 D5 D4 L3 Hexane Heptane Toluene Xylene Limonene Aliphatic Hydrocarbo ns Aromatic hydrocarbo ns Alicyclic hydrocarbo ns
4
[%]
#1 65.5
#2 64.7
#3 63.4
#4 63.8
#5 63.1
#6 64.4
[%]
32.2
30.39
30.15
31.6
33.3
35.1
[%]
0.33
0.22
0.17
0.11
0.06
0.02
[mg/m3]
2.7
3.1
2.1
1.8
1.2
0.8
[mg/m3]
25.2
27.2
25.9
25.5
22.7
32.9
[mg/m3]
2.7
2.9
2.4
2.3
2.1
2.6
[mg/m3]
0.132
0.112
0.039
0.091
0.052
0.032
0.82
5.67
17.4
43.8
13.4
12.8
[mg/m3] [mg/m3] [mg/m3] [mg/m3] [mg/m3] [mg/m3] [mg/m3] [mg/m3]
0.00 0.75 0.07 0.00 0.23 0.2 6.12 0.48 5.11
0.17 4.08 1.42 0.00 0.31 0.26 5.67 0.77 4.08
0.61 13.57 2.87 0.35 0.29 0.19 9.41 0.4 3.81
1.92 33.15 8.10 0.63 0.61 0.58 3.21 0.55 7.95
0.95 9.80 2.21 0.44 0.31 0.12 8.75 0.17 8.15
0.89 9.34 2.25 0.32 0.36 0.35 8.76 0.21 6.76
[mg/m3]
118.5
114.2
112.7
116
76.7
46
[mg/m3]
3.22
24.5
6.81
6.57
3.98
1.85
[mg/m3]
21.4
0.5
22.7
16.3
11.7
9.13
[mg/m3]
Copyright © 2016 by ASME
2. SOFC INTEGRATION IN THE WWTP The integration of an SOFC system in a WWTP needs to find a reliable match between the fuel cell electrical and power production and the plant needs. Looking at the SMAT Collegno plant, thermal and electrical needs have been evaluated in order to underline the opportunities and criticalities of SOFC modules in waste water plants. First, the thermal load for the digester and sludge heating and biogas production has been evaluated; second, the electrical load for the overall plant, including the water treatment line, is shown.
The available equivalent biogas energy is not always able to guarantee the thermal self-sufficiency of the digester (the calculation of thermal energy in biogas in the current scenario assumes that all biogas is used for heat production in a 90% efficiency boiler). This is the case of the period spanning from December to March, during which the digester thermal load is higher than the thermal energy contained in biogas.
2.1 THERMAL LOAD OF THE DIGESTER A single digester is operating in the Collegno Plant. Both nominal and limiting operating conditions of the digester in terms of its thermal performance are summarized in Table 3. Heat transfer coefficient and digester dimensions have been retrieved from the SMAT Collegno digester design, while temperatures are collected from Turin ambient temperature (external), data on water temperature in WWTP (water) and assumptions for the ground temperature. Figure 5. Shares of digester thermal load [kW] as covered by either biogas or NG burning in boilers.
Table 3. Digester thermal properties and design conditions. Nominal Limit conditions conditions 42.17 42.17 15 10 2 -5 10 5
Mean digestion temperature* Sludge inlet temperature External temperature Floor temperature Sludge flow rate in Collegno 240 WWTP** Heat transfer coefficient 0.8 through non-underground 0.9 walls Heat transfer coefficient 2 through underground walls 2.3 Dispersions through pipes (HP) 5% * Mean value between 2014 and 2015 data **Nominal sludge flow rate 10 m3/h.
°C °C °C °C
240
m3 d-1
0.8
kcal h-1 m-2 °C-1
0.9
W m-2 °C-1
2 2.3
kcal h-1 m-2 °C-1 W m-2 °C-1
5%
%
Clearly, the use of biogas for electricity production in the SOFC will further reduce the available thermal energy for the digester. In the DEMOSOFC installation, thermal energy will be recovered from surplus biogas that is not used for the electricity generation, and from the SOFC exhuast gas streams.
The thermal loads calculated, based on the digester thermal properties, design conditions and physical dimensions are given in Table 4. Table 4. Digester thermal load Yearly thermal balance
Nominal
Limit
Floor + Roof heat losses
40.7
48
kW
Bottom
32,1
37.3
kW
Thermal load for sludge pre-heating Dispersion through pipes (5%)
297.6 18.5
355.8 22.4
kW kW
Total thermal load
388.9
463.2
kW
Figure 6. Effect of pre-thickening on digester thermal load.
A shown in Table 4, the digester thermal load is dominated by incoming sludge pre-heating. Measures to reduce the thermal load of the digester foresee treatments for enhanced prethickening of the sludge that feeds the digester. In this way, the organic matter results less diluted in water and significant reductions in the overall digester load can be achieved. Available commercial pre-thickening options have been analysed, which are dynamic and centrifugal pre-thickeners. The first one can reach up to 5% SST content (starting from SMAT 1.91 %) requiring a low amount of electrical power (4 kWe for SMAT Collegno sludge flow rate) and around 5 m3 of polyelectrolyte
Because of varying availability of sludge and external ambient temperature, it is worth referring to and calculating the seasonal thermal profile of the digester. The seasonal heat duty of the digester with a hourly resolution has also been calculated, taking into account variable digester temperature, sludge inlet flow, biogas production and reference temperatures according to SMAT data for 2015.
5
Copyright © 2016 by ASME
for kg of SSV in the sludge to guarantee the sludge flocculation. The second option, being a centrifugal system, required a higher electrical power (around 20 kWe) and a little lower polyelectrolyte consumption (4 m3/kg SSV) but can reach up to 8% SST in the outlet stream. Results for the two systems in terms of thermal load reduction are shown on Figure 6 where the heat requirement is more than halved by adopting even only the dynamic prethickener up to 5% SST. The average thermal load values are shown in Table 5 and will be used in the next chapter to calculate the coverage of heat requirement with the SOFC modules.
Next chapters will be devoted to the presentation of a SOFC system model which aims to show the possible performance of an SOFC system in WWTP. The model is presented and discussed, and results are compared to the existing needs in the SMAT Collegno WWTP. Figure 8 also shows the model control volume.
Table 5. Average thermal load with pre-thickening. Dynamic prethickening Centrifugal prethickening
Outlet SST [%]
Nominal [kW]
Limit [kW]
5%
195.8
232.3
8%
151.0
178.8
SOFC system model control volume Figure 8. DEMOSOFC plant design and modeling control volume.
2.2 ELECTRICAL LOAD In Figure 7 the monthly trend of the electrical load in WWTP is shown. Since the main objective of the plant is water treatment, a high power consumption is related to these plants, which usually is covered, in economic terms, by taxes paid by citizens.
3. SOFC SYSTEM MODEL 3.1 SOFC LAYOUT AND ASSUMPTIONS A schematic diagram of the proposed SOFC system is shown in Figure 9. The SOFC system consists of air and fuel blowers, a mixer, a pre-reformer, fuel and air pre-heaters, SOFC stack, an AC/DC inverter and an after burner.
Figure 7. Electricity consumption in the WWTP.
For this reason, the electricity requirement of WWTPs is usually higher than energy which can be internally recovered through the energy valorisation of biogas, even when using a high efficiency fuel cell module. Nevertheless, thanks to the SOFC system, around 25-30% of the electrical load can be constantly supplied by the CHP system, avoiding the corresponding purchase of this quota from the grid.
Figure 9. Model layout.
The model is developed for a fixed module size of around 60 kW electric. In order to get results for the DEMOSOFC configuration, results should be applied to a system with 3 modules in parallel. On the one side, air is first preheated in the air heat exchanger after being pressurized through the air blower. Then it is sent to the cathode side of the stack. Clean biogas, on the other hand, is pressurized using the fuel blower before mixing with the anode gas recycle. The mixed gas is sent to the pre-reformer where a fraction of methane is converted to the hydrogen through reforming and shifting reactions. The reformer is modelled as an adiabatic
2.3 PLANT LAYOUT From the analysis of the different sections of the plant, the DEMOSOFC layout has thus been defined. As shown in Figure 8, the system will consist of the already existing digester and gas holder, the biogas clean-up section, the three SOFC modules and the heat recovery system. Furthermore, a parallel and already existing sludge preheating section is also included in the plant design. If needed to maintain the temperature at a given set-point within the digester, the boiler can be fed by either surplus biogas contained in the gas holder or natural gas from the grid.
6
Copyright © 2016 by ASME
reactor, where outlet temperature and methane conversion are calculated depending on the inlet conditions. No heat from external is thus required in this configuration. Main purpose of the reactor is to convert the heavier hydrocarbons. Then, the reformed gas is pre-heated through the fuel heat exchanger before feeding the anode side of the stack. The fuel
Input parameters for the model are shown in Table 6 while the electrochemical model for the SOFC is presented in Ref. [26]. Also, voltage losses formula reported in Ref [27] are used for the electrochemical modelling. 3.2 SYSTEM PERFORMANCE EVALUATION To evaluate the system performance, the electrical efficiency is defined as; Where,
𝑊̇𝑛𝑒𝑡 (1) 𝑚̇𝑏𝑖𝑜𝑔𝑎𝑠 𝐿𝐻𝑉 gas experiences internal reforming which brings hydrogen-rich products to participate in the electrochemical reaction inside the fuel cell stack. Internal reforming has been considered as IIR (Indirect Internal Reforming), thus taking place not directly on the anode catalyst but on a physically separated catalyst but thermally connected to the fuel cell in order to receive the required heat for the reaction. The electrochemical reaction generates thermal energy, a part of which is used to deliver the required heat for the internal reforming reaction, another part is employed to heat up the cell products and the residual reactants, and the rest is transferred to the environment as a heat loss. Anode and cathode exhaust gases with higher temperature are obtained and electrical power is produced. An inverter is used to convert the DC power generated by the stack into AC grid quality electricity. After accomplishing the electrochemical reactions in the SOFC, the excess air exiting the cathode and the unreacted fuel exiting the anode are supposed to combust completely in the after-burner. However, a fraction of anode exit gas is recirculated back to the mixer to be mixed with biogas fuel (state #5). A certain Steam to Carbon (SC) ratio to avoid use of external demineralized water is defined and the amount of recirculation fraction is calculated. 𝜂𝑒𝑙 =
𝑊̇𝑛𝑒𝑡 = 𝑊̇𝑆𝑡𝑎𝑐𝑘,𝐴𝐶 − (𝑊̇𝐴𝐵𝐿 + 𝑊̇𝐹𝐵𝐿 )
In equation (2), 𝑊̇𝑆𝑡𝑎𝑐𝑘,𝐴𝐶 is the stack output power, 𝑊̇𝐴𝐵𝐿 and 𝑊̇𝐹𝐵𝐿 are the consumed power for air and fuel blowers respectively. Also, as the exhaust stream (state #14) of SOFC system is exploited for the production of useful heat, thermal efficiency could be defined considering that the exhaust would be cooled in a heat exchanger (not shown in system layout) to a specified temperature (here assumed 70 oC, safety value in order to avoid condensation, considering the gas dew point). 𝜂𝑡ℎ =
5000 50 2.5 96 97 85 80
cm2 % % % %
65
%
20.19 2 3 5 70
Ref. [28], [29] [28], [29][30] [31][29] [26], [32] [26] [26] [26] [26]
MJ/kg % %
[26] [26]
%
[26]
o
C
𝑚̇𝑏𝑖𝑜𝑔𝑎𝑠 𝐿𝐻𝑉
60%
40%
100%
80%
57.22 kW
60
60
50
50
40
40
Wnet
30
30
h el
20
20 10
10 0
-
Electrical efficiency [%]
Unit o C o C
(3)
3.3 MODEL RESULTS For given stack inlet temperature and fuel utilization factor, the effects of current density on the net electrical power of the system as well as on the electrical efficiency are illustrated in Figure 10. Referring to this figure, there is an optimum value of current density at which the net output power is maximized. This is due to the fact that increasing the current density leads to a rise in the fuel cell stack power.
Net output power [kW]
Value 700 850
𝑄̇𝑡ℎ
Where, 𝑄̇𝑡ℎ is the thermal heat load which could be obtained by cooling down the exhaust of SOFC in a heat exchanger as explained above.
Table 6. Model input parameters. Input Parameter Stack inlet temperature Stack outlet temperature Cell number Active area S/C Inverter efficiency After burner efficiency Fuel utilization factor Air and fuel blowers isentropic efficiency Methane molar fraction in biogas Biogas LHV Stack pressure drop Heat exchanger pressure drop Afterburner pressure drop Exhaust cooled temperature
(2)
0 500
1000
1500
2000
2500
3000
3500
4000
4500
2
Current density [A/m ]
Figure 10. Net output power and electrical efficiency versus current density
The hot after burner exit gas is used to preheat the air and fuel and then available for heat recovery within the plant. The model operation is performed with a fixed active area, a constant number of cells and a fixed fuel utilization factor.
The increase in current density, however, causes a significant surge of the cell polarizations so that the net output power decreases. When current density approaches its limiting value,
7
Copyright © 2016 by ASME
the effect of concentration polarization on the cell voltage becomes more pronounced. The full load is selected for having the maximum net output power (57.22 kW) and partial loads are obtained by decreasing the current at constant fuel utilization and constant cell numbers. It is also shown that an increase in current density results in a reduction of electrical efficiency. Even though, increasing the current density increases the net output power, the fuel mass flow rate is also increased. As a matter of fact, the later increase overcomes the increase in power (see eq. 1) so the trend of electrical efficiency could be justified. The obtained results for full load, 80%, 60% and 40% load are summarized in Table 7, respectively. It can be seen that for full load operating condition around 21.6 kg/h biogas is needed to produce the 57.22 kW net power. Also, the thermal load is calculated as 48.92 kW. Power consumption in air blower is much higher compared to that of fuel blower due to the higher mass flow rate of air. For partial load, as expected, the heating potential is reduced due to the decrease in mass flow rate (although the exhaust temperature increases). Referring to full load table, the cell obtained voltage is 0.6114 V which is quite low. As shown in Figure 11, the voltage can be increased (for having the same maximum output power) by increasing the cell numbers. However, taking into account the economic point of view, it might not beneficial to increase the number of cells (i.e., the active area installed).
0.76
Maximum net output power (57.22 kW)
Cell Voltage [V]
0.74
100%
80%
60%
40%
0.66 5000
3490
2617
1745
Current Cell voltage Fuel inlet flow Anode recycle ratio Exhaust temperature Exhaust mass flow Stack AC gross power Air blower power Fuel blower power Thermal recovery Electrical efficiency Total efficiency
21.82 0.6114 21.60 0.6141 270.8 0.2319
17.75 0.6731 17.27 0.6141 285 0.1543
13.09 0.712 12.95 0.6141 297 0.101
7.725 0.743 8.63 0.614 310 0.059
A V kg/h o C kg/s
64.02
56.38
44.72
31.13
kW
6.612 0.194 48.92 47.23 87.62
4.37 0.155 35.08 53.51 89.72
2.85 0.116 24.39 57.47 91.04
1.67 0.077 15.24 60.66 92.11
kW kW kW % %
6000
6500
7000
7500
8000
Figure 11. Effect of increasing the cell numbers on cell voltage for having a specific net output power
4. ECONOMIC EVALUATION A final economic evaluation has been carried out in order to analyse the payback time (PBT) of the investment. Plant costs have been divided into capital costs, due in the year of construction, and operating costs, due each year as they occur during the plant lifetime. The analysis has been performed starting from a base scenario in which 3 SOFC modules (64 kWe AC production at load, the same SOFC shown on Chapter 3) were installed in the SMAT Collegno WWTP, as it is foreseen for the DEMOSOFC project. Data on the biogas flow rate, sludge flow rate, temperatures and costs of energy are directly taken from the plant owner, while data on the SOFC modules are derived from the SOFC plant model previously described. Input data are presented for the base scenario with no use of pre-thickening systems. The cost methodology approach followed the NETL methodology [33] [34]. The total capital investment has been calculated as the sum of the following items: Cost of the SOFC modules (including all the auxiliary components such as blowers, reformers, heat-exchangers). The cost has been taken from a widely known declaration from Bloomenergy, the largest SOFC producer worldwide [35][36][37]. The cost has also been confirmed by a commercial survey among SOFC stationary systems available on the market [38][39]. Cost of the clean-up system, including vessels and catalyst. The cost has been scaled, with a scaling factor of 1 and using the biogas flow as parameter, from a reference work in which a detailed clean-up system was designed for a WWTP with a MCFC installation. [16]. Cost of the heat recovery system. The cost has been derived from the Turton’s handbook, using the presented methodology depending on hot and cold streams temperatures, materials and pressures. [40] Cost of the NG auxiliary boiler. This component is required in order to supply the required thermal load for the digester (in case the thermal request is higher than the SOFC thermal
Unit
4363
5500
Cell Number [-]
A/m
Current density
0.7
0.68
Table 7. SOFC system results in different operating points (FU is constant at 85%). Load
V cell
0.72
2
8
Copyright © 2016 by ASME
c€/kWh [42][43] against 16 c€/kWh), profits are generated for each kWh electric produced by the SOFC and consumed internally to the WWTP. Values and references for the operating costs and earnings are summarized below.
Table 8. Input data for investment cost evaluation.
Table 9. Input data for operating costs and incomes evaluation.
64.02
kWe
3 192.06
kWe
SOFC capacity factor* SOFC stack lifetime SOFC module cost SOFC replacement cost (% of SOFC cost)
95.7% 6 7’000
y $/kW
Biogas flow rate to SOFC Iron oxide Chiller Low Temperature Polisher (AC) High Temperature Polisher
64.77 15’310 20’376
kg/h € €
27’168
€
7’126
€
Heat duty HX type Heat-exchanger Cost
146.73 kW Multiple pipe 61’358 €
30%
Ref. Model
Reformer
Unit
HP HP [36] [39] HP
Clean-up
Value
Model [16] [16] [16] Labor
Parameter SOFC module capacity – Gross AC Power Number of modules Total SOFC AC power
[16]
Model [40] [40]
Boiler
Auxiliary boiler size 250 kWe Model Reference cost 10’000 € SMAT Reference size 1’000 kWe SMAT Scaling factor 0.7 HP *Data from DEMOSOFC analysis on SOFC regulation in SMAT plant
Furthermore, operating costs have been considered including: Cost for reformer catalyst replacement (both in case of external and indirect internal reforming). The cost has been scaled, based on the methane conversion ratio, from the NETL cost evaluations on NG fed fuel cells plants. [41] Cost for clean-up adsorbents substitution, always scaled from the reference plant used for investment costs. [16] Labour cost: the values has been taken from literature for a technical operator able to act on innovative plants. [38] Natural gas cost: since the thermal load is not always fully supplied by the SOFC thermal recovery, extra-NG is required. The NG cost has been taken from the SMAT Collegno WWTP. Ordinary maintenance costs: considered as 2% of the Total Plant Cost. SOFC stack substitution: this operating cost occurs every 6 year (assumed SOFC lifetime) and is equal to 30% of the SOFC module investment cost.
Parameter
Value
Unit
Ref.
Initial fill - NETL Initial fill - Model Catalyst unit cost Catalyst cost per year
1’341 0.07 499 10
m3 m3 $/m3 €/y
[29] Model [41]
Daily flow rate Iron oxide Low Temperature Polisher High Temperature Polisher Cleaning operation cost
1’555 4’187
m3/day €/y
SMAT [16]
4’187
€/y
[16]
78
€/y
8’457
€/y
[16]
75’000
$/y
[38]
Yearly labor rate per operator Number of operators % of time for SOFC plant Total yearly labor cost
1 30%
HP
20’700
€/y
Boiler efficiency NG cost Total yearly cost for NG
85% 0.060 83’718
€/kWh €/y
O& M
Maintenance Cost
29’226
€/y
SMAT
Inco -mes
Electricity price
16
c€/kWh
SMAT
NG
HX
Clean-up
SOFC module
production). The cost has been scaled, with a scaling factor of 0.7, from an available cost from SMAT for a NG boiler currently installed in the Collegno plant. Values and references for the chosen investment costs are summarized on Table 8.
SMAT SMAT
From the chosen input data, the cash flow analysis has been determined. The methodology for the cash flow calculation is described in an author previous work [34]. 4.1 CASE STUDIES The analysis has been performed for different case studies: Current scenario: biogas burning only in boilers. No electrical production and thus no revenues have been included in this study. The only cost for the WWTP owner is the boiler investment cost and its yearly maintenance. Base scenario: 3 60 kWe each SOFC modules installed with no pre-thickening. As discussed above, without pre-thickening the digester thermal load is relatively high and so heat recovery from the SOFC is not enough to cover the internal thermal needs. Additional NG is burned in boilers to supply the required heat. Future scenario: 3 SOFC modules with dynamic prethickening of incoming sludge to the digester. Economic data on this component have been derived from commercial suppliers along with related consumption of electricity and poly-electrolyte.
Furthermore, revenues from energy sells have been considered. Since the revenue for electricity produced from the SOFC and sold to the grid (based on the Italian market) is lower than the purchase price for electricity paid the WWTP owner (11
9
Copyright © 2016 by ASME
4.2 ECONOMIC RESULTS The cash flow analysis of the SOFC installation has been performed calculating both investment and operating costs, together with payback time for the three scenarios. In Figure 12, the cost of each plant unit is shown for the base scenario: 88% of the total results is related to the SOFC modules. Almost no effect has been found for the future scenario with pre-thickening since its introduction accounts as an increase of 6.88% of the total plant cost, moving the entire investment from 1 659 k€ to 1 773 k€. Figure 14. Cash flow analysis results.
Finally, a sensitivity analysis has been performed on the SOFC module cost in order to underline how a market penetration of this technology, followed by cost reduction in manufacturing, could lead to an interesting economic profile for their installation in biogas plants. In Figure 15 results are shown only for the future scenario. The PBT becomes suitable (lower than 10 years) even for the base scenario, when SOFC module cost reaches values lower than 3 000 $/kW. Figure 12. Breakdown of plant costs in base scenario.
From the operating point of view, on the other side, the use of pre-thickening could definitively reduce the thermal request for the anaerobic digestion, thus entailing a strong reduction in the cost for the natural gas fed to the auxiliary boiler. The total yearly operating costs in fact shift from 83.7 k€ in the base scenario, in which NG accounts for around 44% (see Figure 13), to 14.4 k€, in which NG is only 0.7%. Figure 15. Sensitivity analysis on SOFC module cost in the future scenario.
5. CONCLUSIONS The main characteristics and design considerations for the installation of an integrated biogas SOFC plant into a real WWTP have been presented and discussed in this work. The research activities here reported are part of the design phase of a large biogas SOFC installation related to the DEMOSOFC project. An SOFC model has been used to predict the maximum efficiency and off-design performance of the single SOFC module. A detailed understanding of electrical and thermal needs within the WWTP and SOFC energy production has also been performed. From the results, the sludge pre-thickening system has been pointed out as an effective way for reducing the thermal load of the digester thus making possible the installation of a fuel cell based cogeneration system which is able to cover around 100% of the anaerobic digester thermal load (i.e., the thermal self-sufficiency of the plant is achieved). The advantages of an SOFC installation coupled with a pre-thickening system have also been confirmed by the economic analysis. To conclude, integrated biogas SOFC plants provide several benefits to the WWTP which are:
Figure 13. Share of operating costs in base (I) and future (II) scenarios.
The positive effect of pre-thickening in WWTPs is also underlined by the cash flow plot, shown in Figure 14. The PBT is negative for the base scenario, because of the high SOFC investment cost - not repaid during lifetime by the low yearly net incomes - but becomes better, even if not convenient, in the future scenario. The still high PBT is due to the high investment cost for this CHP technology, especially if compared with traditional ICE which costs can reach values lower than 1 000 €/kW for large size systems. In the SOFC scenarios, the negative yearly trends every 6 years are due to the SOFC replacement.
10
Copyright © 2016 by ASME
Revenues for high-efficiency electricity conversion of local biogas; - The possibility of heat-recovery leading to a selfsufficient WWTP from a thermal point of view. - Reduced emissions (NOx, SOx) when compared to biogas use in ICEs; - The possibility to secure critical loads within the WWTP by island-operation of the SOFC modules. Future work will be devoted to a more detailed definition and modeling of the SOFC control strategy to cope with to the fluctuating supply in order to have dynamic-based energy and economic results.
fuelled micro gas turbine cogeneration systems ( MGTCGSs ) in middle- and small-scale sewage treatment plants : Comparison of performances and optimization of MGTs with various electrical power outputs,” Energy, vol. 38, no. 1, pp. 291–304, 2012.
-
REFERENCES [1]
“DEMOSOFC project official website.” .
[2]
Eddy and Metcalf, Wastewater Engineering - Treatment and Reuse, Fourth. McGraw Hill Education, 2003.
[3]
A. Fabregat, C. Bengoa, M. P. Caporgno, R. Trobajo, and N. Caiola, “Biogas production from sewage sludge and microalgae co-digestion under mesophilic and thermophilic conditions,” vol. 75, pp. 374–380, 2015.
[4]
P. Manara and A. Zabaniotou, “Towards sewage sludge based biofuels via thermochemical conversion – A review,” Renew. Sustain. Energy Rev., vol. 16, no. 5, pp. 2566–2582, 2012.
[5]
[6]
[7]
[8]
G. Silvestre, B. Fernández, and A. Bonmatí, “Significance of anaerobic digestion as a source of clean energy in wastewater treatment plants,” Energy Convers. Manag., vol. 101, pp. 255–262, 2015. J. C. Bruno, V. Ortega-López, and A. Coronas, “Integration of absorption cooling systems into micro gas turbine trigeneration systems using biogas: Case study of a sewage treatment plant,” Appl. Energy, vol. 86, no. 6, pp. 837–847, 2009. A. Colmenar-santos, G. Zarzuelo-puch, and D. Borgediez, “Thermodynamic and exergoeconomic analysis of energy recovery system of biogas from a wastewater treatment plant and use in a Stirling engine guez,” vol. 88, 2016. M. Firdaus, B. Basrawi, T. Yamada, K. Nakanishi, and H. Katsumata, “Analysis of the performances of biogas-
11
[9]
F. Basrawi, H. Ibrahim, and T. Yamada, “Optimal Unit Sizing of Biogas-Fuelled Micro Gas Turbine Cogeneration Systems in a Sewage Treatment Plant,” Energy Procedia, vol. 75, pp. 1052–1058, 2015.
[10]
J. Van Herle, Y. Membrez, and O. Bucheli, “Biogas as a fuel source for SOFC co-generators,” vol. 127, no. 2004, pp. 300–312, 2010.
[11]
J. Van Herle, F. Maréchal, S. Leuenberger, Y. Membrez, O. Bucheli, and D. Favrat, “Process flow model of solid oxide fuel cell system supplied with sewage biogas,” vol. 131, pp. 127–141, 2004.
[12]
G. Venkatesh and R. Abdi, “Economic e environmental analysis of handling biogas from sewage sludge digesters in WWTPs ( wastewater treatment plants ) for energy recovery : Case study of Bekkelaget WWTP in Oslo ( Norway ),” Energy, vol. 58, pp. 220–235, 2013.
[13]
O. Joneydi Shariatzadeh, a. H. Refahi, M. Rahmani, and S. S. Abolhassani, “Economic optimisation and thermodynamic modelling of SOFC tri-generation system fed by biogas,” Energy Convers. Manag., vol. 105, pp. 772–781, 2015.
[14]
S. Farhad, Y. Yoo, and F. Hamdullahpur, “Effects of fuel processing methods on industrial scale biogas-fuelled solid oxide fuel cell system for operating in wastewater treatment plants,” vol. 195, pp. 1446–1453, 2010.
[15]
N. De Arespacochaga, C. Valderrama, C. Peregrina, A. Hornero, L. Bouchy, and J. L. Cortina, “On-site cogeneration with sewage biogas via high-temperature fuel cells : Benchmarking against other options based on industrial-scale data,” Fuel Process. Technol., vol. 138, pp. 654–662, 2015.
[16]
D. D. Papadias, S. Ahmed, and R. Kumar, “Fuel quality issues with biogas energy - An economic analysis for a stationary fuel cell system,” Energy, vol. 44, no. 1, pp. 257–277, 2012.
Copyright © 2016 by ASME
[17]
D. Papurello, A. Lanzini, D. Drago, P. Leone, and M. Santarelli, “Limiting factors for planar solid oxide fuel cells under different trace compound concentrations,” Energy, vol. 95, pp. 67–78, 2016.
siloxanes,” J. Power Sources, vol. 279, pp. 460–471, Apr. 2015. [26]
a. S. Mehr, S. M. S. Mahmoudi, M. Yari, and a. Chitsaz, “Thermodynamic and exergoeconomic analysis of biogas fed solid oxide fuel cell power plants emphasizing on anode and cathode recycling: A comparative study,” Energy Convers. Manag., vol. 105, pp. 596–606, 2015.
[18]
B. Tjaden, M. Gandiglio, a. Lanzini, M. Santarelli, and M. Järvinen, “Small-scale biogas-SOFC plant: Technical analysis and assessment of different fuel reforming options,” Energy and Fuels, vol. 28, pp. 4216–4232, 2014. [27]
[19]
M. Gandiglio, A. Lanzini, M. Santarelli, and P. Leone, “Design and Balance-of-Plant of a Demonstration Plant With a Solid Oxide Fuel Cell Fed by Biogas From Waste-Water and Exhaust Carbon Recycling for Algae Growth,” J. Fuel Cell Sci. Technol., vol. 11, no. 3, p. 031003, 2014.
S. Wongchanapai, H. Iwai, M. Saito, and H. Yoshida, “Selection of suitable operating conditions for planar anode-supported direct-internal-reforming solid-oxide fuel cell,” J. Power Sources, vol. 204, pp. 14–24, 2012.
[28]
D. Papurello, A. Lanzini, L. Tognana, S. Silvestri, and M. Santarelli, “Waste to energy: Exploitation of biogas from organic waste in a 500 Wel solid oxide fuel cell (SOFC) stack,” Energy, vol. 85, pp. 145–158, 2015.
A. Lanzini and P. Leone, “Experimental investigation of direct internal reforming of biogas in solid oxide fuel cells,” Int. J. Hydrogen Energy, vol. 35, no. 6, pp. 2463– 2476, 2010.
[29]
SOLIDPower, “ASC-700 Datasheet.”
[30]
C. O. Colpan, I. Dincer, and F. Hamdullahpur, “Thermodynamic modeling of direct internal reforming solid oxide fuel cells operating with syngas,” Int. J. Hydrogen Energy, vol. 32, no. 7, pp. 787–795, 2007.
[31]
Y. D. Lee, K. Y. Ahn, T. Morosuk, and G. Tsatsaronis, “Exergetic and exergoeconomic evaluation of a solidoxide fuel-cell-based combined heat and power generation system,” Energy Convers. Manag., vol. 85, pp. 154–164, 2014.
[32]
F. Ranjbar, A. Chitsaz, S. M. S. Mahmoudi, S. Khalilarya, and M. a. Rosen, “Energy and exergy assessments of a novel trigeneration system based on a solid oxide fuel cell,” Energy Convers. Manag., vol. 87, pp. 318–327, 2014.
[33]
M. April, “Cost Estimation Methodology for NETL Assessments of Power Plant Performance Quality Guidelines for Energy Systems Studies Cost Estimation Methodology for NETL Assessments of Power Plant Performance,” no. April, 2011.
[34]
F. Curletti, M. Gandiglio, A. Lanzini, and M. Santarelli, “Large size biogas-fed Solid Oxide Fuel Cell power plants with carbon dioxide management : Technical and economic optimization,” vol. 294, 2015.
[20]
[21]
[22]
[23]
S. C. Surita and B. Tansel, “Emergence and fate of cyclic volatile polydimethylsiloxanes (D4, D5) in municipal waste streams: Release mechanisms, partitioning and persistence in air, water, soil and sediments,” Sci Total Env., vol. 468–469C, pp. 46–52, 2013. N. De Arespacochaga, C. Valderrama, J. Raich-montiu, and M. Crest, “Understanding the effects of the origin , occurrence , monitoring , control , fate and removal of siloxanes on the energetic valorization of sewage biogas — A review,” Renew. Sustain. Energy Rev., vol. 52, pp. 366–381, 2015. D.-G. Wang, M. Aggarwal, T. Tait, S. Brimble, G. Pacepavicius, L. Kinsman, M. Theocharides, S. A. Smyth, and M. Alaee, “Fate of anthropogenic cyclic volatile methylsiloxanes in a wastewater treatment plant,” Water Res., vol. 72, pp. 209–217, 2015.
[24]
M. Schweigkofler and R. Niessner, “Removal of siloxanes in biogases,” J. Hazard. Mater., vol. 83, no. 3, pp. 183–196, 2001.
[25]
H. Madi, A. Lanzini, S. Diethelm, D. Papurello, J. Van herle, M. Lualdi, J. Gutzon Larsen, and M. Santarelli, “Solid oxide fuel cell anode degradation by the effect of
12
Copyright © 2016 by ASME
[35]
A. Zaleski, “Bloom Energy targets the global fuel-cell market, projected to reach $40 billion by 2022,” 2015. .
[36]
Newsweek.com, “Bloomenergy interview.” .
[37]
Brenden, “Bloom Box - The Challenges Facing Fuel Cells,” 2011.
[38]
Global CCS Institute, “Toward a common method of cost estimation for co 2 capture and storage at fossil fuel power plants,” no. March, 2013.
[39]
A. Iyengar, D. Keairns, K. Krulla, and D. Newby, “Assessment of the Distributed Generation Market Potential for Solid Oxide Fuel Cells,” 2013.
[40]
R. Turton, R. C. Bailie, W. B. Wniting, A. Shaeiwitz, and T. Eclition, Analysis, Synthesis and Design of Chemical Processes. .
[41]
DOE NETL, “Analysis of Natur al Gas Fuel Cell Plant Configurations,” 2011.
[42]
Ministero dello Sviluppo Economico, “Decreto 6 luglio 2012 - Attuazione dell’art. 24 del decreto legislativo 3 marzo 2011, n. 28, recante incentivazione della produzione di energia elettrica da impianti a fonti rinnovabili diversi dai fotovoltaici,” GU Ser. Gen. n. 159 del 10-7-2012 - Suppl. Ordin. n. 143, pp. 1–65, 2012.
[43]
Gse, “Incentivazione della produzione di energia elettrica da impianti a fonti rinnovabili diversi dai fotovoltaici,” Ww.Gse.It, pp. 1–139, 2012.
13
Copyright © 2016 by ASME