DETECTION AND SEGMENTATION OF SWEEPS IN COLOR GRAPHICS IMAGES Salil Prabhakar1, Hui Cheng2, Raja Bala3, John C. Handley3, and Ying-wei Lin3 1
2 3 DigitalPersona Inc., Sarnoff Corp., Xerox Corp. Redwood City, CA, 94063 Princeton, NJ, 08543 Webster, NY, 14580
[email protected],
[email protected], {rbala, jhandley, ylin}@crt.xerox.com
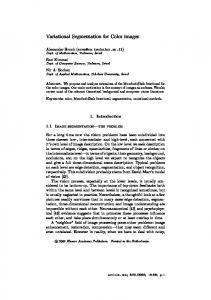
ABSTRACT Business graphics are an important class of digital imagery. Such images are computer-generated, and comprise synthetic elements such as solid fills, line art, and color sweeps. Often these images are first printed and then scanned for further electronic reuse. The printing and scanning process destroys the synthetic structure of a graphics image, and furthermore introduces distortions due to halftoning and other forms of printer and scanner noise. Subsequent reproductions usually amplify these distortions thus resulting in rapid degradation of image quality. It would thus be desirable to detect and reconstruct the original synthetic structure from the scanned image. This paper presents an effort in this direction, namely a method to detect color sweeps in scanned images. Once detected, the synthetic signature of the sweep is derived, namely its starting and ending color. This information can be used to optimize subsequent image processing operations such as rendering to an output device, or image compression. This work represents a novel application of known image processing techniques to extract semantic information from graphics images. 1. INTRODUCTION A reproduction system, such as a copier or a printer, strives for a pleasing rendering of color documents. Region classifiers have been developed to differentiate regions of images by analyzing low-level image statistics [1, 2]. For example, Revankar and Fan [1] developed an adaptable image segmentation system to differentially render black and white and color regions. An image is segmented into rendering classes, e.g., those regions requiring halftoning, sharpening, and other image processing prior to printing. To differentially render color documents, Schettini et al. [2] and Prabhakar et al. [3] developed picture-graphics classifiers. Once a color image has been identified as a graphics image, further identification of image characteristics can be used to fine-tune the rendering. The most prominent characteristics of a graphics image include patches with uniform color and areas with smoothly changing colors. This paper focuses on the identification of the second characteristic, referred to as sweeps (see Fig. 1). Gradient backgrounds of color
0-7803-7622-6/02/$17.00 ©2002 IEEE
business presentation slides are examples of sweeps. These form a line or plane in a three-dimensional color space. We will restrict the discussion to the case of a line sweep. Such a sweep is constructed in the graphics creation program by a mathematical formula to cause adjacent pixels to change color in a smooth, predicable way. For example, one can use linear interpolation of two colors to render the original image by plotting pixels of interpolated colors such that neighboring spatial regions are rendered with colors from neighboring color regions. Other mathematical descriptions of curves achieve like effects.
Fig. 1: Synthetic graphics image with several color sweeps.
When a graphics image is to be rendered to an output device such as a cathode ray tube (CRT) display, or xerographic printer, the image colors must be restricted to the limited range of colors reproducible on the device (known as its gamut). This step is known as gamut mapping. A simple approach is to preserve in-gamut colors without alteration and clip out-of-gamut colors to the closest in-gamut colors. More sophisticated techniques can be used [4, 5]. Ideally, the gamut-mapping algorithm should be tailored to the image content. Spot colors may favor the aforementioned clipping approach, since this maximizes color fidelity. For sweeps, however, smoothness of color transitions is the most important criterion. Where the colors of a sweep exceed the output gamut, the aforementioned clipping approach will show disagreeable artifacts. It may thus be desirable to sacrifice color fidelity within the gamut to achieve a smooth color transition. Thus knowing that a region is, or contains, a sweep aids in color reproduction.
III - 761
IEEE ICIP 2002
Furthermore, if the graphics document is printed and scanned, the sweeps do not exactly contain the colors on the line due to halftone and scanner noise. If a reproduction system can correctly identify and segment the sweep areas in an image, the original sweeps can be reconstructed in the color space and rendered noise-free. Additionally, if extreme colors of the sweep can be identified, rendering can be tailored to achieve best smoothness, contrast and differentiation among colors in the reconstructed sweeps. This paper proposes a new algorithm to detect and segment sweeps in a color graphics image.
threshold = 0.4, higher threshold = 0.9. Next, we used a standard 8-connected component algorithm to perform the connectivity analysis of the edges in each of the H_UV, H_LU, and H_LV edge maps and ignored very small edges (e.g., less than 30 pixels). Note that each sweep appears as a line segment in the histogram images and is detected as two parallel edges in the edge map. The edge maps are binary images with white pixels representing edges and black pixels representing non-edges.
2. SWEEP SEGMENTATION ALGORITHM Fig. 2 depicts our current algorithm that comprises the following steps: 1) convert an input graphics image to a color space; 2) project the image to a number of planes within the color space; 3) detect curves in each plane and link overlapping curves; 4) associate pixels with colors that project to the detected curves in each plane with evidence that the color belongs to a sweep; 5) for each pixel color, combine sweep evidence to determine whether pixels of that color are part of a sweep; and 6) a post-processing may be optionally and selectively used to reject false positives (i.e., areas falsely identified as sweeps). 2.1 Color space conversion The input graphics image is first transformed into a threedimensional histogram in an appropriate color space. We chose CIELUV because additive mixtures of two colors lie along a straight line in CIELUV space. Color sweeps appear as lines in the three-dimensional CIELUV color histogram. However, since further processing (e.g., edge and line detection) in the three-dimensional space is difficult and time consuming, the present algorithm operates on two-dimensional orthogonal projections of the three-dimensional histogram. Lines in three-dimensional space project either as lines or points in any twodimensional space. 2.2 Two-dimensional color histogram estimation The algorithm estimates GL x GL two-dimensional histograms (GL is typically 256) from the input image in UV, LU, and LV projections. Next, the histograms are normalized by a scaling scheme to create H_UV, H_LU, and H_LV histograms taking values in 0 to GL-1. The normalized histograms are considered as gray-scale images for further processing. 2.3 Curve detection To detect edges in H_UV, H_LU, and H_LV, we used a standard Canny edge detector [6] with empirically determined settings: σ = 5, mask size = 51, lower
Fig. 2: Our sweep segmentation algorithm.
In order to estimate the location and orientation of the sweep line segments, the detected edges in the H_UV, H_LU, and H_LV edge maps are converted to points in a Hough parametric space using a standard Hough transform algorithm [7]. Points in the Hough space with a large number of votes (i.e., more than a threshold T = 20) are selected. The selected points represent straight lines in the H_UV, H_LU, and H_LV histograms. Lines detected in the Hough space are in parametric form and run to infinity at both ends. However, identification of end points of sweeps is important. Each detected line in the Hough space is rendered as a 3-pixel wide line on the edge map using a standard scan-linedrawing algorithm with a fixed gray value of 100. The overlap between the edges and the line drawn are marked as “overlap”. The extremities of the pixels marked as “overlap” define the line segments in the two-dimensional
III - 762
histogram images. As mentioned before, each sweep in the image appears as parallel line segments in the edge map. Hence, the pairs of parallel line segments in the edge maps are identified and are considered for further processing while other segments are ignored. Next, the mid segment of each pair of parallel line segments is computed and recognized as a sweep.
corresponds to a sweep. To segment the input graphics image into sweep and non-sweep regions, sweep segment information from the three projections is combined. A restrictive scheme performs an “and” operation on the information from the three projections: a pixel with color (l, u, v) is in a sweep if and only if (u, v) is a sweep AND (l, u) is a sweep AND (l, v) is a sweep. Alternatively, a liberal scheme could use an “or.” The choice between restrictive and liberal combination schemes depends on the application. 2.5 Image segmentation
(a)
(b)
(c)
(d)
(e)
(f)
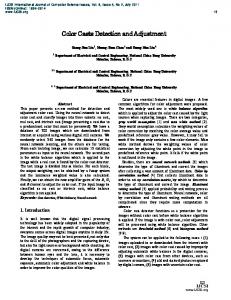
Once the sweep segments in each of the H_UV, H_LU, and H_LV edge maps are identified and the UV, LU, and LV projections are combined, the original graphics image is revisited. Each pixel in the input graphics image is labeled either “sweep” or “non-sweep”. The Euclidean distance between the sweep segments and each pixel in the input image is computed and compared to a particular threshold value. If the distance is less than the threshold, the pixel is labeled “sweep”. Otherwise, the pixel is labeled “non-sweep”.
(g) (h) (i) Fig. 3: Intermediate steps of our sweep segmentation algorithm. The images in (a), (b), and (c) show the H_UV, H_LU, and H_LV histograms for the image in Fig. 1 respectively; (d), (e), and (f) show the corresponding edge maps and (g), (h), and (i) show the corresponding detected parallel line segments. Fig. 5: A graphics image scanned from an old magazine containing one prominent sweep from red to yellow and one small sweep in gray.
2.6 Post-processing
Fig. 4: The result of the proposed sweep segmentation algorithm on the image shown in Fig. 1.
2.4 Sweep detection The sweeps detected as segments in the H_UV, H_LU, and H_LV edge maps are projections of the original sweeps from the three-dimensional color space. Segment information consists of a data structure that indicates for each pair (u, v), (l, u), and (l, v) whether or not the pair
For synthetic graphics, this scheme to detect and segment sweeps works well. However, for scanned graphics images, the result from this segmentation scheme may have an unacceptable number of errors. Often, for a liberal scheme, there are far more false positives than false negatives. A post-processing stage may be used to reject the false positives. First, we use a median filter to reject small isolated areas of sweeps and non-sweeps. Second, we compute the gradient information in the image and reject those areas where the gradient in the image is less than a threshold (an area of uniform color in an image). A more sophisticated type of gradient post-processing would check for consistency of the gradient at several scales and ignore gray sweeps by rejecting the detected horizontal line segments in the H_LU and H_LV edge maps but is not currently implemented.
III - 763
3. RESULTS For demonstration purpose, we generated a synthetic graphics image with a large number of color sweeps (see Fig. 1). The first six circles contain sweeps in red, green, blue, cyan, magenta, and yellow, respectively. The rest of the six circles contain the same sweeps as the first six with the starting and ending colors exchanged. The synthetic image was printed on paper using a color printer and then scanned at 600 dpi. Some of the intermediate steps of the sweep segmentation algorithm are shown in Fig. 3, and Fig. 4 shows the results of the segmentation. We further tested our algorithm on 100 business graphics images scanned at a resolution of 600 dpi. Our algorithm was able to detect over 90% of the prominent sweeps in this database. An example is shown in Figs. 5, 6, and 7.
(a)
(d)
(b)
(e)
on a large database will provide us with insights to improve the current algorithm. Although the current algorithm detects only straight-line segments using the Hough transform, it can be easily extended to detect parameterized curves, surfaces, and shapes by using known variants of the Hough methodology.
(a) (b) Fig. 7: Results of our sweep segmentation algorithm on the image shown in Fig. 5. The results before and after the postprocessing stage are shown in (a) and (b), respectively.
(c)
Finally, since the segmentation is done purely based on the color histogram, if a color at one pixel location is classified as belonging to a sweep, then the same color at other pixel locations will also be similarly classified regardless of their spatial surrounds. This can be overcome by combining spatial features with the color features proposed here.
(f)
5. REFERENCES [1] S. V. Revankar, Z. Fan, “Image Segmentation System'”, US patent #5,767,978, 1998. (g) (h) (i) Fig. 6: Intermediate steps of our sweep segmentation algorithm. The images in (a), (b), and (c) show the H_UV, H_LU, and H_LV histograms for the image in Fig. 5 respectively; (d), (e), and (f) show the corresponding edge maps and (g), (h), and (i) show the corresponding detected parallel line segments.
4. CONCLUSIONS AND DISCUSSIONS Our algorithm has over 90% accuracy in detecting sweeps. These preliminary results are very encouraging but more work is necessary to address the shortcomings of the current algorithm. For example, the current algorithm is not able to detect the end points of a sweep very well (see Fig. 6 (h) and (i)) which results in false positives during segmentation. Also, to obtain a pixel-based quantitative performance result of the segmentation algorithm, a database of business graphics with the pixel-based sweep segmentation ground truth is required. We are currently building such a database. We also hope that such a testing
[2] R. Schettini, C. Brambilla, G. Ciocca, M. De Ponti, “Color Image Classification using Tree Classifiers,” Proc. VII Color Imaging Conf., Scottsdale, pp. 269-272, 1999. [3] S. Prabhakar, H. Cheng, J. C. Handley, Y.-W. Lin, “PictureGraphics Color Image Classification”, ICIP 2002, Rochester, NY, submitted. [4] K. M. Braun, R. Balasubramanian, R. Eschbach, “Development and Evaluation of Six Gamut-Mapping Algorithms for Pictorial Images”, Proc. VII Color Imaging Conf., Scottsdale, pp. 144-148, 1999. [5] K. M. Braun, R. Balasubramanian, S. J. Harrington, “Gamutmapping Techniques for Business Graphics”, Proc. VII Color Imaging Conf., Scottsdale, pp. 149-154, 1999. [6] J. Canny, “A Computational Approach to Edge Detection,” IEEE Trans. PAMI, Vol. 8, No. 6, 1986. [7] T. Risse, “Hough Transform for Line Recognition,” Computer Vision & Image Proc., No. 46, pp. 327-345, 1989.
III - 764