A New Method of Color Image Segmentation Based on Intensity and Hue Clustering Chi Zhang and P.Wang, IAPR Fellow College of Computer Science, Northeastern University, Boston, MA02115
[email protected],
[email protected] Abstract
2. HSI Color Representation
A new method of color image segmentation is proposed in this paper. It’s based on K-means algorithm in HSI space and has the advantage over those based on the RGB space. Both the hue and the intensity components are fully utilized. In the process of hue clustering, the special cyclic property of the hue component is taken into consideration. The paper gives the definition of the distance and the center in the hue space, based on which the hue-clustering algorithm is implemented. Utilized in medical image processing, the new method has got a good performance. Keywords: K-means algorithm, Color Segmentation, HSI Color Representation.
Image
In HSI color representation, the I component represents intensity. H component represents hue. S component represents saturation. To convert RGB representation to HSI representation, first compute: [3] 1/ 3 1/ 3 R Y 1 / 3 C1 = 1 − 1 / 2 − 1 / 2 G (1) C 2 0 − 3 / 2 3 / 2 B Then HSI values can be given as:
I = Y , S = C12 + C 22 C1 ≥ 0 Arc cos(C 2 / S ) (2) H = 2 cos( 2 / ) π − Arc C S C1 < 0 One point worth noticing is that the H component is a value of angle and it displays a special cyclic property. C1
1. Introduction Image segmentation is a bottleneck for image processing and computer vision. Most segmentation algorithms only deal with gray scale images.[5] Some segmentation algorithms do deal with color images are based on the RGB color representation.[4] However, RGB representation does not coincide with the vision psychology of human eyes and there is high correlation among its three components, though it’s convenient for display devices. Other color spaces have been considered in the literature.[6] In this paper, we propose a new algorithm segmenting color images in HSI space. HSI color representation is compatible with the vision psychology of human eyes,[3] and its three components are relatively independent. The main thought is applying K-means algorithm[1] on color image segmentation. Both the hue and the intensity components of HSI are utilized. The special cyclic property of the hue component is taken into consideration and the hue-clustering algorithm is designed.
Green
Yellow 1 Red (H1) C2
Blue
Magenta (H2)
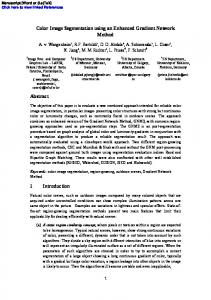
Fig 2.1 Distribution of hue values
As shown in the Fig 2.1, in the C1-C2 two-dimensional space, a point on the unit circle corresponds to one color. Starting from C2 axis and going counterclockwise along the unit circle to another point on the unit circle, the positive angle ( ∈ [0,2π ) ) you experienced is just the hue value of the color. For H1= 0 (red) and H2 = 5 π /3 (Magenta), the difference of hue values are quite large (H2 – H1 = 5 π /3). However, if we start from H1 and go clockwise along the unit circle to H2, the absolute value of the angle experienced (- π /3) is not that large since a shortcut is taken. This example demonstrates the effect of the cyclic property (with a period of 2 π ) of hue component.
And the midpoint HM of the interval is defined as:
3. Clustering in Hue Space The cyclic property of the hue component is the most challenging aspect of color image segmentation based on the HSI space. To study color image segmentation, clustering in hue space must be first studied. In hue space, we should redefine the distance and the center, which are the basis of clustering algorithms. Considering the cyclic property of hue values, the following definition is given: Definition 1: The distance between two H values H1 and H2 is: H 1 − H 2 H1 − H 2 ≤ π d ( H 1, H 2) = (3) H 1− H2 > π 2π − H 1 − H 2 It’s easy to verify that the definition satisfies three axioms of distance. Hue Space is defined as the set of all hue values [0, 2π ) with the above definition of distance. From Fig.2.1, d ( H 1, H 2) is actually the length of the shorter arc between H1 and H2. and 0 ≤ d ( H 1, H 2) ≤ π . Similarly, we can give: Definition 2: The directed distance between two H values H1 and H2 is: H 2 − H1 ≤ π H 2 − H 1 d ( H 1, H 2) = H 2 − H 1 − 2π H 2 − H 1 ≥ π , H 2 ≥ H 1 (4) 2π − ( H 1 − H 2) H 2 − H1 ≥ π , H1 ≥ H 2
d ( H 1, HM ) = d ( HM , H 2), And HM ∈ [ H 1, H 2]
(8)
It’s obvious that (H1 + H2)/ 2 HM = (H1 + H2)/ 2−π (H1 + H2)/ 2+π
(9)
H1 − H2 ≤ π H1 − H2 ≥ π,(H1 + H2)/ 2 ≥ π H1 − H2 ≥ π,(H1 + H2)/ 2 ≤ π
Definition 4: x1, x2, …… xn are n points in the hue space. All the points fall within the interval [H1, H2]. The center point of x1, x2, …… xn are the point in hue space that satisfies: n (10) ∑ d ( Xc, Xi ) = 0 and Xc ∈ [ H 1, H 2] i =1 The second condition in (10) is to prevent the ambiguity of the center point, or to ensure the center point falls within the interval [H1, H2]. Theorem (Euclidean Theory in Hue Space): x1, x2, …… xn are n points in the hue space. All the points are within the interval [H1, H2]. The midpoint of [H1, H2] is HM. The center point of x1, x2, …… xn can be given by the following equation: 1 n XC = H M + (11) ∑ d ( HM , Xi ) ni =1
For example, H 1 = 0, H 2 = 2π / 3, H 3 = 4π / 3 . However under certain restrictions, it can be true:
Equation (11) is well known in Euclidean space. In Euclidean space HM in equation (11) can be substituted by an arbitrary base point, and the proof relies on the vector addition property shown by equation (6). However in the hue space, the correctness of equation (6) is under certain conditions. So the concepts of interval and its midpoint are introduced. The center point should be computed by Equation (11) and the HM in equation (11) can’t be substituted by an arbitrary base point. Applying the new definition of distance and center to the K-means algorithm, we get the clustering algorithm in hue space.
r r Claim 2: If d ( H 1, H 2) + d ( H 2, H 3) ≤ π then r r r d ( H 1, H 3) = d ( H 1, H 2) + d ( H 2, H 3)
4. Color Image Segmentation Based on the HSI Representation
Claim 1:
d ( H 1, H 2) = d ( H 1, H 2)
(5)
Unfortunately, the following vector addition property no longer holds:
r r r d ( H 1, H 3) = d ( H 1, H 2) + d ( H 2, H 3)
(6)
Definition 3: The interval [H1, H2] determined by two hue values H1 and H2 in the hue space is a set of points in the hue space: If H 1 − H 2 ≤ π
[ H 1, H 2] = {H H 1 ≤ H ≤ H 2} if H 1 − H 2 ≥ π
[H1, H2] ={H max(H1, H2) ≤ H ≤ 2π | 2π ≤ H ≤ min(H1, H2)}
(7)
Among the three components of HSI representation, the most important ones are H and I. Good color segmentation algorithms should consider both.[2] In some cases, because of the occlusion and the variation of the projected light intensity, the brightness of the same object surface is not uniform. However, the hue values determined by the reflective property of the object surface are relatively stable.[2] While in some other cases, the color intensities of different objects are more
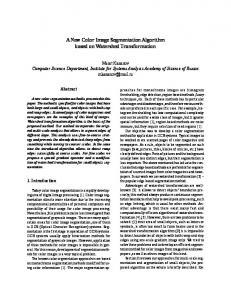
distinguishable among different objects. For an extreme example, if the input is a gray scale image that loses most color information, we must resort to the I component. Fuzzy membership function is used here to combine them. Without loss of generality, suppose the number of classes in the images is 2 (object and background). Since components of HSI representation are relatively independent, hue image and intensity image can be treated separately before they are combined together. First compute the histogram of I component. Apply K-means clustering algorithm, obtain the centers of two classes Ic1 and Ic2, and give the fuzzy membership functions of two classes accordingly (Fig 4.1).
µ Ic1
µ Ic 2
I
I
IC1
I C2
Fig 4.1 Member functions for intensity Each pixel’s grades of membership for each class can be given:
µIc1 I (x, y ) µIc 2 I ( x, y )
where I(x,y) is the I component of the pixel at (x,y). Usually these two values add up to 1. Then compute the histogram of the H component. Apply K-means clustering algorithm in the hue space established in chapter 3. Obtain the center points of two classes Hc1 and Hc2, and give the fuzzy membership functions of two classes accordingly (fig 4.2). µHc1
µ Hc 2
H
H
2π
HC1
H C2
2π
Fig 4.2 Member functions for hue As can be seen, the cyclic property of the hue component has been taken into consideration. Hence each pixel’s grades of membership for each class can be given:
µHc1 H ( x, y ) µHc 2 H ( x, y )
µIc1 I (x, y )
and
µHc1 H ( x, y )
c = (µIc1 L( x, y ), µHc1 H ( x, y ) )
are
(14)
Apply K-means clustering algorithm on the above feature vector. We get the final result of color image segmentation.
5. Experiments We test our color image segmentation algorithms in a Medical Image Processing System, a knowledge-based system processing medical slide images. One module of the system is to extract bone areas from noisy and varied color slide images. Color image segmentation is a critical step within this module. The segmentation task is challenging because the color distribution varies from image to image, due to the change of reagent. Fig. 5.1 and Fig. 5.2 (attached to the end of the paper) give two experiment results. Fig.5.1 (a) is the original color image. Fig 5.1 (b) is the image of I component, while Fig 5.1 (c) is the image of H component. It’s not difficult to observe that in the Intensity image bone areas are much clearer than that in the Hue image. Fig 5.1(d) shows the result of segmentation based on Hue image and Fig 5.1(e) shows the result of segmentation based on Hue and Intensity images. Both (d) and (e) are after some sort of knowledge-based post-processing. Fig 5.2 demonstrates a quite different example. Fig.5.2 (a) is the original color image. Fig 5.2 (b) is the image of I component, while Fig 5.2 (c) is the image of H component. It’s easy to see that in the Intensity image, gray levels of pixels in bone areas (except on the boundary) are quite close to those in the background area. On the other hand, in the Hue image, pixels in bone areas are much more distinguishable. Fig 5.2(d) shows the result of segmentation based on Intensity image and Fig 5.2(e) shows the result of segmentation based on Hue and Intensity images. Both (d) and (e) are after some sort of knowledge-based post-processing. As we can see, segmentation in terms of only one component might easily fail due to the variation of color distribution. Our algorithm, which combines both aspects, is quite robust.
6. References 1.
where H(x,y) is the H component of the pixel at (x,y). Usually these two values add up to 1. Thus, for each pixel in the image we have four grades of membership. Since the first two add up to 1 and the last two add up to 1,
chosen to represent the overall color feature of the pixel, without loss of generality. Combine these two grades of membership to form a two-dimensional feature vector:
2.
Sing-Tze Bow, Pattern Recognition, Marcel Dekker Inc., 1984. (Chapter 1, 5). K.P.Valavanis, J.Zhang and G.Paschos, A Total Color Difference Measure for Segmentation in Color Images, Journal of Intelligent and Robotic Systems, vol. 16, pp269-313, 1996
3.
4.
Thierry Carron, Patrick Lambert, Color Edge Detector Using Jointly Hue, Saturation and Intensity, International Conference on Image Processing ’ 94, pp977-981. A.Moghaddamzadeh and N.Bourbakis, A Fuzzy Region Growing Approach for Segmentation of Color Images, Pattern Recognition, vol. 30, No. 6, pp867- 881,1997.
(a) Original color image
5.
6.
N.R.Pal and S.K.Pal, A review on Image Segmentation Techniques, Pattern Recognition, vol. 26, No. 9, pp1277-1294,1993. Uchiyama, T., and Arbib, M.A., Color Image Segmentation Using Competitive Learning, PAMI vol. 16, No. 12, pp. 1197-1206, 1994.
(b) Intensity image
(d) Segmentation by hue
(c) Hue image
(e) Segmentation by hue and intensity
Fig 5.1 Color image segmentation – example 1
(a) Original color image
(b) Intensity image
(d) Segmentation by intensity
(c) Hue image
(e) Segmentation by hue and intensity
Fig 5.2 Color image segmentation – example 2