Determining Reactive Power Requirements in the Southern Part of the Entergy System for Improving Voltage Security – A Case Study V.S. Kolluri, Senior Member, IEEE, and S. Mandal, Member, IEEE
Abstract—A major load center in Entergy system showed fast voltage collapse under certain contingency conditions. Detailed studies were performed to find the right mix of static and dynamic reactive power support devices to solve the problem. This paper presents the process that was followed in studying the problem, criteria applied for fixing the problem and shows the results with solutions implemented. Based on these studies a Static VAr Compensator and several capacitor banks were installed in the area of interest. Index Terms--Voltage Collapse, Voltage Stability, Reactive Power, P-V Analysis, Static VAr Compensator (SVC), Capacitor banks, Static and Dynamic VArs
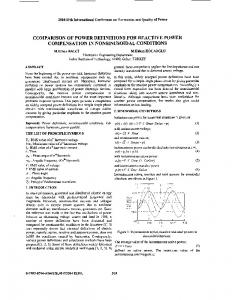
I. INTRODUCTION The Entergy System is an Investor Owned Electric Utility providing power to major portions of the states of Arkansas, Louisiana, almost half of Mississippi and a small portion of Texas. One of the major load centers within the Southern Part of Entergy System is the Downstream of Gypsy (DSG) area. This area consists of Entergy’s transmission system south of Lake Pontchartrain and extends eastward and down stream of the Mississippi River, encompassing all substations in the metropolitan New Orleans area. The one line diagram of the DSG area is shown in Figure 1.
Fig. 1: One line diagram of the DSG area Venkat S. Kolluri is with Entergy Services, Inc., New Orleans, LA 70113, USA (e-mail:
[email protected]). Sujit Mandal is with Entergy Services, Inc., New Orleans, LA 70113, USA (e-mail:
[email protected]).
142440178X/06/$20.00 ©2006 IEEE
There are five 230kV transmission lines connecting the DSG area with the rest of the Entergy System. The primary transmission source from the west is the Waterford–Ninemile 230kV line. Three other 230kV lines from the west are the Gypsy to South Norco, Gypsy to University City, and Gypsy to Pontchartrain lines. There are two primary sources of generation internal to the DSG area at Ninemile and Michoud. The Ninemile station includes three 115kV generators and two 230kV generators, totaling approximately 1,700 MW. The Michoud station includes two 115kV generators and one 230kV generator, totaling approximately 800 MW. Due to high load and limited generation in the area, a Reliability Must Run (RMR) requirement is in place for all the eight generating units at Ninemile and Michoud plants to run during high loading conditions, which typically occurs from June through August. The reason for this generation reliability must-run requirement is to avoid overloads on the transmission sources and prevent depressed voltages between Ninemile and Michoud. Because of high gas prices and reliability issues associated with some of the existing units, decision was made to operate the region with only five out of eight units at Ninemile and Michoud plants (three out of five 115kV units and two out of three 230kV generating units). Preliminary, studies indicated that operating under such a dispatch can result in transmission line overloads and severe low voltage problems in the area as the power has to be imported from the generation resources located away from the area. A four-phase transmission improvement plan was put into place to address these issues. As part of the Phase I plan it was recommended to install two 86 MVAr capacitor banks at Michoud 230kV station and one 151 MVAr bank at Ninemile 230kV station in order to provide reactive power support. These shunt capacitor banks were placed into service in June 2004. In order to address the new RMR requirements for the DSG area, comprehensive loadflow and stability studies were performed. As a result of this study, static and dynamic voltage problems in the area were identified and reactive power requirements for the area were determined. The recommendation from the study was to install a 300 MVAr
119
PSCE 2006
Static VAr Compensator at the Ninemile 230kV switchyard and approximately 400 MVAr of shunt capacitor banks at several 115kV and 230kV stations in the DSG area, by year 2007[1]. In this paper, the process followed to determine the static and dynamic reactive power requirements for the area is discussed and optimal sizing and location of the static and dynamic devices is addressed. Section II describes the study methodology, criteria applied and load modeling issues. Section III discusses the problem under study and the results, Section IV covers the sensitivity analysis results and Section V provides summary of the paper. II. STUDY METHODOLOGY The voltage stability assessment was carried out using both steady state and dynamic analyses. As part of the steady state assessment, loadflow studies to alleviate the thermal problems and PV analysis for determining the load serving capability of the region and establishing voltage stability margins, were performed. This was followed with dynamic analysis to study fast voltage collapse, perform load sensitivity, compare alternative solutions and size the dynamic compensation. NERC criterion of multiple contingencies was applied to the load pockets for identifying problems[2]. Contingencies were restricted to N-1-1, a unit and a line out condition, since such a combination has a higher probability of occurrence, than that of losing two transmission lines. In addition to steady state and dynamic analysis, Optimal Power Flow (OPF) and Extended Term Stability Studies were performed. The purpose of using the OPF program was to determine optimal size and location of the reactive power support and the intent of the extended term dynamics program was to get insight into the extended–term dynamics behavior of the system. A. System Performance Criteria In order to compare various alternative solutions a standard set of performance criteria was established. This dynamic performance criterion was based on the Western Electricity Coordinating Council (WECC) reliability criteria [3]. This criterion considered three main factors: (a) Voltage Dip, (b) Duration of the voltage dip, and (c) Post Transient Voltage recovery level. The voltage dip criteria required that the voltage at any load bus should not dip below 30% for more than 20 cycles. If the voltage at trip motor terminals fell below 0.7 pu continuously for 20 cycles the motor would trip offline. For post transient voltage level criteria, the buses with voltages below 0.92 pu at the end of dynamic simulation were flagged. The primary objective of the dynamic study was to come up with a solution which would minimize number of motors tripping and lead to acceptable post recovery voltage levels within certain time period. B. Load Models For dynamic voltage stability assessment a detailed load model is necessary to capture the load dynamics, e.g. impact of induction motors under low voltage conditions[4]. For
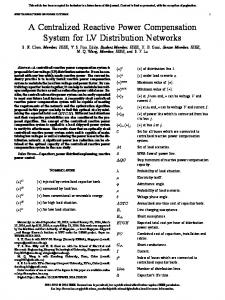
study purposes the loads were modeled at the distribution level in the region of interest. These loads were represented as 50% induction motor and 50% static load. The induction motor was further separated into two classes: (1) Low inertia such as pumps, (2) High inertia such as fans. A portion of the low inertia motor loads was modeled with the option of tripping under low voltage conditions. The load model used for the dynamic studies is shown in Figure 2. The load outside the area of study was modeled at transmission level. The purpose of modeling static load at the distribution level was to represent non motor loads such as lighting, electronic and computer equipment, and self restoring loads. Based on extensive research and literature survey, the static load composition for DSG area was determined to be 25% as constant impedance, 15% as constant current and 10% as constant power. Detailed
Non-Detailed
230/115 kV 230/115 kV
120 MW @ 0.92 pf
13.8 kV
ZIP load
Large motor
Small motor
Power Factor adjustment capacitor
120 MW @ 0.92 pf
Fig. 2: Detailed load modeling at the distribution level
III. PROBLEM DESCRIPTION AND PRELIMINARY STUDY RESULTS
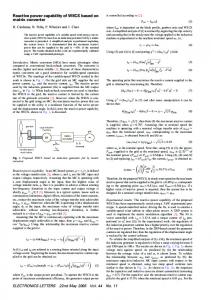
The steady state and dynamic analyses were performed on the 2007 summer peak model. The projected peak load for the DSG area in the model was 3800 MW. Initially a detailed steady state N-1 screening analysis was performed to identify thermal and voltage problems. The system was found to adequately handle single system outages. Subsequently, multiple contingencies were evaluated. The multiple contingencies were mainly limited to N-1-1, a unit and line outage condition. Based on the dynamic performance criteria, several critical contingencies were identified and one of the most severe contingency is as follows: - Tripping of the Ninemile Unit 5 followed by fault at 230kV Ninemile bus and the tripping of the Waterford to Ninemile 230kV line. The PV curve for the DSG area under the most severe contingency is shown in Figure 3. Based on the PV Curve it is determined that the maximum load that can be served in the area is 3750 MW under the worst contingency condition and with 5% percent margin this load serving capability reduces to 3560 MW approximately. The steady state analysis was followed by dynamic analysis. The results for the worst
120
case dynamic scenario are plotted in Figure 4. This plot shows voltage at a critical station as a function of time. From the plot it can be observed that voltage recovery is very slow and the voltages are settling down to extreme low levels. This is in violation of the criteria adopted for the study. Additionally, the plots for generator reactive power indicates that Michoud unit is giving out close to 750 MVAr of reactive power, which puts the unit in the over excitation state. In the simulations maximum excitation limiters (MXLs) are not modeled. Immediately, after the voltage recovery the generator reactive power settles down to 450 MVAr which is found to be over the maximum reactive power capability (Qmax of 370 MVAr) of the unit. From these results, it is concluded that there is a deficiency of dynamic reactive power in the region for the fault under study and if appropriate actions are not taken the region could be subjected to voltage instability. Since the system voltages stayed at levels below 0.8 pu for several seconds there is a concern that the induction motors will tend to slow down and aggravate the situation and as a result a fast voltage collapse could occur in the region[5,6]. Without Waterford - 9Mile 230kV line 3of5 & Michoud unit 3 PV curves cc 1.05
1
Vo lt ag e (p .u .)
Berman 230kV Market 230kV
0.95
Tricou 230kV Almonaster 230kV PARIS 230kV Gretna 115kV
0.9
Delta 115kV 9mile 230kV
0.85
0.8 3300
3350
3400
3450
3500
3550
3600
3650
3700
3750
3800
Load in DSG (MW)
Fig. 3: PV curve for DSG area with the most severe contingency
dynamics model and run the transient stability simulation for several seconds. Both voltages at critical stations and reactive power output of the critical units are monitored in these cases. The plot for the most severe contingency case is shown in Figure 4. From this plot it is observed that after the fault is cleared and the bus voltages settle down to a steady value, the units are giving out excessive reactive power, much higher than their stipulated capability. Monitoring the reactive power output of the unit gives a good indication of reactive power shortage in the region. In the DSG area it is found, that approximately 700 MVAr of reactive compensation is required to bring the units to below their maximum capability (Qmax). An alternative approach that can be used to determine the total reactive power requirements is to plot QV curves. The following step in the process is to find the proportion of static and dynamic reactive power requirements and location and sizing of these devices. The criterion used for determining dynamic reactive power requirements is that the voltages at the critical stations should recover to 0.9 pu within less than 1.5 to 2 seconds after the fault is cleared. For determining the steady state requirements the criterion was used that the voltages at critical stations should recover close to 1 pu when the system dynamics have settled down. The dynamic devices in the range of 200 – 400 MVAr were evaluated in the study. Several factors were considered to find the best location of the SVC, such as, the physical size, location and short circuit strength of the stations. Iterative studies were done to find the location which will meet the criteria with the minimum size of the dynamic device. From the studies it was determined that a 300 MVAr device at Ninemile station, which is one of the strongest stations in the DSG area, will be the most appropriate solution. After the size of the dynamic device is determined, the next step is to size and locate the remaining 400 MVAr of static shunt devices. The options available are to locate the shunt devices on the transmission system as well as the distribution system, or both. In this case the decision was made to locate the static devices on the transmission side, i.e. 230kV, 115kV stations. The Optimal Power Flow (OPF) program was used to come up with the size and location of static shunt compensation. TABLE 1: ADDITIONAL CAPACITOR BANK LIST
Fig. 4: Stability simulation results for the most severe contingency
The next step in the study is to determine the total reactive power requirements to address the voltage stability problem. In order to determine the total reactive power requirements, the approach used is to simulate critical contingencies in the
121
Location
kV
Destrehan Behrman Waggaman Poydras Paterson Snakefarm Napoleon Kenner
230 230 230 115 115 230 230 230
Capacitor size (MVAr) 64.8 86.4 64.8 21.6 43.2 64.8 64.8 64.8
A set of OPF objective functions were set and the case was then solved for the most severe contingency and the various OPF objectives. In general, for all of the contingencies, OPF chose to place the shunts at Derbigny, Chalmette, Behrman and Snakefarm stations. Based on the OPF recommendations and taking into consideration several factors the size and location of the shunt capacitor banks for the DSG area were finalized. The size and location of these shunt capacitor banks are shown in Table 1. IV. VERIFICATION OF REACTIVE POWER REQUIREMENTS Once the preliminary reactive power requirements for the area were determined, the next step was to verify and finalize these requirements. This was done using Mid Term stability simulations. The system performance with a 300 MVAR dynamic device, such as a SVC, and additional capacitor banks is shown in Figure 5. The plot shows that voltage recovery is in conformance with the criteria and that the selected solutions will minimize load loss and prevent voltage collapse in the region for the fault scenario under consideration. The behavior of the SVC during the simulation is shown in Figure 6. It can be seen that the SVC responds very fast to the disturbance and injects the full capacity into the system until the voltage reaches acceptable level.
2.
Overexcitation limiter models were modeled at the major generating units in the area of interest.
With the above changes applied to the case, a ten-minute mid-term time-domain simulation was performed for the case of a 3-phase fault at Ninemile, followed by the loss of Ninemile unit #5 and the Ninemile to Waterford 230kV line. The plots for this simulation are shown in Figure 7. As shown, the system is stable and well behaved. The mid-term dynamic simulation shows that the system is stable with the additional VAr compensation and at the end of the simulation there is still a healthy amount of VAr reserve in nearby generators and the SVC.
Fig. 6: SVC response during the contingency under study
Fig. 5: Stability simulation results for the most severe contingency with the SVC and the additional capacitor banks
As a final verification check on the proposed solution, a mid-term time-domain simulation was performed for the critical outage of the loss of Ninemile unit #5 and the Waterford – Ninemile 230 kV line, following a bolted 3phase fault at Ninemile. In order to perform a mid-term simulation, a number of modifications were made to the case: 1. Dynamic models for on-load tap-changers (OLTCs) where added to all distribution substation transformers in the DSG area
Fig. 7: Results of mid-term time domain simulation for the most severe contingency with the SVC and capacitor banks
V. SUMMARY This paper discusses the process followed for determining static and dynamic power requirements in the Down Stream of Gypsy Area of the Entergy System. Along with load flow and dynamic analysis software, OPF program was applied to determine the optimal size and location of the reactive power compensation. As a final verification, the mid-term time
122
domain simulations were run to confirm the proposed solution. Based on this study it was recommended to install a 300 MVAr Static VAr Compensator at Nine Mile 230kV station to provide dynamic support an approximately, 400 MVAr of shunt capacitor banks at 230kV and 115kV level. VI. ACKNOWLEDGEMENT The authors gratefully acknowledge the contributions of Pouyan Pourbeik and Don Martin of the ABB Consulting Group for providing support on the study. VII. REFERENCES [1]
[2] [3] [4]
[5] [6]
Venkat S Kolluri, “Application of Static VAr Compensator in Entergy System to address Voltage Stability Issues – Planning and Design Considerations,” 2006 IEEE PES T&D Conference, Dallas, TX, May, 2006 NERC Reliability Criteria Document, TPL-003-0 WSCC Reliability Criteria Document “Standard Load Models for Power Flow and Dynamic Performance Simulation”, (94 SM 579-3 PWRS. IEEE Transactions of Power Systems, Vol. 10, No. 3, August 1995 P. Kundur, Power System Stability and Control, McGraw –Hill Inc, 1994 C.W.Taylor, Power System Voltage Stability, McGraw-Hill Inc, 1992
VIII. BIOGRAPHIES Sharma Kolluri (SM’ 86) received his BSEE degree from Vikram University, India in 1973, MSEE from West Virginia University, Morgantown in 1978 and MBA from University of Dayton in 1984. He worked for AEP Service Corporation in Columbus, Ohio from 1977 through 1984 in Bulk Transmission Planning Group. In 1984 he joined Entergy Services Inc, where he is currently the Supervisor of Technical Studies Group. He is involved in several IEEE committees and working groups and is a member of CIGRE. Sharma’s areas of interest are Power System Planning and Operations, Stability, Reactive Power Planning and Reliability of Power Systems. Sujit Mandal (S’97, M’99) received the B.Tech. degree in Electrical Engineering from the Indian Institute of Technology (IIT), Kanpur, India and the M.S. degree in Electrical Engineering from Kansas State University, Manhattan, KS in 1997 and 1999, respectively. He worked as a consultant at Power Technologies, Inc., Schenectady, NY, from 1999 to 2000. Presently, he is with Technical System Planning, Entergy Services, Inc., New Orleans, LA.
123