Development of a neural network model to predict distortion during the metal forming process by line heating Desarrollo de un modelo de red neuronal para la predicción de distorsión durante el proceso de formado metálico utilizando líneas de calentamiento
César Pinzón 1 Carlos Plazaola 2 Ilka Banfield 3 Amaly Fong 4 Adán Vega 5
Abstract In order to achieve automation of the plate forming process by line heating, it is necessary to know in advance the deformation to be obtained under specific heating conditions. Currently, different methods exist to predict deformation, but these are limited to specific applications and most of them depend on the computational capacity so that only simple structures can be analyzed. In this paper, a neural network model that can accurately predict distortions produced during the plate forming process by line heating, for a wide range of initial conditions including large structures, is presented. Results were compared with data existing in the literature showing excellent performance. Excellent results were obtained for those cases out of the range of the training data. Key words: network model, plate forming, distortion prediction, line heating, back propagation
Resumen Con el fin de lograr la automatización del proceso de formado metálico por medio de líneas de calentamiento, es necesario conocer de antemano la deformación que se obtendrá bajo condiciones de calentamiento específicos. En la actualidad, hay diferentes métodos para predecir la deformación, pero, éstos se limitan a aplicaciones específicas, y la mayoría de ellos dependen de la capacidad computacional existente, de modo que sólo estructuras simples pueden ser analizadas. En este artículo, un modelo de red neuronal que puede predecir con precisión las distorsiones producidas durante el proceso de formado de placas curvas mediante líneas de calentamiento, para una amplia gama de condiciones iniciales, incluyendo estructuras de gran tamaño es presentado. Los resultados del modelo de red neuronal fueron compararon con datos existentes en la literatura y estos muestran una excelente precisión. Para aquellos casos que están fuera del rango de datos de entrenamiento de la red también se obtuvieron excelentes resultados. Palabras claves:
Date Received: December 2nd, 2010 - Fecha de recepción: 2 de Diciembre de 2010 Date Accepted: March 6th, 2012 - Fecha de aceptación: 6 de Marzo de 2012
Specialized Research Center for Manufacturing and Joining Processes (LEPUM) – School of Mechanical Engineering – Technological University of Panama. e-mail:
[email protected] 2 Member of the National Researcher Systems (SNI) – SENACYT, Panama. e-mail:
[email protected] 1
Ship Science & Technology - Vol. 6 - n.° 12 - (41-49) January 2013 - Cartagena (Colombia)
41
Pinzón, Plazaola, Banfield, Fong, Vega
Introduction The process of forming three-dimensional surfaces via line heating has been used for several decades in shipbuilding. The procedure is performed manually and it is considered one of the most difficult to understand techniques. Thus, it becomes difficult for shipyards to maintain a sufficient number of technicians, who are able to do this work without many complications [1]. This leads us to conclude that it is necessary to automate the system in order to restore the small number of skilled workers. To achieve this goal, many investigation projects have been carried out. They can be divided into three main groups: those seeking to understand the situation [2, 3, and 4], those wishing to develop automatic machines that can bend a plate [5 and 6], and finally those seeking to understand the relationship between heating conditions and the deformation to be obtained [7 and 8]. The last group being the most difficult task found until now.
network, the prediction of deformation produced during the process of metal forming by line heating is achieved with considerable accuracy, for heat conditions and sizes of plates that have not been possible to achieve with traditional methods of prediction distortions.
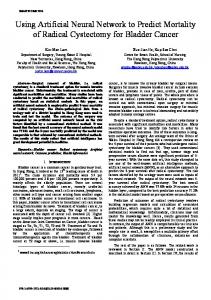
Analysis of the distortion due to heating lines The process of plate forming by line heating can be seen as a method of forming a flat plate into a three-dimensional object, with a desired shape, by using the angular shrinkage and distortion produced by plastic stress, induced by heating and subsequent cooling [1]. The deformation is largely dependent on the heat input, the speed of the heat source and the plate thickness. According to [2], heat-induced deformation can be represented by four main components of inherent distortion, as shown in Fig. 1, and expressed by Equations 1 to 4 as follows;
(1)
Predicting the distortion produced by heating a plate is confusing because it is influenced by many factors like the amount of heat, speed of the heat source, thickness of the plate and by secondary factors like the cooling method, the initial deformation of the plate, residual stresses, cooling method, etc., [9 and 10]. Given the complexity of the problem, it requires using mathematical tools that involve all these variables when analyzing the problem; being the finite element method (FEM), through a threedimensional thermal-elastic-plastic analysis, the method offering the best performance [11]. On the other hand, FEM is limited to analyzing small plates without complex heating patterns. This is far from the reality of shipbuilding where large and complex geometries must be developed. With the purpose of contributing to the solution of this problem, the authors propose a neural network model trained by using data obtained from FEM studies and validated experimentally. In this neural
42
(2) (3) (4) Where δx is the longitudinal inherent shrinkage, δy is the transverse inherent shrinkage, θx is the longitudinal inherent bending, and θy is the transverse inherent bending. εx* and εy* are the components of the inherent strain. The xy plane is in the direction of the heating line, and the zy plane is transverse to the heating line, h is the plate thickness. These relationships can be used to predict deformation with remarkably good results, but it is demonstrated that the deformation given by Equations 1 to 4 are affected by other factors, so they are not as effective when the process is complex [4].
Ship Science & Technology - Vol. 6 - n.° 12 - (41-49) January 2013 - Cartagena (Colombia)
Development of a neural network model to predict distortion during the metal forming process by line heating
An outstanding characteristic of neural networks is their ability to generalize to future data. To achieve maximum development of this characteristic, the network needs to be trained by using as many details as possible so that it can find the characteristics that distinguish the behavior of the data. To enhance the model of interest, we first specified the information that we would use as training for the network. To do this, we used results published in [3]. In that work, the relationships described in Equations 1 to 4, for thick plates, for a wide range of heating conditions are plotted. Figs. 2 to 5 show a summary of the data. As seen in the figures, the relationship between inherent deformation and applied heat can be described by mathematical relationships. However, for conditions of heating out of the range used in that study, there is no reference in the present literature. To obtain the largest possible number of data from the figures, information points, from each graph, are extracted. Then, regression, to achieve smooth behavior of the data while understanding the deformation behavior, for a given applied heating requirement, is performed.
In addition to the information mentioned above, the relation between heating condition and rate of the heating source for independent plate thicknesses, as shown in Fig. 6 [3], was incorporated, in the analysis. Based on the heating equation (Equation 5) [8], we can obtain the current and voltage, required to generate the heating conditions. Here, it is necessary to mention that the plate surface temperature is 800 °C, which is the recommended temperature to achieve plate forming by line heating.
(5) Fig 2. Relationship between transversal shrinkage and heat input 0,04 Transverse Shrinkage (mm)
Extraction of data for the development of the neural network model
Experiments Regression
0,03
0,02
0,01
0,00
0
3
6
9
12
15
18
21
3
Heat Input (KJ/mm )
Fig 1. Components of Inherent Deformation produced by line heating
Fig 3. Relationship between longitudinal shrinkage and heat input
Transverse shrinkage
x
x y
0,009
0,006
Experiments Regression
0,003
z
z
0,000 y
Transverse bending
Transverse Shrinkage (mm)
Longitudinal bending
Longitudinal shrinkage
0,012
0
3
6
9
12
15
18
21
3
Heat Input (KJ/mm )
Ship Science & Technology - Vol. 6 - n.° 12 - (41-49) January 2013 - Cartagena (Colombia)
43
Pinzón, Plazaola, Banfield, Fong, Vega
To support the network with the largest training data, we evaluated Equation 5 for different ranges of voltage, current, speed of the heating source, plate thickness and heat input as follows:
Fig 4. Relationship between transversal bending and heat input
Transverse Bending (rad)
0,036
Voltage: V = 30 to 45 Volts Current: I = 300 to 1200 Amps Speed: s = 1 to 11 mm / sec Plate thickness: h = 10 to 50 mm Heat Input: Q = 1 to 20 KJ / mm
0,027
0,018 Experiments Regression
0,009
0,000 0
3
6
9
12
15
18
21
Table 1. Model of individual cases used as input of the network
3
Heat Input (KJ/mm )
Fig 5. Relationship between longitudinal bending and heat input
Transverse Bending (rad)
0,0028
Experiments Regression
0,0021
0
3
6
9
12
15
18
21
Heat Input (KJ/mm 3 )
Fig 6. Relationship between speed of the heating source and heat input for different plate thickness 12 Plate Thikness 50 mm 40 mm 30 mm 20 mm
10 Speed (mm/sec)
Case #2
Case #3
Voltage [Volts]
40
40
40
Current [Amp]
1255.37
1012.96
919.74
Speed [mm/seg]
11.01
9.97
7.92
Thickness [mm]
50
50
50
1.36
1.21
1.39
δy/h [mm]
0.00125
0.00106
0.00128
δx/h [mm]
0.00103
0.00088
0.00105
θy [rad]
0.00463
0.00267
0.00493
θ x[rad]
0.00270
0.00275
0.00269
Deformation
0,0007
8 6 4 2 0
Case #1
Q/h^2
0,0014
0
Heating Condition
3
6
9
12
15
18
21
After evaluating Equation 5 for each variable, more than 700 different points were achieved. The data was arranged in individual cases, where for each heating condition the four components of inherent deformation (described in Equations 1 to 4) were obtained, as shown as an example in Table 1. Note that "case" refers to the vector of values used as input of the neural network; more precisely, we refer to the heating condition used to prepare the network. The four components of deformation are called the vector “target”. These four components are the known response extracted from Figs. 1 to 5, also associated to the heating conditions.
3
Heat Input (KJ/mm )
44
Ship Science & Technology - Vol. 6 - n.° 12 - (41-49) January 2013 - Cartagena (Colombia)
Development of a neural network model to predict distortion during the metal forming process by line heating
Neural network model to predict the distortion due to heating lines
the smallest amount of hidden neurons permits the best performance closest to the known response.
After gathering the information we want to emulate, we continue developing the neural network, to accurately replicate the information. To develop the network, we must first create architecture (layers, neurons, and training functions) that derives the characteristic patterns of the training data, thus, ensuring that the network has the best performance.
The mean square error (MSE) is a standard that provides details of the error of the output response generated by the neural network with respect to the desired output response. The MSE is defined as:
Network architecture
Where hci is the desired response from the network (targets), hi is the neural network response (output), and m is the number of data analyzed. This rule becomes necessary because it evaluates the accuracy of the results, as the fixed weights, at each step of the iteration, during the learning process [13].
A multilayer network, from a host of others, was chosen because we wanted the network to get the best generalizations of the results. The training algorithm used is the back-propagation model [12], given its good performance in predicting nonlinear functions. Number of layers One of the common uses of neural network is to approximate functions or specific patterns. However, a single layer may not be sufficient to represent a function because the behavior may not be fully captured. In the case of the network to predict the distortion, to avoid any possible lack of accuracy, three layers were used. Number of Neurons The hidden neurons play a vital role in the operation of a neural network given that they work as feature detectors. Once the learning process begins, the hidden neurons gradually begin to recognize outstanding features presented by the training data. It should be noted that using few neurons may cause poor fit, while the opposite may result in a tight network. These characteristics are undesirable because they reduce the generalization ability of the network, yielding incorrect results and increasing error in the results. To determine the optimal number of neurons, it is necessary to establish a criterion in assessing where
(6)
Fig. 7 shows that by increasing the number of neurons, MSE varies and, therefore, the neural network error. Network Training Process The standard back-propagation algorithm was used in developing the network for distortion prediction. This is an algorithm of descent gradient in which the network weights moves along the negative value of the gradient of the function of execution. The training of neural networks can be more effective if certain processes are performed on the input and output data. The processes performed on the input data improve the way the network reads the input information. Before training the network, inputs and outputs are scaled to keep them within a range: from -1 to 1. Thus, the activation functions of the neurons are automatically sensitized, obtaining a better performance of the network. Generalization of the neural network One of the largest features that occur during the development of neural networks seeks to know how good the response of the network will be for inputs to which the network has not been trained. Some techniques exist in the literature commonly
Ship Science & Technology - Vol. 6 - n.° 12 - (41-49) January 2013 - Cartagena (Colombia)
45
Pinzón, Plazaola, Banfield, Fong, Vega
Fig 7. Relationship between the number of neurons and the MSE
MSE
used to improve the generalization of a neural network, these are: early detection (crossvalidation), removing the weights, and inclusion of noise to the data during training [14]. In this article, we used the cross-validation technique [15] to generalize the network because it resulted as the most appropriate after several trials. In the cross-validation used to determine the generalized network data correctly, we divided the training data into three subsets: a training subset, a validation subset, and a testing subset, which was the one selected for this network.
Results
1,2x10
-6
1,0x10
-6
8,0x10
-7
6,0x10
-7
4,0x10
-7
2,0x10
-7
46
22
23
24
Table 2. Examples of networks presenting the best performances
Network
To evaluate the network that best fits the data, 20 different neural networks were developed. By varying the number of layers and neurons of each one, the best one was chosen after comparing the performance of each.
MSE Validation
Correlation
15-4
1.28E-8
0.9765
20-4
9.14E-9
0.9820
8-6-4
5.32E-10
0.9949
10-8-4
2.17E-9
0.9925
12-8-4
2.74E-10
0.9999
12-8-6-4
7.67E-10
0.9994
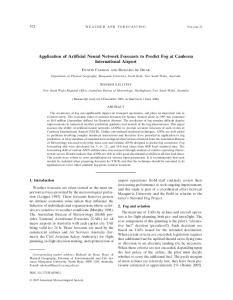
Fig 8. Validation test of 12-8-4 network
Mean Square Error (MSE)
The 12-8-4 network has a total of three layers. The first layer has 12 neurons, the second eight and the third (the output layer) has four neurons. Furthermore, the cross-validation test also analyzed the network response to the training data. Figs. 9, 10, 11, and 12 show the network response; these figures show the correlation between the training data (from the literature) and the network response
21
Number of neurons
Using as the selection criterion the cross-validation techniques, we selected the neural network from a number of possible networks. Then, by using the MSE, we computed the error of the entries that have not been seen by the neural network; thereby, the network selected is the one that presents the lowest validation error.
Table 2 shows the most significant networks obtained and how using MSE selection criterion, we selected the 12-8-4 network. Fig. 8 shows the results of the validation test of the 12-8-4 network. The figure displays the three subsets used for testing. One can see that beyond 469 days, both the test error and the validation error tend to increase, while the training error decreases as the ages pass. Each network has its characteristic curve, which served as a basis for selecting the network.
20
10
-4
10
-6
10
-8
Train Validation Test Best
-10
10
0
50 100 150 200 250 300 350 400 450 500
Ship Science & Technology - Vol. 6 - n.° 12 - (41-49) January 2013 - Cartagena (Colombia)
Epochs
Development of a neural network model to predict distortion during the metal forming process by line heating
after the network training. It seems that the values calculated by the network are close to the training values, so we can say that the network has precisely calculated the deformation. Fig 9. Comparison between the network response and the training data for Transverse Inherent Shrinkage
Fig 11. Comparison between the network response and the training data for Transverse Inherent Bending
Network response Training data
0,06
0,036
0,04
0,02
0,00 0
5
10
15
20
25
30
Transverse bending (rad)
Transverse shrinkage (mm)
0,08
between the inherent deformation of the study and the network response is shown in Table 4. By comparing results, we concluded that the error is negligible; given that these are cases for which the network had never been trained, the accuracy of the network could be considered as sufficiently good.
0,027
0,018
Network response Training data
0,009
Heat Input (KJ/mm 3 ) 0,000 0
Fig 10. Comparison between the network response and the training data for Longitudinal Inherent Shrinkage
5
10
15
20
25
30
3
Heat Input (KJ/mm )
Fig 12. Comparison between the network response and the training data for Longitudinal Inherent Bending
0,009
0,0028 0,006 Network response Training data
0,003
0,000 0
5
10
15
20
25
30
3
Heat Input (KJ/mm )
Longitudinal bending (rad)
Longitudinal shrinkage (mm)
0,012
Network response Training data
0,0021
0,0014
0,0007
0,0000
Validation of the results
0
After obtaining the deformation components by using the neural network, we should confirm the accuracy of the network for arbitrary data, those which the network has never learned (generalization). For that, the network was trained using additional cases obtained from the study presented in [8] (Table 3). The percentage of error
5
10
15
20
25
30
3
Heat Input (KJ/mm )
Conclusions In this paper, we propose using neural networks to predict distortions induced by heating during
Ship Science & Technology - Vol. 6 - n.° 12 - (41-49) January 2013 - Cartagena (Colombia)
47
Pinzón, Plazaola, Banfield, Fong, Vega
the line heating process. The following are the conclusions from this study: • A tool that allows accurately predicting the distortion generated in a plate due to line heating was developed based on a neural network model. • The results demonstrate that the network has good performance not only for the range of training data, but also for data that have not been learned before. • Using three layers results in a good approximation of the deformation produced by heating. • The neural network herein developed may also offer good response in case of other thermal processes given that the input used is independent of the process. • Using neural networks is an effective alternative in predicting distortions induced by heating during plate forming by line heating.
Table 3. Heating condition and values of inherent Deformation used as references [8]
Heating Condition
Case #1
Case #2
Voltage
33
37
Current
800
500
Speed
2.50
1.50
50
40
3.17
5.78
Transverse Shrinkage
0.0037
0.0076
Longitudinal Shrinkage
0.0028
0.0052
Transverse Bending
0.0152
0.0271
Longitudinal Bending
0.0020
0.0010
Thickness Heat Input Inherent Deformation
Table 4. Comparison between the network response and the results shows in [8].
δy
δx
θy
Data from [3]
0.0037
0.0028
0.0152
0.002
Network Response
0.0037
0.0028
0.0152
0.002
% Error
0.1039
0.0173
0.3535
0.0698
δy
δx
θy
θx
Data from [3]
0.0076
0.0052
0.0271
0.001
Network Response
0.0076
0.0052
0.0269
0.001
% Error
0.0324
0.0462
0.7693
0.1533
Case #1
Case #2
θx
Acknowledgments
References
The authors wish to thank to the National Secretary of Science and Technology of Panama (SENACYT) and Class IBS for all their support during this research project.
1. CHANG, C.W.; LIU, C.S. AND CHANG, J.R. (2005): A Group Preserving Scheme for Inverse Heat Conduction Problems. CMES: Computer Modeling in Engineering & Sciences, 10, 1, pp.13-38.
48
Ship Science & Technology - Vol. 6 - n.° 12 - (41-49) January 2013 - Cartagena (Colombia)
Development of a neural network model to predict distortion during the metal forming process by line heating
2. CHENG, P.; YAO, Y. L.; LIU, C.; PRATT, D.; FAN, Y. (2005): Analysis and Prediction of Size Effect on Laser Forming of Sheet Metal. Journal of Manufacturing Process, SME Vol. 7/No.1; 28-40. 3. VEGA, A. (2009): Development of Inherent Deformation Database for Automatic Forming of Thick Steel Plates by Line Heating Considering Complex Heating Patterns. Doctoral Thesis. Osaka University, Japan, 2009. 4. LIU, C.S. (2006): An Efficient Simultaneous Estimation of Temperature-Dependent Thermophysical Properties. CMES: Computer Modeling in Engineering & Sciences, 14, 2, pp.77-90. 5. MOSHAIOV, A. AND LATORRE, R. (1985): Temperature Distribution during Plate Bending by Torch Flame Heating. Journal of Ship Research, 29, 1, pp.1-11. 6. LIU, C.S. (2006): An Efficient Simultaneous Estimation of Temperature-Dependent Thermophysical Properties. CMES: Computer Modeling in Engineering & Sciences, 14, 2, pp.77-90. 7. C. D. JANG, J. S. KIM AND Y. S. HA AND Y. H LEE (2005). Prediction of Plate Deformation Considering Film Boiling in Water Cooling Process after Line Heating. ISOPE’2005, pages 191-197. 8. OSAWA, N.; HASHIMOTO, K.; SAWAMURA, J.; KIKUCHI, J.; DEGUCHI, Y. AND YAMAURA, T. (2007): Development of Heat Input Estimation Technique for Simulation of Shell Forming by Line-Heating.
CMES: Computer Modeling in Engineering & Sciences, 20, 1, pp.45-53. 9. TANGO, Y, ISHIYAMA, M, NAGAHARA, S, NAGASHIMA, T, AND KOBAYASHI, J, (2003). "Automated Line Heating for Plate Forming by IHI-ALPHA System and its Application to Construction of Actual VesselsSystem Outline and Application Record to date," Journal of the Society of Naval Architects of Japan. Vol. 193. pp. 85-95. 10. TERASAKI, T.; KITAMURA, N. AND NAKAI, M. (1999): Predictive Equation for Thermal Cycle Generated by Line Heating Method. Trans. The West-Japan Soc. Naval Architects, 99, pp.321-329 (in Japanese). 11. VEGA, A., RASHED, S., TANGO, Y., ISHIYAMA, M., MURAKAWA, H. (2008): Analysis and prediction of multi-heating lines effect on plate forming by line heating. CMES Journal: Computer Modeling in Engineering & Sciences, CMES, Vol. 28, No. 1, pp. 1-14, 2008. 12. JAIN A., MAO J., MOHIUDDIN A. (1996), “Artificial Neural Networks: A tutorial”, IEEE Computer Society. 1996. 13. GURVEY K. (1997), “An introduction to Neural Networks”. UCI Press Limited, 1997. 14. HAGAN M., BEALE M., DEMUTH H. (1996), “Neural Network Design”. PWS Publishing Company, Boston, MA, 1996. 15. FAUSETT L. (1994), “Fundamentals of neural networks, architectures, algorithms and applications”. Englegood Cliff. NJ; Prentice – Hall. 1994.
Ship Science & Technology - Vol. 6 - n.° 12 - (41-49) January 2013 - Cartagena (Colombia)
49