10% or more of a C4-derived sugar can sometimes be added to a juice before it ..... the invert syrup addition was detectable, in this case at the 2% level (Figure ...
DAY ET AL.: JOURNAL OF AOAC INTERNATIONAL VOL. 84, NO. 3, 2001 957 SPECIAL GUEST EDITOR SECTION
13
C-IRIS: An Improved Method To Detect the Addition of Low Levels of C4-Derived Sugars to Juices MARTIN P. DAY, PATRICIA CORREIA, and DAVID A. HAMMOND Reading Scientific Services Ltd, The Lord Zuckerman Research Centre, The University, Whiteknights, Reading, RG6 6LA, UK
A method to improve the detection of cane or corn sugar addition to fruit juices has been developed. This involves the isolation of the individual sugars and measurement of their carbon isotope ratios. Using the Isotopic Relations of Individual Sugars approach, the additions of cane sucrose or cane invert as low as 4% of the total sugars can be detected in orange juice. This method offers a significant improvement over the conventional carbon isotopic method that has a detection limit of about 10%.
he adulteration of fruit juices has been a problem since they were produced commercially in the 1950s and is likely to remain one while the price of sugar is significantly cheaper than fruit juice solids. Although most juice producers are honest, there will always be a few who will extend their products with sugars and second extracts of fruit to maximize their profits. As the analytical tools have been improved to detect juice adulteration, so have the approaches used by unscrupulous suppliers to circumvent testing methods. The earliest methods were dependent on parameters such as potassium, phosphorous, and the formol value (an indication of the total level of amino acids in a sample). However, these were soon circumvented, by unscrupulous suppliers, by adding potassium and ammonium phosphates and/or glycine. This led to the more extensive analysis of juices using such approaches as the RSK profile, which included sugars, organic acids, and free amino acids. However, it was not too long, late 1980s, before ways were found to circumvent this type of approach also. Since the early 1980s, carbon isotope ratio analysis has been used as an approach to detect the addition of cane or corn sugars to juices. Fully validated methods for apple and orange juices were published in the 14th Ed. of the AOAC collection of analytical methods (1). The carbon isotope approach relies on the fact that most fruit juices, with the exception of pineapple juice, contain less of the heavy 13C isotope than seen in cane or corn sugars. However, due to the wide natural range seen in the carbon isotope ratios of fruit sugars, up to 5 permil (‰) in apple, 10% or more of a C4-derived sugar can sometimes be added to a juice before it can be judged as adulterated.
T
Guest edited as a special report on “Food Authenticity” by Carla Barry.
Attempts have been made to improve the sensitivity of the carbon isotope ratio method by various means. One approach published by Parker (2) used the pulp of cloudy juices, such as orange, as an internal reference to limit the allowable spread in the carbon isotope values seen in the sugars. This type of approach was later extended by Bricout and Koziet (3) and Schmidt et al. (4). This internal referencing approach is not dissimilar to the method that is routinely used to control the authenticity of honey, where the values for the carbon isotope ratios in the sugar and protein fractions are used to improve the isotopic method’s sensitivity (5). The pulp method was an improvement over the standard approach, but it was thought that it could be improved by using the soluble materials which might be used to specifically adulterate a juice. More recently, work by a group in France has shown that the individual acids found in pineapple juices can be used to detect the addition of low levels of C3-derived acids to the juice and/or to improve the detection level for added sugars (6). In the 13C-Isotope Relations of Individual Sugars (IRIS) approach, the carbon isotope ratios seen in individual sugars, citric acid, and pectin were examined in a range of juices to improve the sensitivity of the isotopic technique and allow smaller additions of cane and/or corn sugars to be detected (7). Experimental
Juice Samples The juice samples selected for this project were from 3 sources. The first set were single-strength juices pressed from fruit in our laboratory. The fruit were from known origins and harvest seasons and these juices were authentic. The fruits originated from Israel, Italy, Morocco, and South Africa. The second set of samples were concentrates provided by the United Kingdom’s Ministry of Agriculture, Fisheries and Food (MAFF). These samples, collected by MAFF staff during official visits to various processing factories around the world, came from Brazil, Cuba, Israel, and Morocco. The final set of samples were concentrates provided by the Schutzgemeinschaft der Fruchsaft-Industrie (SGF) of Nieder-Olm, Germany, from their reference collection, and they came from Brazil, Argentina, Florida, Israel, and Italy. Given their provenance, the authenticity of the concentrates was considered to be beyond reproach.
958 DAY ET AL.: JOURNAL OF AOAC INTERNATIONAL VOL. 84, NO. 3, 2001 Table 1. Carbon isotopic variations seen in the sugars and citric acid before and after passage through Dowex and Bio-Rex resins Fraction
Initial value
After Dowex
After Dowex and Bio-Rex
Sucrose
–11.2‰
–11.2‰
–11.3‰
Glucose
–10.3‰
–10.3‰
–10.5‰
Fructose
–9.7‰
–9.8‰
–9.9‰
Citric acid
–22.7‰
–22.7‰
–22.5‰
Sugar Isolation Juice concentrates were diluted to single strength in liquid chromatography (LC) grade water. Single strength juices and reconstituted concentrates were subjected to a slow speed centrifugation to remove any pulp using a Sorvall T 6000 bench top centrifuge (1000 × g for 10 min; Dupont; Bishop’s Stortford, Hertfordshire, UK). An aliquot (20 mL) of the supernatant was then passed through a glass column packed with Dowex resin 50 W2-200 (4 g; Aldrich Chemical Co., Gillingham, Dorset, UK), to separate any amino acids and metal ions, and the neutral and acidic components were flushed off the column with LC water (25 mL). The pH of the eluate was adjusted to between 8 and 9 with analytical reagent (AR) grade concentrated ammonia solution (0.880M; BDH, Lutterworth, Leicestershire, UK) and this solution was then passed down a glass column packed with Bio-Rex (4 g; Bio-Rad, Hennel Hempstead, Hertfordshire, UK.) The neutral sugars were eluted off the column with water (20 mL). The acids could be eluted from the column, if required, by the addition of sulfuric acid (10% v/v, 4 mL; BDH) followed by additional water (20 mL). The sugars were separated on a 30 cm × 8 mm resin-based column (monosaccharide H+; Phenomenex; Macclesfield, Cheshire, UK) using LC grade water as the eluent at a flow rate of 0.6 mL/min. A Gilson LC system (Anachem, Luton, Bedfordshire, UK) with a 203 intelligent fraction collector and a Waters chromatography 401 differential refractive index detector (Watford, Hertfordshire, UK) were used to perform the separation. The individual peaks were detected by the software. This triggered the fraction collector after allowing a constant time delay, thus allowing the solvent to pass between the detector and the collection head.
When apple juices were studied, the monosaccharide column was replaced by a calcium-loaded variant, such as the Bio-Rad HPX 87C. This allowed the complete separation of fructose and sorbitol, which were only poorly resolved on the acid form of the column. After collection of the individual sugar fractions, these were freeze dried to concentrate the extract.
Isolation of Acidic Materials The acidic components were analyzed by ion separation on the same column as used above, but dilute sulfuric acid (4mM; BDH) was used as an eluent and a Gilson 117 UV detector was used instead of the refractive index detector. Once the acid fractions were collected, they were neutralized with ammonia. This limited the degradation of the acids which would have occurred, if they had not been neutralized, by gradual concentration of the sulfuric acid during freeze drying.
Pectin Isolation Isolation of the pectin from citrus juices was achieved using the IFU method for pectin, test method No. 26 (8). An aliquot of the juice was mixed with ethanol (95%; BDH) in the proportions 3 parts to 7. The precipitated pectin was then washed 3 times with ethanol–water (7 + 3) before final addition of water and freeze drying.
Carbon Isotopic Analysis The sugars and acids were redissolved in LC water and aliquots were pipetted in triplicate into tin capsules. The water was removed by heating the capsules in a dry block heater before analysis by continuous flow–elemental analysis–isotope ratio mass spectrometry (CF–EA–IRMS), using a Europa Scientific (Sandbach, Cheshire, UK) ANAC-GSL module linked
Table 2. Carbon isotopic variations seen in the sugars and acids before and after isolation by HPLC Fraction
Before separation
Front of peak
Back of peak
Sucrose
–11.0 ± 0.2‰
–11.1 ± 0.2‰
–11.3 ± 0.1‰
Glucose
–10.1 ± 0.1‰
–10.0 ± 0.2‰
–10.7 ± 0.2‰
Fructose
–9.6 ± 0.1‰
–10.2 ± 0.1‰
–9.7 ± 0.2‰
Citric acid
–27.9 ± 0.2‰
–28.6 ± 0.4‰
–26.7 ± 0.3‰
Malic acid
–22.8 ± 0.1‰
–24.2 ± 0.5‰
–21.5 ± 1.1‰
DAY ET AL.: JOURNAL OF AOAC INTERNATIONAL VOL. 84, NO. 3, 2001 959 Table 3. Repeatability and internal reproducibility data for 13C-IRIS procedure Repeatability standard deviation, Sr
Fraction
Repeatability limit, r
Internal reproducibility standard deviation, SR
Internal reproducibility limit, R
Sucrose
0.01‰
0.03%
0.16‰
0.45%
Glucose
0.04‰
0.11%
0.18‰
0.50%
Fructose
0.06‰
0.17%
0.20‰
0.56%
to a 20/20 mass spectrometer. The combustion furnace on the elemental analyzer was set at 1000°C and the reduction furnace was set at 600°C. Helium was used for the continuous flow measurement at a flow rate of 60 mL/min. The isolated pectin materials were weighed directly into tin capsules before analysis by isotope ratio analysis. The conditions were identical to the ones given above. Results and Discussion As with any method which involves isotopic analysis, the whole separation process had to be assessed to ensure that there was no isotopic fractionation of the components during their isolation. This was achieved by using pure sucrose, glucose, fructose, and citric acid. Solutions of these components were separately passed through the Dowex and the Bio-Rex columns and collected. These solutions were then analyzed by CF–EA–IRMS. The data from this analysis showed that there was no appreciable fractionation of the sugars or citric acid during the separation of the components using either of these 2 resins (Table 1). Gensler and Schmidt (9) suggested that there could be a significant level of isotopic fractionation during LC analysis using ion exchange resin columns. To determine if this was
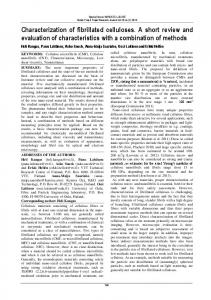
Figure 1.
13
likely to be a problem with the system adopted for this work, solutions containing a mixture of sucrose, glucose, and fructose and one with citric and malic acids, of known isotopic ratios, were prepared. The isolation of the individual components from the 2 solutions was performed using the conditions which would be used in the subsequent analyses. However, in this case, the individual components were each collected as 2 fractions, one from the front of the peak and the other from the rear. From the data, it was clear that for sucrose there was little if any fractionation as the front and the back of the peak showed similar isotope ratios (Table 2). Whereas with glucose, fructose, citric and malic acids, there were significant differences in the ratios seen in the front and back portions of the peaks (Table 2). However, it was found that provided the majority of the peak was collected (greater than 95%), the LC separation system did not cause any significant isotopic fractionation. The final stages in the validation of the method were to establish the typical repeatability and internal reproducibility criteria which would be expected. To achieve this, 6 aliquots of an orange juice sample were taken through the whole 13 C-IRIS isolation process and subjected to CF–EA–IRMS analysis. From this data, the repeatability standard deviation (Sr) and the repeatability limit (r) were calculated and are
C-IRIS plot of glucose vs sucrose for orange reference data and authentic concentrates.
C sucrose
960 DAY ET AL.: JOURNAL OF AOAC INTERNATIONAL VOL. 84, NO. 3, 2001
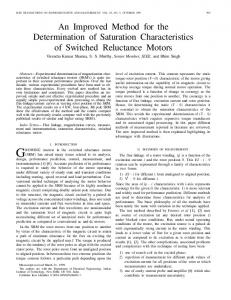
d13C glucose Figure 2.
13
C-IRIS plot of glucose vs sucrose for orange and grapefruit reference data.
lations between each of the individual sugars—sucrose, glucose, and fructose. However, when the correlations between the sugars and citric acid or pectin were examined, it was clear that these correlations were not as strong. In fact, there was a rather wide spread in the carbon isotopic data for the individual sugars when compared with those for pectin or citric acid isolated from the same juice. These data suggested that the latter 2 components might not improve the method sensitivity due to their wider spread of values (data not presented here). Also, changes to the EU additives regulations—which allowed the addition of citric acid to juice—might limit the usefulness of developing relationships between the sugars and
d13C sucrose
given in Table 3. The repeatability limit was found to be very good, at less than 0.2‰ for the 3 sugars. Finally, the internal reproducibility was measured from 39 batches of the in-house quality control sample over a 10 month period. The internal reproducibility standard deviation (SR) was found to be around 0.2‰ and the internal reproducibility limit (R) was less than 0.6‰ for the 3 sugars, which meant that the method performance was good enough to be used. For the procedure to improve the sensitivity of the carbon isotope method for detecting addition of cane or corn sugars, there would have to be a strong correlation between the components. The studies showed that there were very strong corre-
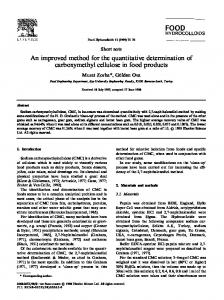
d13C glucose Figure 3.
13
C-IRIS plot of glucose vs sucrose for apple juice reference data.
d13C sucrose
DAY ET AL.: JOURNAL OF AOAC INTERNATIONAL VOL. 84, NO. 3, 2001 961
d13C glucose Figure 4. 13C-IRIS plot showing the effect of the adulteration of a sample with various levels of cane sucrose, quoted as % of the total sugars.
citric acid. For these reasons, work did not concentrate on the sugar/acid or sugar/pectin relationships, but instead looked more closely at the individual sugars. As part of any study investigating a new technique, the quality of the samples chosen to establish the usefulness of the procedure is of paramount importance. The juice samples selected for this project were authentic, as discussed above, and came from the major processing countries. They were selected from the 1991 to 1997 processing seasons and represented 82 genuine juices, which were used to develop the regression parameters. If the *13C values for sucrose were plotted against glucose for this reference collection, there was a strong correlation. The correlation coefficient for this regression was 0.82, which was very high for a natural product and meant that these sugars could be used to detect the addition of cane and corn sugars. The dotted lines, which embrace all data points, were the 99% confidence limits for the regression (Figure 1). Plotted on this figure are the values for 24 other commercial concentrates, from various origins, which had been judged to be authentic by a range of other analytical methods. It was clear that all these data also fit within the regression confidence limits and that the established correlation was independent of the origin of the juice. Although juices from all these regions fit within the regression lines, some origins tended to be located at one end rather than the other. This was not unexpected, as juices from South America were known to have lower *13C values than juices from the Mediterranean region. Twenty Seven grapefruit juices were also examined using this process, and they generally followed the same regression line as the orange juices. Although their data generally fit the same regression that was seen for orange juices, the values
were generally depleted relative to orange juices, as expected. Their spread was also a little wider than the one for orange juices (Figure 2). Analysis of 17 apple juices from a range of origins again showed a strong correlation between the isotope ratios seen for the individual sugars. However, in this case, although the slope of the regressions between the sugars was similar to that seen for the citrus juice, the apple juice data were offset by about 1‰ relative to the citrus juices (Figure 3). One striking observation that came out of this research was that although the 3 sugars were in equilibrium in the plant, they did not show the same carbon isotope ratios. Although it is well known that metabolites from a plant can have different isotopic values, as the sugars were close to each other in the biosynthetic pathway, it was not expected that the deviations between the individual sugars would be so large. Similar deviations were seen for the 5 types of juices examined: orange, apple, grapefruit, mandarin, and pineapple. In the case of orange, sucrose was found to be enriched in the heavy isotope when compared with glucose by about 1.5 to 2‰, and about 3‰ compared with fructose. It is also worth noting that the carbon isotopic values seen for citric acid and pectin isolated from oranges, are similar to those for sucrose from that fruit rather than the other 2 sugars. The sugars isolated from grapefruits, mandarins, and apples showed a similar deviation between their sucrose and glucose values. In apples, the values for glucose and fructose were found to be much closer. In studies on pineapple juices, Gonzalez et al. (10) found that the *13C values for the sugars showed smaller deviations between sucrose, glucose, and fructose than reported here for citrus and apple juices. In their
d13C sucrose
962 DAY ET AL.: JOURNAL OF AOAC INTERNATIONAL VOL. 84, NO. 3, 2001
d13C glucose Figure 5. 13C-IRIS plot showing the effect of adulteration of a sample with various levels of cane invert syrup, quoted as % of total sugars.
work, sucrose was typically enriched by about 0.7‰ relative to glucose and 1.3‰ compared with fructose. Due to these strong correlations between the isotope ratios seen for the sugars, it has been possible to use these internal ratios to detect cane/corn adulterations. If a juice is adulterated with sugars derived from either cane or corn, this will distort the carbon isotope ratio seen in this/these sugars and so the sample would lie outside the normal range, if the addition is large enough. If cane sucrose is added to a juice the sucrose value will be enhanced—made less negative—while the glucose value remains unchanged. This is illustrated with an example where different levels of cane sucrose were added to an authentic juice, which originally sat just below the mean line of the regression. The sample adulterated with about 4% cane sucrose fell just inside the normal range expected for an orange juice (Figure 4). However, when cane invert was added to this sample, the shift this time was detected in the glucose and fructose values and so the sample effectively moved to the right. As the original juice sat below the regression’s mean, the detection of the invert syrup addition was detectable, in this case at the 2% level (Figure 5). The way that the 13C-IRIS procedure enhances the sensitivity of the isotopic method is 2-fold. Firstly, as the sugars naturally fall within a certain range of each other, analysis of one sugar defines the normal range within which another sugar’s carbon isotope ratio should fall. Secondly, instead of the adulterant’s effect causing a general shift in the overall carbon isotope ratio found for the whole juice or in the total sugar fraction, it is only seen in an individual sugar. As the individual sugars are separated, if only sucrose is added to a juice, this material will only be seen in the sucrose fraction. This effectively increases its relative concentration when compared with
the “juice” sucrose. Thus, if a single strength orange juice, for instance, is extended 10% with a sucrose solution containing 100 g/L, this represents a 10% extension of the juice. However, this actually represents about a 20% addition of C4 sucrose relative to the original juice sucrose. This is because sucrose makes up about 50% of the soluble solids in an orange juice. This is illustrated below with a worked example. Let’s assume that the sugar concentrations in the starting juice were: sucrose 40 g/L, glucose and fructose 20 g/L. If 9 parts of this juice were extended with 1 part of a solution containing 10% sucrose, this would represent the addition of 10 g/L sucrose and a dilution of the other sugars by 10%. In the final adulterated juice, the amount of sucrose derived from cane as a percentage of the total sucrose would be: C4 sucrose as % of total sucrose =
10 × 100 = 217 . % 40 × 0.9 + 10
Similar calculations can be undertaken for the addition of a cane invert or a high fructose corn syrup and these show a similar enhancement in the method’s sensitivity. Conclusions As the methods used to adulterate juices become more sophisticated, so must the methods that analysts use to detect them. The new approach discussed above draws on the internal relationships seen for sugars in citrus fruit and apples to enhance the sensitivity of the carbon isotopic method. If the adulterant is located in one or 2 components rather than being distributed either over the whole of the soluble solids in a juice or the sugar fraction, this enhances the sensitivity of the approach. This enhancement is about a factor of 2 for the addition of cane sucrose or cane invert to orange juice, which
DAY ET AL.: JOURNAL OF AOAC INTERNATIONAL VOL. 84, NO. 3, 2001 963
means that an adulteration in the region of 5% of the total sugars maybe detected with ease in most cases. Acknowledgments We thank the United Kingdom’s Ministry of Agriculture, Fisheries and Food for their financial support to perform this research. We are also indebted to the Schutzgemeinschaft der Fruchsaft-Industrie, Germany, for supplying some of the authentic concentrates. References (1) AOAC (1984) Handbook of Official Analytical Methods, 14th Ed., AOAC, Washington, DC, pp 427–428 (2) Parker, P.L. (1982) Fluss. Obst. 49, 672, 692–694
(3) Bricout, J., & Koziet, J. (1997) J. Agric Food Chem. 35, 758–760 (4) Schmidt, H.-L., Butzenlechner, M., Rossman, A., Schartz, S., Kexel, H., & Kempe, K. (1993) Z. Lebensm. Unters Forsch. 196, 105–110 (5) White, J.W., & Winters, K. (1989) J. Assoc. Off. Anal. Chem. 72, 907–911 (6) Martin, G.G., Jamin, E., Gonzalez, J., Remaud, G., Hanote, V., Stober, P., & Naulet, N. (1997) Fruit Processing 9, 344–349 (7) Hammond, D.A., Day, M.P., Correia, P., & Evans, R. (1998) Fruit Processing 3, 86–90 (8) Anonymous (1996) Isolation and quantification of pectin and pectin fractions from juices, Method No. 26. In: The International Federation of Fruit Juice Producers Analytical Handbook, Swiss Fruit Union, Zug, Switzerland (9) Gensler, M., & Schmidt, H.-L. (1994) Anal. Chim. Acta 299, 231–237 (10) Gonzalez, J., Remaud, G., Jamin, E., Naulet, N., & Martin, G.G. (1999) J. Agric. Food Chem. 47, 2316–2321