5.7 Appendix: Using R for Sampling Distributions by EV Nordheim, MK Clayton &
BS Yandell, October 23, 2003. In Section 5.3 on the Central Limit Theorem, we ...
5.7 Appendix: Using R for Sampling Distributions by EV Nordheim, MK Clayton & BS Yandell, October 23, 2003 In Section 5.3 on the Central Limit Theorem, we presented a computer simulation to illustrate the CLT. Computer simulation is a very useful tool in statistics; its importance continues to grow as the computer opens up more approaches for describing and analyzing data. Roughly speaking, computer simulation is important in statistics in two ways. The first is to demonstrate results like the CLT. The second is to describe, through simulation, distributions that cannot be described explicitly by formulas. (This includes methods like the bootstrap and Markov chain Monte Carlo simulation.) In this volume we will restrict attention to the demonstration aspect of computer simulation. The third subsection of this Appendix shows how to compute probabilities for the distribution of the sample variance for normal data. This is similar in spirit to the Appendix of Chapter 4.
5.7.1 Simulations using a Discrete Distribution ¯ = σ 2 /n. Consider a Let us first consider a simulation example that illustrates Var(X) discrete random variable with probability function given by the following. x 1 3 5
p(x) 0.6 0.3 0.1
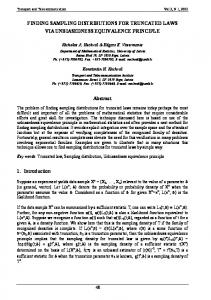
By using the methods from Sections 3.6 and 3.7, we find that E(X) = 2.0 and Var(X) = 1.8. Now let us use simulation to generate 500 values from this distribution. The commands to perform this simulation are given below. The sample command instructs R to generate 500 random values and place them in the draws. The first argument is the possible x values, while the prob argument specifies their probabilities. The replace argument is set to TRUE as we want to sample with replacement. > x = c(1, 3, 5) > px = c(0.6, 0.3, 0.1) > draws = sample(x, size = 500, replace = TRUE, prob = px) Here is a histogram of the 500 values in object draws. (The argument breaks is used to allow easy comparison of the 3 histograms we present in this section based on this discrete distribution.) > hist(draws, breaks = seq(1, 5, by = 0.25), main = "1000 discrete draws")
1
150 0
50
Frequency
250
1000 discrete draws
1
2
3
4
5
draws
From the probability distribution we would expect 60% of the observations to have value “1”, 30% to have value “3” and 10% to have value “5.” Thus, we would expect 300, 150, and 50 observations for each of these three numbers. Our simulated histogram is close to this although the lowest category (which represents the “1’s”) and the highest category have somewhat fewer observations than expected whereas the middle category has somewhat more than expected. If we were to simulate another 500 observations, the number of observations in each category would be somewhat different although the general shape of the histogram would be the same. Although we know by construction that the variance of this distribution is 1.8, we can find the variance of the 500 simulated observations by having R compute the variance. > var(draws) [1] 1.691238 Thus, the variance of the 500 simulated observations is 1.691, close to the theoretical value. Let us now use simulation to generate 500 simulated values of x¯ where x¯ is the mean of 4 observations from the same discrete distribution. It is straightforward to perform the simulation using the following commands. > draws = sample(x, size = 4 * 500, replace = TRUE, prob = px) > draws = matrix(draws, 4) > drawmeans = apply(draws, 2, mean) The commands in the first and second lines generate an object named draws with 4 rows of numbers each with 500 values from the discrete distribution used above. (In total we have 2
generated 4*500 = 2000 observations. Notice that we wrote over the original draws to save space.) The 500 values are in columns numbered from 1 to 500. Think of each column as having 4 observations from the distribution. The command in the third line applies the mean command to every column, using the (apply command. The 500 values of the mean are now in object drawmeans. Here is the histogram of these 500 simulated values of x¯. > hist(drawmeans, breaks = seq(1, 5, by = 0.25), main = "1000 means of 4 draws")
100 60 0 20
Frequency
1000 means of 4 draws
1
2
3
4
5
drawmeans
We can see that the variance is visibly smaller. By using the var command we find that the variance of these 500 means is 0.48. This is fairly close to the value of 0.45 that we would ¯ = σ 2 /4 = 1.8/4 = 0.45. expect: Var(X) Let us now simulate 500 values of x¯ where x¯ is now the mean of 16 observations. We present a condensed set of R commands to generate the means in object drawmeans and then display the histogram. For reasons of efficiency, we > drawmeans = apply(matrix(sample(x, size = 16 * 500, replace = TRUE, + prob = px), 16), 2, mean) > hist(drawmeans, breaks = seq(1, 5, by = 0.25), main = "1000 means of 16 draws")
3
100 50 0
Frequency
150
1000 means of 16 draws
1
2
3
4
5
drawmeans
The distribution of these 500 values of x¯ indicates a much reduced variance. The (theoretical) ¯ is Var(X) ¯ = σ 2 /16 = 1.8/16 = 0.1125. For the particular simulation performed variance of X (the values in drawmeans), the observed variance is 0.108, again fairly close to the theoretical value. Thus, we have used the simulation capabilities of R to demonstrate visually (from the histograms) and numerically (from the realized variances) the impact of the sample size, ¯ n, on Var(X). We can also see an illustration of the Central Limit Theorem in the last histogram. With x¯ values computed from the mean of 16 observations from a particular discrete distribution, the distribution of these sample means shown in the histogram looks approximately like a normal distribution. In Section 5.3 we displayed a histogram of 2000 values of x¯ from another discrete distribution. This was done using the same procedure we used here. Of course the particular discrete distribution must be entered into R as the necessary first step. It is sometimes difficult to know how many values to generate is a simulation study. In our example in this section we used 500; in Section 5.3 we used 2000. A simulation itself is random, and the number of simulations done helps to control that randomness. Having said that, the number of simulations depends on the purposes of the simulation. We will not explore this issue further, except to note that, for a simulation used for demonstration purposes, 500 to 2000 is a reasonable range for the number of values. When simulation is used directly for inference, other considerations may dictate the need for a different number (usually larger).
4
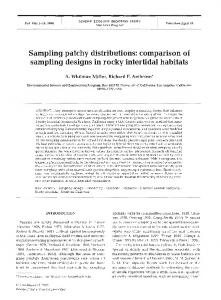
5.7.2 Simulations using a Continuous Distribution Here is another example of simulation for demonstration purposes. We will simulate values of V 2 corresponding to S 2 , the sample variance from normal data. Assume that the underlying distribution X is distributed as X ∼ N (0, 9) and suppose that the sample size, n, is 6. The sequence of R commands for generating 1000 values from V 2 with 5 degrees of freedom is as follows. > draws = matrix(rnorm(1000 * 6, 0, 3), 6) > drawvar = apply(draws, 2, var) The commands in the first 2 lines generate an object named draws with 6 rows and 1000 columns of normal observations where the normal observation has mean 0 and standard deviation 3. ( Recall that rnorm requires the standard deviation, not the variance.) The third line applies the var command to each column using the apply command to create the 1000 values of S 2 . We now present the histogram for these 1000 values of V 2 = (n − 1)S 2 /σ 2 . > > > >
draws = 5 * drawvar/9 hist(draws, breaks = 20, prob = TRUE, main = "standard distribution for sample varian v = seq(0, max(draws), length = 200) lines(v, dchisq(v, 5), lty = 2, lwd = 2)
0.10 0.05 0.00
Density
0.15
standard distribution for sample variance
0
5
10
15
20
25
draws
Not surprisingly, the shape of this simulated distribution is very close to the shape of the theoretical distribution for χ25 shown in the figure in Section 5.5 and overlaid as a dashed lines here by the last two command lines.
5
5.7.3 Computing Probabilities for the Variance in R In the Appendix to Chapter 4, we showed how to compute probabilities for the mean of a normal distribution. Here we show similar calculations for the distribution of the sampling variance for normal data. Consider again the pine seedlings, where we had a sample of 18 having a population mean of 30 cm and a population variance of 90 cm2 . What is the probability that S 2 will be less than 160? > > > >
n = 18 pop.var = 90 value = 160 pchisq((n - 1) * value/pop.var, n - 1)
[1] 0.9752137 Notice where the sample size (n = 18), population variance (pop.var = 90) and value of interest (value = 160) appear in the pchisq command. The p-value of 0.975 agrees with the p-value shown in Section 5.5. As with other probability commands, the upper tail could have been calculated using the option lower.tail=FALSE. Now consider the fruit company problem with weight of apple sauce in grams having distribution X ∼ N (275, 0.0016). Here we want to take a random sample of 9 jars and find the s2 so that P (S 2 ≤ s2 ) = 0.99. The following R command does this: > > > >
pop.var = 0.0016 n = 9 prob = 0.99 pop.var * qchisq(prob, n - 1)/(n - 1)
[1] 0.004018047 Again notice where the sample size (n = 9), probability level (prob = 0.99) and population variance (pop.var = 0.0016) appear in the calculation. [Why do the variance and sample size appear outside of the command qchisq?] The value 0.004 agrees with earlier calculations in Section 5.5. Remember that probability calculations for the sample variance rely heavily on the assumption of normality. If the data distribution is not normal, then these probabilities may be way off.
6