A machine learning framework of functional biomarker discovery for different microbial communities based on metagenomic data Wei Fang1,2, Xingzhi Chang2, Xiaoquan Su2, Jian Xu2, Deli Zhang1,* and Kang Ning2,* 1
Investigation Group of Molecular Virology, Immunology, Oncology & Systems Biology, Center for Bioinformatics, College of Life Science, and Research Laboratory of Virology, Immunology & Bioinformatics, Department of Preventive Veterinary Medicine, College of Veterinary Medicine,Northwest A & F University, Yangling 712100, Xi’an City, Shaanxi, P.R. China 2 Qingdao Institute of Bioenergy and Bioprocess Technology, Chinese Academy of Sciences, Qingdao, Shandong, P.R. China *Contact:
[email protected],
[email protected] cultivation process non-applicable. Analysis of their metagenomic data is the direct and efficient way to analyze all microbes in the community[2]. The metagenomic approach has made it possible better understanding of microbial diversity as well as their functions. And the broad applications of metagenomic research, including environmental sciences, bioenergy research and human health, have made it an increasingly popular research area. Faced with the rapidly increasing number of metagenomic samples, it is now very important to easily distinguish these samples, for multiple purpose including quick environment test, medical diagnosis, etc. As such, assignments of biomarkers, especially functional biomarkers, for different microbial communities become an increasing critical issue.
Abstract—As more than 90% of microbial community could not be isolated and cultivated, the metagenomic methods have been commonly used to analyze the microbial community as a whole. With the fast acumination of metagenomic samples, it is now intriguing to find simple biomarkers, especially functional biomarkers, which could distinguish different metagenomic samples. Next-generation sequencing techniques have enabled the detection of very accurate gene-presence (abundance) values in metagenomic studies. And the presence/absence or different abundance values for a set of genes could be used as appropriate biomarker for identification of the corresponding microbial community’s phenotype. However, it is not yet clear how to select such a set of genes (features), and how accurate would it be for such a set of selected genes on prediction of microbial community’s phenotype. In this study, we have evaluated different machine learning methods, including feature selection methods and classification methods, for selection of biomarkers that could distinguish different samples. Then we proposed a machine learning framework, which could discover biomarkers for different microbial communities from the mining of metagenomic data. Given a set of features (genes) and their presence values in multiple samples, we first selected discriminative features as candidate by feature selection, and then selected the feature sets with low error rate and classification accuracies as biomarkers by classification method. We have selected whole genome sequencing data from simulation, public domain and in-house metagenomic data generation facilities. We tested the framework on prediction and evaluation of the biomarkers. Results have shown that the framework could select functional biomarkers with very high accuracy. Therefore, this framework would be a suitable tool to discover functional biomarkers to distinguish different microbial communities. Keywords-metagenomic, ReliefF, mRMR
I.
biomarker,
machine
Currently, there are several metagenomic biomarker projects been conducted, namely Metastats[3] and LEfSe[4], etc. These methods are based on statistical analysis methods, so they require a relatively large number of samples to discover biomarkers. For example, for LEfSe, when few samples are available, Wilcoxon test is performed based only on the median values of the samples. As previous studies on gene expression analysis have already provided us with a set of effective methods to select representative features (genes) that could distinguish different samples, these methods could give us hints on functional feature selection methods for metagenomic samples. However, there exists differences in the properties of metagenomic data and gene expression data: besides the high data dimensions, metagenomic data additionally present their own specific issues, including sequencing errors, chimeric reads, and complex underlying biology; many microbial communities have been found to show remarkably high inter-subject variability. In this work, we have a systematic study of the feasibility and applicability of using the machine learning methods to analysis metagenomic dataset. Firstly, we have evaluated different methods for feature selection (ReliefF[5] and mRMR[6]) and classification (KNN[7] and SVM[8, 9]) that could, combined together, select features to distinguish different types of samples. Secondly, based on these evaluations, we have proposed a biomarker discovery framework to differentiate microbial communities based on metagenomic data. The framework is based on functional
learning,
INTRODUCTION
The total number of microbial cells on earth is huge: approximate estimation of them is 1030 [1], and the genomes of these vastly unknown communities of microbes might contain a large number of novel genes with useful functions. However, more than 90% of microbe species were unknown and un-cultivable[1], making traditional isolation and 2012 IEEE 6th International Conference on Systems Biology (ISB) 978-1-4673-4398-5/12/$31.00 ©2012 IEEE
106
Xi’an, China, August 18–20, 2012
profiles generated from the metagenomic data, either based on microarray profiling results from techniques such as Geochip[10], or based on whole genome sequencing results. It selects discriminative features as candidate features, and then selects and evaluates a subset of these features with low error rate and classification accuracies as biomarkers. Finally, we have manually evaluated the biomarkers selected by evaluating the functions and/or other biological significance of each biomarker. This general procedure is simple in principle, yet it is significantly different from previous biomarker discovery methods. Firstly, it is different from traditional biomarker discovery method for their different objectives: traditional method could identify biomarkers that could distinguish different species, while the framework is designed for discover biomarkers that could differentiate microbial communities. Secondly, it is different from previous metagenomic biomarker methods in that the final results would be a set of few features (genes), rather than a complex taxonomy structure or a set of many biological meaningful features. Thirdly, it is different from the non-machine learning method such as t-test [24], in that it is a machine-learning method that is supervised and has modules for feature selection, and the number of biomarkers to be selected could be controlled (though depend on different error rate tolerance of the end-users). II.
METHODS
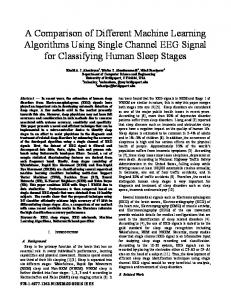
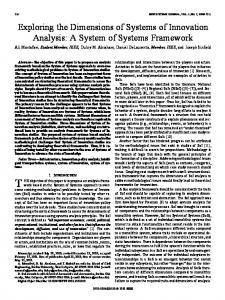
A. Feature selection and classification methods The overall functional biomarker discovery pipeline includes feature selection step and classification step. For the feature selection step, a number of candidate features would be selected that could discriminate different samples. For classification step, the discrimination power of these candidate features would be evaluated and further filtered (Fig. 1).
is is to estimate the quality of attributes according to how well their values distinguish between instances that are near to each other. The minimum Redundancy Maximum Relevance (mRMR) method select a feature subset set that best characterizes the statistical property of a target classification variable, subject to the constraint that these features are mutually as dissimilar to each other as possible, but marginally as similar to the classification variable as possible. Both of these two methods have been assessed to select features from functional profiles of a metagenomic sample. 2) Classification method: For testing in permutations and determining the final list of biomarker genes, we have assessed both SVM, a model-driven method, and KNN, a data-driven method. Support vector machine (SVM) takes a set of input data and predicts, and predict for each given input, which of two possible classes comprises the input, making the SVM a non-probabilistic binary linear classifier. KNN-based classification is a simple algorithm that stores all available cases and classifies new cases based on a similarity measure (e.g., distance functions). A case is classified by a majority vote of its neighbors, with the case being assigned to the class most amongst its K nearest neighbors measured by a similarity measure function. Based on these feature selection and classification methods, we have proposed 4 different combinations for the framework: ReliefF-KNN, ReliefF-SVM, mRMR-KNN and mRMR-SVM. B. The parameter configurations for the framework Several parameters would significantly affect the accuracy of biomarker discovery. These parameters would include: (1) the K value for ReliefF in feature selection and classification process, (2) the number of cross-validation for the permutation testing, (3) the number of samples, (4) the number of features to be selected, etc. To tune for the best combination of configurations, we have extensively tested each and the combined effects. III.
A. Datasets and experiment configurations Most metagenomic datasets obey a long-tail distribution; however, things are not always like this. Our empirical study shows that there really exit datasets subject to Gaussian normal distribution (for details, see our online materials at: http://computationalbioenergy.org/meta-biomarker.html).For simplify, we generated our simulated dataset based on Gaussian normal distribution. Simulated dataset 1, including two collections of datasets, generated as follows: for collection A, first generated 10 positive and 10 negative samples, each has 10,000 features, which is normally distributed, then set 50, 500 and 1,000 of them as biomarkers (by normal distribution but with different mean and standard deviation), generating 100 datasets for each configuration; datasets in collection B were defined in the same way as collection A but with 50 positive and 50 negative samples. The binary version of Simulated dataset 1
Figure 1. The overall scheme of feature selection and classification framework for functional biomarker discovery from metagenomic data.
1) Feature selection method: Both ReliefF and mRMR methods are considered good feature selection methods to select candidate features. The key idea of ReliefF algorithm 2012 IEEE 6th International Conference on Systems Biology (ISB) 978-1-4673-4398-5/12/$31.00 ©2012 IEEE
RESULTS AND DISCUSSIONS
107
Xi’an, China, August 18–20, 2012
was generated by setting a threshold, data above which set as 1, vice versa, set as 0, named Simulated dataset 2.
dataset 1 and Simulated dataset 2. On Simulated dataset 1, the different K values in KNN for feature selection have similar effect on the error rate and sensitivity of the final results. While on Simulated dataset 2, some more significant differences in results could be observed, and the best error rate and sensitivity could be achieved at K = 1, yet results based on K = 5 is also reasonably good. 3) Analysis of the number of cross-validation: We have also tested the number of cross-validation (with the combination of mRMR-SVM), based on Simulated dataset 2. Results on different number of cross-validation have shown that the different numbers have similar effects on the error rate and sensitivity of the final results. Based on the above parameter testing results, we have fixed the parameters for the following tests as below in Table 1.
To comparison with Metastats, we built two collections of artificial datasets, Simulated dataset 3. All collections have 1,000 features and 100 samples distributed evenly to two classes, and the values were sampled from Gaussian normal distribution. Of the 1,000 features, 500 features have different means across classes and thus should be detected as biomarkers (discriminative features); the other 500 features are evenly distributed across classes and should not be detected as biomarkers. The method were evaluated assessing the numbers of error (number of features erroneously detected as biomarker). The two collections differ in the mean of the normal distribution (with an upturn in the mean difference): (A) The discriminative features all have μ = 100 + 2 (σ = 5), and others features all have μ = 100 (σ = 5). (B) Discriminative features in this dataset all have μ = 100 + 4 (σ = 5), and others are defined in the same way as dataset (A).
TABLE I.
The real datasets include a human saliva whole genome sequencing dataset[11] and T-bet-/- × Rag-/- and Rag-/- mouse data[12]. Human saliva dataset includes four saliva samples (two from the healthy population and the other two from the caries-active population). For each of them, shotgun pair-end libraries of total saliva genomic DNA was prepared. Each metagenomic DNA libraries was then sequenced on one lane of pair-end 100bp or 75bp flow-cell on Solexa GA-IIx (Illumina, USA). Reads produced were processed via their respective computational pipelines customized for human oral microbiome analysis[13]. All sequences were deposited under accession number SRA049721. T-bet-/- × Rag-/- and Rag-/mouse dataset, from the study about mouse model of ulcerative colitis, includes 20 T-bet-/- × Rag-/- (case) samples and 10 Rag-/- (control) mice samples, and the experiment has been described in[12].
THE DEFAULT PARAMETERS USED IN OUR FRAMEWORK
Methods combination
K (feature selection)
K (classification)
# of crossvalidation
ReliefF-KNN
10
5
5
ReliefF-SVM
10
-
5
mRMR-KNN
-
5
5
mRMR-SVM
-
-
5
C. Analysis of feature selection and classification In this analysis, the feature selection method includes mRMR and ReliefF. The number of selected candidate features was: 1, 5, 10, 20, and 50. For the classification, the discrimination power of these candidate features was evaluated and would be further filtered. The classification method includes SVM and KNN.
The overall experiment configurations includes: first test the parameters used for the framework, then select features, and finally perform classification to choose the best set of features. We have first used the simulated data to analyze each of these steps, and the parameters used in these steps. The results evaluation includes: the performance of a model is predicted by cross-validation and evaluated by its sensitivity value and error-ration value. B. Analysis of the parameters used in the framework 1) Analysis of K value in ReliefF for feature selection: We have first tested the K values in ReliefF for feature selection (within the combination of ReliefF-KNN), based on both Simulated dataset 1(continuous data) and Simulated dataset 2 (binary data). It can be observed that on both continuous and binary data, the different K values in ReliefF for feature selection has similar effect on the error rate and sensitivity of the final results. Additionally, K = 10 is a relatively good value for ReliefF feature selection, especially on binary data. 2) Analysis of K value in KNN for classification: We have then tested the K values in KNN for classification (with in the combination of mRMR-KNN), based on both Simulated 2012 IEEE 6th International Conference on Systems Biology (ISB) 978-1-4673-4398-5/12/$31.00 ©2012 IEEE
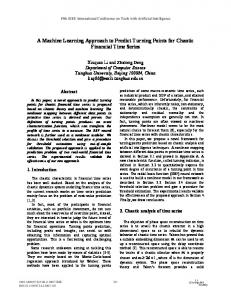
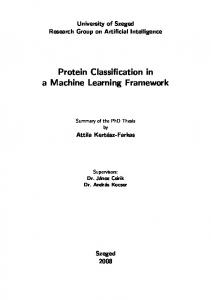
(a) Mean value of error rates and sensitivity for Simulated dataset 1 containing 50 candidate biomarkers
108
Xi’an, China, August 18–20, 2012
As shown in Fig. 2, for continuous data, ReliefF-KNN works well on small sample size, however, ReliefF-SVM and mRMR-SVM both work much better on larger sample size. It is also observed that for binary data (for more detail: http://computationalbioenergy.org/meta-biomarker.html/), mRMR-SVM works best both on small and large sample size. As such, these results suggested that the mRMR-SVM combination of method perform best on most of these simulated data. D. Results on real metagenomic datasets 1) Features selected on oral microbial community dataset: There exists missing values in the oral microbial community dataset, so all data are treated as binary data by converting these data as follow: where there is a gene present (value>0), we set it as 1; otherwise, we set it as 0. According to the result of 4 different combination methods on binary data, we used mRMR-SVM method to select the biomarkers. The cross validation process is 5. Model runs 100 times on these data. The candidate features set with highest sensitivity value and lowers error rate were selected as the final list of biomarkers.
(b) Mean value of error rates and sensitivity for Simulated dataset 1 containing 500 candidate biomarkers
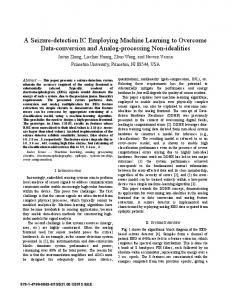
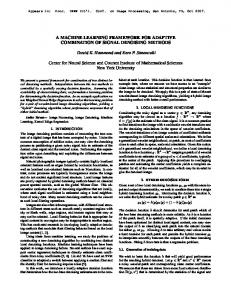
Fig. 3 shows the mean sensitivity value and error rate for the biomarkers discovered from oral dataset. With the increasing number of candidate feature, the mean value of sensitivity increased and mean error rate decreased. It is also observed that these values changed in a plausible range, which also indicated the powerful of the mRMR-SVM method. We selected 50 features as candidate biomarkers, and it is interesting to see that some selected genes are actually the caries biomarkers validated by wet-lab experiments[14]. For example, Alpha-glucosidase (fig_4440943.3.peg.5041) is thought to participate in the induction of dental caries[14]. Diaminopimelate epimerase (fig_4440824.3.peg.204352) is central to the biosynthesis of both lysine and cell-wall peptidoglycan in many bacteria species[14].
(c) Mean value of error rates and sensitivity for Simulated dataset 1 containing 1000 candidate biomarkers Figure 2. Comparison of different combination of methods on different set of Simulated dataset 1.
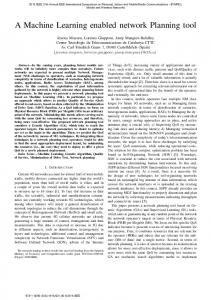
2) Features selected on T-bet-/- × Rag-/- and Rag-/- mouse dataset: We applied mRMR-SVM combination on this dataset, and Fig. 4 shows the mean sensitivity value and error rate for the biomarkers discovered from this dataset. We selected top 20 differentially abundant taxonomic clades base on the result of mRMR-SVM combination. The manually evaluated 15 of the 20 differentially abundant taxonomic clades is shown in TABLE 2. TABLE 2 shows that, these differentially abundant clades detected by our method are consonant with prior 16S rRNA-based sequence analysis [12]. The marked loss in Bifidobacteriales and Bifidobacteriaceae are detected, the difference of which between the two classes, may explain the responsiveness of this colitis to a Bifidobacteriaceae animalis subsp. Lactis milk product. Our method also detected the Lachnospiraceae, Bifidobacteriaceae, and Staphylococcaceae enrichment difference between the two classes, which is in good agreement with the experiment results from [15]. Our method also highlights several clades within the Clostridia, including Papillibacter, Roseburia,
Figure 3. Mean sensitivity value and mean error rate of mRMR-SVM combination on oral microbial community dataset.
We have applied the 4 different combinations of methods (4 models) on Simulated dataset 1, and calculated sensitivity value and error rate. The mean sensitivity value and mean error rate value for continuous data set are showed in Fig. 2.
2012 IEEE 6th International Conference on Systems Biology (ISB) 978-1-4673-4398-5/12/$31.00 ©2012 IEEE
109
Xi’an, China, August 18–20, 2012
TABLE II.
DIFFERENTIALLY ABUNDANT TAXA BETWEEN T-BET-/- × RAG-/- (CASE) AND RAG-/- (CONTROL) MICE
Bacteria|Firmicutes|Clostridia|Clostridiales|Ruminococcaceae|Papillibacter Bacteria|Bacteroidetes|Bacteroidia|Bacteroidales|Bacteroidaceae Bacteria|Firmicutes|Clostridia|Clostridiales|Lachnospiraceae|Coprococcus Bacteria|Actinobacteria|Actinobacteria|Coriobacteriales|Coriobacteriaceae|Collinsella Bacteria|Actinobacteria|Actinobacteria|Bifidobacteriales|Bifidobacteriaceae|Metascardovia Bacteria|Firmicutes|Clostridia|Clostridiales|Lachnospiraceae|Roseburia Bacteria|Actinobacteria|Actinobacteria|Coriobacteriales|Coriobacteriaceae|Asaccharobacter Bacteria|Firmicutes|Bacilli|Bacillales|Staphylococcaceae Bacteria|Actinobacteria|Actinobacteria|Coriobacteriales|Coriobacteriaceae|Eggerthella Bacteria|Firmicutes|Clostridia|Clostridiales|Lachnospiraceae Bacteria|Firmicutes|Bacilli|Bacillales|Staphylococcaceae|Staphylococcus Bacteria|Proteobacteria|Deltaproteobacteria|Desulfovibrionales|Desulfovibrionaceae|Lawsonia Bacteria|Actinobacteria|Actinobacteria|Bifidobacteriales|Bifidobacteriaceae Bacteria|Actinobacteria|Actinobacteria|Coriobacteriales|Coriobacteriaceae Bacteria|Firmicutes|Clostridia|Clostridiales|Ruminococcaceae|Oscillibacter Oscillibacter and Coprococcus genera, which play an important role in the development of ulcerative colitis. Intestines of mice with colitis caused by dextran sulfate sodium (DSS) contain more Bacteroidaceae cells than untreated controls[16], which has also been indicated in our result.
selected features with Simulated dataset 3 were listed in TABLE 3. Our framework can obtain biomarkers indicating the difference between the two classes with collection A, for example, the number of errors was 1 when 10 features were selected as biomarkers; however, Metastats selected no biomarkers, and indicated by NULL in TABLE 2. The power of Metastats is increased along with the increase of mean value difference between the classes, indicated by results with collection B. Comparison of these two methods shows that our method can obtain representative features even small differences existing between two classes, however, Metastats do not. TABLE III.
THE COMPARISON OF OUR FRAMEWORK AND METASTATS Collection A
Figure 4. Mean sensitivity value and mean error rate of mRMR-SVM combination on T-bet-/- × Rag-/- and Rag-/- mouse dataset.
E. Comparison with other metagenomic biomarker discovery methods
# of Biomarkers
Metastats
Ours
Metastats
Ours
5
NULL
0
0
0
10
NULL
0
0
0
15
NULL
1(6.7%)
0
0
20
NULL
2(10%)
0
0
F. Application and other considerations The most desirable set of biomarkers would have at least three properties: their identification does not need any sequencing, there are a few of them, and they have functional and/or taxonomical annotations. These properties of biomarkers are needed because of application considerations. In such context, a set of genes that would be very simple and cheap to reproduce, such as by PCR or RT-PCR, would be good biomarkers for metagenomic samples. For example, based on a set of determined genes as biomarkers, it is possible for a dentist to identify a few genes’ presence to tell
We applied Metastats (q-value, B = 1,000, alpha = 0.05) and our mRMR-SVM combination to Simulated dataset 3, which includes two collections of dataset: collection A, collection B, all generated from normal distribution with same variance but mean. Results obtained by the two methods with these collections were ranked respectively: Metastats results ranked by their q-values and Meta-Biomark results ranked by feature weighting. Then top n (n = 5, 10, 15, 20) features were selected as biomarkers. The number of errors (number of features false selected as biomarkers) and error rate of these 2012 IEEE 6th International Conference on Systems Biology (ISB) 978-1-4673-4398-5/12/$31.00 ©2012 IEEE
Collection B
110
Xi’an, China, August 18–20, 2012
if the corresponding host is carries or not, with certain error rate estimates[14]. IV.
tech (863) grant 2009AA02Z310, and NSFC grant 61103167 and NSFC grant 31072115. This work is supported in part by Chinese Academy of Sciences’ e-Science grant INFO-115-D01-Z006, Ministry of Science and Technology’s high-tech (863) grant 2009AA02Z310, NSFC grant 61103167 and NSFC grant 31072115.
CONCLUSION
Determination of biomarkers for metagenomic samples is important for quickly differentiating and categorizing of microbial communities. However, current metagenomic biomarker identification methods relied on metagenomic sequencing. Thus, it is not possible to tell functional differences between samples in a quick and cheap manner, and make applications such as clinical diagnosis difficult.
REFERENCES
The most desirable set of biomarkers would have at least three properties: their identification does not need any sequencing, their number is small, and they have functional annotations. In this study, we have focused on machine learning methods, and evaluated different feature selection and classification method to select functional biomarkers from metagenomic samples. In this paper, we proposed a framework to select discriminative features from functional profile of the metagenomic sample. Firstly, the features (genes) that selected are both biologically meaningful and clinically easy to use. Secondly, the number of biomarkers that selected is few and controllable (by specifying the number), and these small number of biomarkers are easy to be used in applications than the use of taxonomical or functional structures as biomarkers[17]. Thirdly, as it is based on supervised machine learning, thus potentially could achieve higher accurate than traditional method such as t-test, with the accumulation of real datasets in real-world applications. Finally, our framework is not restricted by WGS’s real gene expression values, but could also adapt to the Geochip’s binary gene presence values. Therefore, this framework is a suitable method to select biologically meaningful biomarkers (genes) for the metagenomic samples. It is shown from our experiments that this framework is able to detect a set of biomarkers with high sensitivity and low error rate. With the development of microarray-based and WGS-based metagenomic data sampling techniques, metagenomic samples are acuminating rapidly. Therefore, this method could uncover a lot more functional biomarkers for a large range of metagenomic samples. And a database of these functional biomarkers would eventually facilitate the on-going barcoding projects for all selected microbial communities. Our future research direction would include: analyzing the effect of classification method on final result; generalizing our method can applied to dataset including more than two groups; more general gene-based features to be extracted based on more accurate methods. We believe these would not only improve the accuracy of functional biomarker discovery, but also would extend the usability of our method. ACKNOWLEDGMENT We thank Dr. Xinping Cui from University of CaliforniaRiverside for insightful discussion. This work is supported in part by Chinese Academy of Sciences’ e-Science grant INFO115-D01-Z006, Ministry of Science and Technology’s high2012 IEEE 6th International Conference on Systems Biology (ISB) 978-1-4673-4398-5/12/$31.00 ©2012 IEEE
111
[1] G. N. Proctor, "Mathematics of microbial plasmid instability and subsequent differential growth of plasmid-free and plasmid-containing cells, relevant to the analysis of experimental colony number data," Plasmid, vol. 32, pp. 10130, Sep 1994. [2] J. A. Eisen, "Environmental shotgun sequencing: its potential and challenges for studying the hidden world of microbes," PLoS Biol, vol. 5, p. e82, Mar 2007. [3] J. R. White, et al., "Statistical methods for detecting differentially abundant features in clinical metagenomic samples," PLoS Comput Biol, vol. 5, p. e1000352, Apr 2009. [4] N. Segata, et al., "Metagenomic biomarker discovery and explanation," Genome Biol, vol. 12, p. R60, 2011. [5] M. Robnik-Sikonja and I. Kononenko, "Theoretical and empirical analysis of ReliefF and RReliefF," Machine Learning, vol. 53, pp. 23-69, Oct-Nov 2003. [6] H. Peng, et al., "Feature selection based on mutual information: criteria of max-dependency, max-relevance, and minredundancy," IEEE Trans Pattern Anal Mach Intell, vol. 27, pp. 1226-38, Aug 2005. [7] P. Hall, et al., "Choice of Neighbor Order in Nearest-Neighbor Classification," Annals of Statistics, vol. 36, pp. 2135-2152, Oct 2008. [8] C. Cortes and V. Vapnik, "Support-Vector Networks," Machine Learning, vol. 20, pp. 273-297, Sep 1995. [9] S. Tuna and M. Niranjan, "Classification with binary gene expressions," JBiSE, vol. 2, pp. 390-399, 2009. [10] Z. He, et al., "GeoChip 3.0 as a high-throughput tool for analyzing microbial community composition, structure and functional activity," ISME J, vol. 4, pp. 1167-79, Sep 2010. [11] F. Yang, et al., "Saliva microbiomes distinguish caries-active from healthy human populations," ISME J, Jun 30 2011. [12] P. Veiga, et al., "Bifidobacterium animalis subsp. lactis fermented milk product reduces inflammation by altering a niche for colitogenic microbes," Proc Natl Acad Sci U S A, vol. 107, pp. 18132-7, Oct 19 2010. [13] G. Xie, et al., "Community and gene composition of a human dental plaque microbiota obtained by metagenomic sequencing," Mol Oral Microbiol, vol. 25, pp. 391-405, Dec 2010. [14] F. Yang, et al., "Saliva microbiomes distinguish caries-active from healthy human populations," ISME J, vol. 6, pp. 1-10, 2012. [15] M. Okamoto, et al., "Metascardovia criceti Gen. Nov., Sp. Nov., from hamster dental plaque," Microbiol Immunol, vol. 51, pp. 747-54, 2007. [16] K. Ariake, et al., "Roles of mucosal bacteria and succinic acid in colitis caused by dextran sulfate sodium in mice," J Med Dent Sci, vol. 47, pp. 233-41, Dec 2000.
Xi’an, China, August 18–20, 2012
[17] N. Segata, et al., "Metagenomic biomarker discovery and explanation," Genome Biology, vol. 12, p. R60, 2011.
2012 IEEE 6th International Conference on Systems Biology (ISB) 978-1-4673-4398-5/12/$31.00 ©2012 IEEE
112
Xi’an, China, August 18–20, 2012