Globecom 2013 - Communication and Information System Security Symposium
A Novel Anomaly Detection System based on Sevendimensional Flow Analysis Marcos V. O. de Assis Computer Science Department State University of Londrina Londrina, Brazil
[email protected]
Joel J. P. C. Rodrigues Instituto de Telecomunicações University of Beira Interior Portugal
[email protected]
information, such as protocols, IP addresses, number of packages, bytes, among others.
Abstract—Anomaly detection in large-scale networks is not a simple task, although there are several studies in this area. The continuous expansion of computer networks results in increased complexity of management processes. Thus, simple and efficient anomaly detection mechanisms are required in order to assist the management of these networks. In this paper, we present an anomaly detection system using a seven-dimensional flow analysis. To accomplish this objective, we used the improved Holt-Winters forecasting method on the traffic characterization of each one of the different analyzed dimensions, here called Digital Signature of Network Segment using Flow analysis (DSNSF). The system not only warns the network administrator about the problem, but also provides the necessary information to solve it. Real data are collected and used by the system to measure its efficiency and accuracy.
Several previous studies and management tools are based on the analysis of only one flow feature, which is used on traffic characterization and anomaly detection processes [4][5]. According to [6], the use of multiple correlated features or dimensions helps both characterization and anomaly detection processes in computer networks. The objective of this paper is to present a novel network anomaly detection system based on a seven-dimensional flow analysis, using the features: bits/s, packages/s, flows/s, IP addresses of origin and destination and ports of origin and destination. Through simultaneous analysis of these seven dimensions, it is possible to identify the behavior of different anomalies, to generate specific alarms and to identify its possible causes. The system can be divided into two main modules: the Detection module and the Information module.
Keywords-DSNSF; Holt-Winters; HWDS; Seven-dimensional Flow Analysis; Traffic Characterization; Network Management.
I.
INTRODUCTION
One of the most important parts of anomaly detection is the traffic characterization. The presented system characterizes the normal traffic behavior by using an improved version of the statistical forecasting Holt-Winters method, named HoltWinters for Digital Signature (HWDS) [7]. Through the use of this method, it is possible to characterize the traffic of a network segment with higher efficiency than the traditional method, as well as providing a low computational cost approach. The HWDS method is used to characterize each one of the seven different analyzed dimensions, resulting in traffic profiles here called Digital Signature of Network Segments using Flow analysis (DSNSF).
Computer networks perform an essential role nowadays, providing efficiency and agility to the communication processes. The continuous convergence of these processes to the Internet as well as the increasing demand for data transmission volume and agility, generate the need for increasingly large and robust computer networks. Together with the growth of these networks, the management complexity increases, which hampers processes based on the manual identification of problems. Thus, the creation of new mechanisms and tools which help this management is essential to ensure the quality of the provided services. These tools must be efficient and have a low computational cost in order to support the analysis of largescale networks. Furthermore, the process of detection and identification of the anomalies should be independent of human-supervision, a study field known as Autonomic Management [1]. This approach decreases the analysis complexity and increases the reliability and availability of computer networks, allowing its administrator to quickly identify problems, attacks or system failures.
To measure the efficiency of the presented system, real data flow was collected from State University of Londrina, a large network composed by more than 7000 different hosts. Specific tests are performed in order to verify the accuracy and feasibility of the anomaly detection on large-scale network scenarios. The remainder of this paper is composed as follows: Section II presents the related works; Section III explains the HWDS method; Section IV shows the presented anomaly detection system; Section V presents the obtained performance test results; finally, Section VI concludes the paper.
Many different models and tools based on the analysis of IP flows through NetFlow, IPFix or SFlow collectors have been used the assist network management [2][3]. In contrast to the SNMP approach, flow analysis provides a wide range of
978-1-4799-1353-4/13/$31.00 ©2013 IEEE
Mario Lemes Proença Jr. Computer Science Department State University of Londrina Londrina, Brazil
[email protected]
757
Globecom 2013 - Communication and Information System Security Symposium
The use of flow analysis has significantly increased in recent years because it provides a large number of features capable of fully describing communication processes of networks. In [8], the authors present the management of networks using flows through a hybrid sampling approach. In this research, the importance of the data contained in flows is highlighted, enabling the identification of structural and security problems. In [6], the authors use three flow dimensions or features to characterize the traffic of a specific network, proving that the analyzed features are correlated.
dimensional flow analysis. This approach, named Digital Signature of Network Segment using Flow analysis (DSNSF), describes the normal behavior of the analyzed flow features, creating a signature capable of identifying anomalies that may occur. Holt-Winters is a statistical method of forecasting applied to time series characterized by the presence of linear trend and seasonality (periodicity), which is based on the Exponential Weight Moving Average method (EWMA). This method divides the analyzed data into three parts represented by equations of the EWMA type. They are the baseline (a), the linear trend (b) and the seasonality trend (c) [13].
Among the different approaches used as base for network management tools, the traffic characterization has been widely studied in recent years due to its great effectiveness within the anomaly detection context. In [4], the authors use the traffic characterization based on flow analysis to detect and identify anomalies in large-scale networks, highlighting that researches using this approach are still scarce. In [9], the authors propose a hybrid traffic prediction method using the Covariation Orthogonal and Artificial Neural Networks.
We used a modification of the Holt-Winters traditional method, named Holt-Winters for Digital Signature (HWDS), aiming to achieve better results related to the creation of DSNSF. Previous work [7] prove that the HWDS method have a considerable performance gain relating to the traditional method, presenting outcomes with low error percentage and high correlation indices between the generated DSNSFs and the network's normal behavior. Thus, the prediction y't+1, obtained through the analysis of yt, is given by:
One of the most used methods on anomaly detection based on networks behavior analysis is the Principal Component Analysis (PCA). Introduced in [10], the authors use the PCA on network-wide generic anomaly detection. In [11], the authors propose an innovative method that combines sketches with the PCA method, detecting anomalies and identifying the IP address associated with them. In [12], the author uses the PCA to detect anomalies on cloud computing systems, environments of high data traffic volume.
In order to perform a network traffic characterization, the usage of various methods has been researched, such as statistics, heuristics and data mining based methods. To make the use of these approaches possible on large-scale networks, these methods must not only be efficient, but also must have a low computational cost. In [5], another research focused on the anomaly detection in cloud computing systems, the authors use the IP addresses octets distribution along with centroid measures to characterize the behavioral structure of this feature on the network. This approach proved to be simple and effective, essential characteristics in anomaly detection systems used on large-scale networks.
at = (yt — ct—s) + (1—)(at—s + bt—s)
bt = (at — at—s) + (1—) bt—s
ct = (yt— at) + (1—) ct+1— s
II.
RELATED WORKS
In equation (1), the variable t indicates the analyzed time interval, s is the number of time windows which the analyzed time series have (seasonal cycle), yt is the value of the time series at the instant t and y't+1 is the calculated forecasting for the instant t+1. The three parts that compose the forecasting are obtained through EWMA equations:
The EWMA equations are characterized by their division in two parts, each receiving a weight at the final result. This weight is assigned through the use of the variables , and enabling the creation of smoother forecasts. They are named "smoothing coefficients", and their values must necessarily belong to the interval 0 < , 1. This adjustability allows faster or slower conversion of the DSNSF, according to the specific requirements of the analyzed network segment. Furthermore, this weight is responsible to prevent anomalies to be incorporated by the generated DSNSF.
Following the trend to use simple and effective methods, the statistic forecasting Holt-Winters method has been widely applied on traffic characterization problems due to its low computational cost and high forecasting efficiency. In [13], the author uses this method to detect anomalies still using the SNMP technology. In [14], the authors apply the Holt-Winters method together with the Kullback-Leibler distance to detect network anomalies using the entropy of the flow features: IP address of origin and destination and port of destination. The system presented in this paper aims to unite the high efficiency and low computational cost of the Holt-Winters method for traffic characterization and a multi-dimensional flow analysis, a novel approach in contrast to previous models. III.
y't+1= at + bt + ct+1—s.
The DSNSF creation using the HWDS prediction method occurs dynamically. The generated DSNSF undergoes changes every new day processed. Thus, data are used relating two different days for the prediction calculus of how the third one should behave: the current day data and the DSNSF generated for the prior day. This characteristic allows for the method to adapts to gradual changes occurred in a simplified way, without the need to perform any adjustments in the method. According to [13], an efficient approach for anomaly detection is the use of confidence bands or thresholds, which indicate an interval where variations are considered normal. However, the approach described by the author is symmetrical,
HOLT-WINTERS FOR DIGITAL SIGNATURE
The anomaly detection system presented in this paper is based on the network traffic characterization through a seven-
758
Globecom 2013 - Communication and Information System Security Symposium
i.e., the distance between the forecast and the inferior and superior thresholds are the same. This allows the classification of anomaly behaviors as normal in networks where variations are predominantly lower or higher than the forecast. We propose an asymmetric approach for the confidence bands generation, where the superior and inferior thresholds are calculated separately: ITt = y't — .d1t STt = y't + .d2t
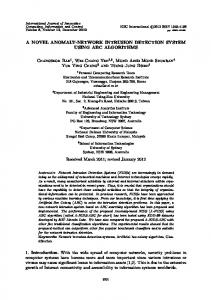
Figure 1. DSNSF and confidence bands generated by the HWDS method over the bits/s traffic of October 9th, 2012.
In equation (5), the inferior (IT) and superior (ST) thresholds are calculated using the forecast (DSNSF) y't, an scaling factor for the width of the confidence band varying in the interval 2 ≤ ≤ 3 [13], and by the deviation measure d, which can be calculated in two ways: dt = (| yt —y't | ) + (1—) dt— s
dt = ( std(y') ) + (1—) dt— s
If the value of yt is superior or equal to the value of the forecast y't, d1t is updated using the equation (6) and d2t is updated using the equation (7). Otherwise, if the value of yt is inferior to the value of the forecast y't, d1t is updated using the equation (7) and d2t is updated using equation (6). In summary, the intervals where the error is predominantly superior are updated with the absolute deviation of the interval and the opposed threshold is updated with the standard deviation (std) of the forecast.
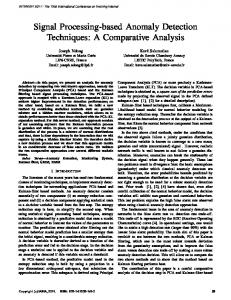
to seven flow dimensions. This approach explores the wealth of information provided through network flow analysis in order to make the processes of characterization and detection of anomalies more accurate and powerful. Besides anomaly detection features, this system provides network administrators relevant information that assist in the solution of detected attacks or failures. These data decrease the anomaly analysis complexity, increase the reliability and availability of the network and increase the agility of the decision-making process, mitigating the impact on the network. Thus, the presented system can be divided in two modules: Detection and Information Module. The first is responsible for the traffic characterization and anomaly detection processes, and the second provides relevant information about the detected anomaly. Fig. 2 summarizes the system's structure:
Figure 2. Anomaly Detection System structure
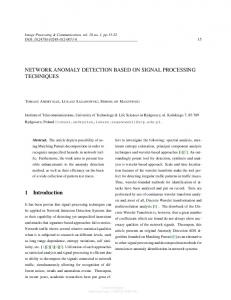
A. Detection Module This module is responsible for the traffic characterization and anomaly detection processes on the analyzed network segment. It is important to highlight that this process is entirely performed in an autonomic way, without the network administrator’s interference in any process described herein. The operating diagram of this module is presented in Fig. 3. The first process performed is the exportation of the collected flows in files. In this step, the data relating to the analyzed dimensions are extracted in separated files so that they can be subjected to traffic characterization process (DSNSF generation). The flow features bits/s, packages/s and flows/s are quantitative metrics, enabling the generation of movement graphs of the analyzed day without the manipulation of these data. The remaining analyzed dimensions (IP addresses and ports of origin and destination) are qualitative metrics, which describe which devices participate in the communication processes, as well as ports used for it.
The basic operation of the HWDS method can be observed at the Algorithm 1, and an example of the generated DSNSFs and thresholds is presented in Fig. 1. IV.
ANOMALY DETECTION SYSTEM
The anomaly detection system presented in this paper is based on the analysis and characterization of the traffic relating
In order to enable the use of the four qualitative dimensions on the network traffic characterization process, the calculation
759
Globecom 2013 - Communication and Information System Security Symposium
of the Shannon Entropy [15] is applied. This allows the network behavioral analysis relating to the dispersion or concentration degree of the elements on the dimensions used. The higher the entropy outcome is, the more dispersed is the analyzed distribution, while lower entropy values indicates a high concentration of the distribution. Thus, we calculate the probability distribution of each analyzed time interval for the 4 different dimensions through the equation: 𝑛
𝑝 𝑥𝑖 = 𝑖 𝑁
In equation (8), p(xi) is the probability distribution of x for each element i, obtained through the number of occurrences ni of these elements divided by the total number of occurrences N on the analyzed time interval. Thus, the entropy of this interval can be calculated as follows: 𝑁
𝐻 𝑥 =−
𝑝 𝑥𝑖 ∙ 𝑙𝑜𝑔2 𝑝(𝑥𝑖 )
𝑖
The time interval used on the traffic characterization is 5 minutes, totaling 288 different intervals which represent the behavior of the analyzed day. The seven dimensions of flows are applied to the HWDS method, described in Algorithm 1, responsible for the generation of DSNSFs and confidence bands (thresholds) for each one of them. As previously discussed, the HWDS method is dynamic, requiring only historical data relating to 1 previous day and the previously generated DSNSF to forecast the behavior of the next day. Thus, for each new day submitted to the anomaly detection system, seven DSNSFs are generated to describe the behavior of the following day.
Figure 3. Operating diagram of the Detection Module.
to the system. These anomalies do not fit in any of the existent behavioral signatures. The generation of alerts on the system occurs when 4 or more anomalies are detected in the same time interval on the seven analyzed dimensions. Alarms are global anomalies that have a behavioral signature known by the system. Alarms are able to directly identify the anomaly according to its behavior. The generation of alarms (alarms triggering) on the presented system occurs when the behavioral pattern of an global anomaly detected in a time interval through the seven analyzed dimensions fits with the signature of any attack or failure known by the system.
After the DSNSF generation for each one of the seven analyzed dimensions (traffic characterization), the anomaly detection process begins. Different anomalies behave differently, which difficult the anomaly detection and identification process in traditional systems based on the analysis of few or even just one flow feature. With the wealth of information provided by a hepta-dimensional analysis, the presented system uses two different approaches on the anomaly detection process: the generation of Alerts and the generation of Alarms through signatures. The concept of anomaly used in this paper encompasses any behavior that is out of the DSNSFs thresholds of any dimension. To simplify the explanation of the anomaly detection process, this concept is divided in local anomalies, behavioral deviations in a single dimension, and global anomalies, which are anomalies generated by the combination of different local anomalies, triggering Alerts and Alarms on the system.
B. Information Module This module is responsible for providing network administrators relevant information about the detected anomaly, also allowing the identification of anomalies still unknown through the creation of new signatures on the system. The information provided through this module increases the network administrator's decision-making process effectiveness, consequently decreasing the impact of network attacks or failures to final users. The information is provided through two main approaches: the ranking of top users and the global analysis of a single time interval (analyzed 5 minutes interval). The ranking provides the network administrator the IP addresses of origin and destination, ports of origin and destination and protocols that have higher occurrence frequencies on the analyzed time interval. For each one of these features are presented the three elements of higher frequency, as well as its occurrence percentages relating to the analyzed time interval. The process of collection of this information occurs together with the entropy calculation of the qualitative dimensions previously described. Since this calculation uses the frequency of occurrence (probability distribution) of the different elements that compose the analyzed time interval, the storage of this information do not add any relevant computational cost to the process. The presented data assists on
These two approaches are predominantly similar, detecting anomaly behaviors and triggering warnings about the problem to the network administrator. Their difference is on the type of detection: alarms detect anomalies that have a signature registered on the system (known behavior), while alerts identify anomalies still unknown to the system. The incorporation of new behavioral signatures of anomalies to the system is discussed on the Information module. Alerts are global anomalies whose behavior is yet unknown
760
Globecom 2013 - Communication and Information System Security Symposium
values = 0.28, = 0.0035 and = 0.1, based on exhaustive efficiency tests and prior works [13][16]. Furthermore, the variable "s" representing the seasonal cycle of the time series has the value 288, because the collected data were analyzed in five minute intervals, generating 288 different intervals each day. Regarding the generated confidence bands (thresholds), the scaling factor was defined with the value = 2.5 because, according to [13], it represents a balanced approach.
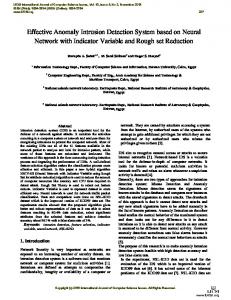
the identification of the problem's cause, who is causing it, from which port it is happening, where the network is being affected, the impact proportion caused and what measures should be taken to fix the problem or interrupt the attack. The global analysis provides the network administrator a graph of the state of the seven analyzed dimensions simultaneously. Through the use of a radar plot, two lines that represent the thresholds calculated by the DSNSFs of the analyzed dimensions and the networks behavior are presented. This graph enables the identification of local anomalies, where it is possible to verify if the networks behavior exceeded or was inferior to the expected. By means of the global analysis, alerts generated by the system can be identified, allowing the network administrator to update the system with the new anomaly signature. Fig. 4 illustrates the global analysis of a time interval classified as normal.
TABLE I. Anomaly Flash Crowd DoS DDoS Port Scan
Flow Dimensions bits
pack
flows
SrcIP
DesIP
SrcPort
DesPort
++
++
++
N/A
--
+-
--
N/A N/A N/A
++ ++ ++
++ ++ ++
-N/A --
----
----
--++
The measures used on the performance evaluation tests are traditional on the analysis of anomaly detection systems, discussed in [17]: the True-positive (TPR), False-positive (FPR) and accuracy (AC) rates and the ROC curve. The results obtained through the Accuracy rates of the system are presented in Fig. 5. As observed these rates are higher than 90% in average, excepting for October 12th and 15th (national holydays). The True-Positive and False-Positive rates presented by Fig. 6, graph known as ROC curve which describes the effectiveness of the anomaly detection system. As illustrated, the system achieves values of 95% TPR and 5% FPR, which proves its high effectiveness in detecting anomalous events on large-scale networks.
Figure 4. Global analysis of a normal time interval.
V.
ATTACKS/ANOMALIES SYSTEM SIGNATURES
EVALUATION TESTS
To enable a performance analysis of the presented system, we collected real flow data from the State University of Londrina (Brazil). This is a large-scale network composed of 7000 different hosts. The flows are collected through the use of the sFlow protocol and, due to the high data traffic volume, a package sampling in a 1:256 scale is used. The collected data are relating to the workdays of September and October, 2012. The first month is used on the training of the system on generating the DSNSFs of the seven analyzed dimensions, while the second is used on its performance evaluation tests. It is important to highlight that October 12th and 15th are national holidays, presenting behaviors that deviates from the expected (anomalous days).
Figure 5. Accuracy rates achieved by the presented system.
Through the tests performed using real flow data, different behavioral patterns were observed for each type of anomaly. These patterns were inserted into the system as signatures, which are described in Tab. I. The symbol "++" indicates an increase on the behavioral movement, "--" represents its decrease, "+-" indicates that the behavior is being affected with an increase or decrease and the "N/A" points out that the dimension is not being affected by the anomaly. As observed, different anomalies behave differently relating to the analyzed flow dimensions, which illustrate the importance of the multidimensional analysis usage on the anomaly detection process.
Figure 6. Overall ROC curve for the workdays.
This system also provides the network administrator relevant information about this anomaly. To illustrate this functionality, an information request was performed relating to the time interval of October 30th, at 9 pm. In this interval, a Flash Crowd anomaly was detected and identified by the system. Tab. II shows the information provided by this request:
For the HWDS parameters, the values assigned to smoothing coefficients must be small to ensure that historical information has a greater influence than new entries in the generated DSNSFs. These coefficients were defined with
761
Globecom 2013 - Communication and Information System Security Symposium
TABLE II.
TOP 1 TOP 2 TOP 3 Others
INFORMATION MODULE -FLASH CROWD - 30/10/12- 9:00 PM. TOP Frequency SrcIP
DesIP
SrcPort
DesPort
Protocol
189.58.159.46 (7%) 186.206.22.196 (6%) 176.73.46.100 (4%) (83%)
189.90.77.148 (51%) 189.90.65.11 (14%) 189.90.77.21 (5%) (30%)
80 (15%) 56379 (7%) 40339 (6%) (73%)
14428 (51%) 23880 (5%) 53 (4%) (40%)
TCP (73%) UDP (27%) ICMP (