JOURNAL OF COMPUTERS, VOL. 7, NO. 3, MARCH 2012
653
IMPACT: A Novel Clustering Algorithm based on Attraction Vu Anh Tran School of Natural Science and Technology, Kanazawa University, Kanazawa, Japan Email:
[email protected]
José C. Clemente Department of Chemistry and Biochemistry, University of Colorado, Boulder, Colorado, USA Email:
[email protected]
Duc Thuan Nguyen Information Systems Department, Nha Trang University, Nha Trang, Vietnam Email:
[email protected]
Jiuyong Li School of Computer and Information Science, University of South Australia, Mawson Lakes, South Australia, Australia Email:
[email protected]
Xuan Tho Dang, Thi Tu Kien Le, Thi Lan Anh Nguyen, Thammakorn Saethang School of Natural Science and Technology, Kanazawa University, Kanazawa, Japan Email: {thodx, kienltt}@hnue.edu.vn, {lananh257, thammakorn.kmutt}@gmail.com
Mamoru Kubo, Yoichi Yamada, Kenji Satou Institute of Science and Engineering, Kanazawa University, Kanazawa, Japan Email: {mkubo, youichi, ken}@t.kanazawa-u.ac.jp
Abstract—Clustering is a discovery process that groups data objects into clusters such that the intracluster similarity is maximized and the intercluster similarity is minimized. This paper proposes a novel-clustering algorithm, IMPACT (Iteratively Moving Points based on Attraction to ClusTer data), that partitions data objects by moving them closer according to their attractive forces. These movements increase separation among clusters while retaining the global structure of the data. Our algorithm does not require a priori specification of the number of clusters or other parameters to identify the underlying clustering structure. Experimental results show improvements over other clustering algorithms for datasets containing different cluster shapes, densities, sizes, and noise. Keywords—Clustering, attraction, force, attractive vector, moving data objects, self-partitioning.
I.
INTRODUCTION
Clustering in data mining is a discovery process that groups data objects into clusters such that the intracluster similarity is maximized and the intercluster similarity is minimized. Clustering is useful in several exploratory pattern-analysis, grouping, decision-making, and machine-learning situations, including data mining, document retrieval, image segmentation, and pattern classification. The discovered clusters can be used to explain the characteristics of the underlying data
© 2012 ACADEMY PUBLISHER doi:10.4304/jcp.7.3.653-665
distribution, and thus serve as the foundation for other data mining and analysis techniques [1]. Several clustering algorithms have been proposed, but there is no unique method that provides satisfactory results when applied to different kinds of datasets. Although this is in part a problem of defining what properties a good clustering algorithm should have [2], there are two particular disadvantages shared by many clustering algorithms: Determination of the number of clusters, k. Some algorithms such as K-means require a priori specification of k. Parameter sensitivity. Clustering results can be particularly sensitive to changes in parameter values. Most algorithms perform well only for certain types of data. In this work, we present a clustering algorithm, IMPACT, and demonstrate that it overcomes the issues described above. IMPACT clusters datasets according to the attraction among data points, which results in the data objects being moved to identify the clusters more accurately. A.
Clustering algorithms There are many ways that clustering algorithms might be classified. A taxonomy of clustering algorithms and its taxa have been presented in detail in the literature [3]. We
654
JOURNAL OF COMPUTERS, VOL. 7, NO. 3, MARCH 2012
briefly introduce here some commonly used clustering algorithms. Partitioning clustering algorithms attempt to break a dataset into k clusters by optimizing a given criterion. K-means [4], K-medoids [4], and PAM [5] are simple examples of partitioning clustering algorithms. These algorithms cluster a dataset by finding the centroid of each cluster and assigning points to the centroids. Another well-studied partitioning algorithm is X-means [6], an extension of K-means that finds k clusters by optimizing a criterion such as the Akaike information criterion or Bayesian information criterion. All partitioning clustering algorithms usually fail for datasets where points in a given cluster are closer to the centroid of another cluster than to the centroid of their own cluster (see Fig. 1).
a) Clusters of widely different size
b) Clusters with convex shape
Figure 1. Datasets for which partitioning clustering algorithms fail to cluster
Hierarchical clustering algorithms start with each data point belonging to one of the disjoint clusters. Each step of the algorithm involves merging the two most similar clusters. With each merger, the total number of clusters decreases, and the merging process continues until terminal conditions are satisfied. The classic HAC (Hierarchical Agglomerative Clustering) algorithm [5] merges the clusters that have the minimum single/complete linkage pairs. CURE [7] starts by using a constant number of representative points and merges two clusters on the basis of the similarity of the closest pair among their representative points, and then updates the representative points of the new cluster. Chameleon [8], a two-phase agglomerative algorithm, tries first to use the graphpartitioning algorithm hMetis to cluster the data items into a large number of relatively small sub-clusters, and then combines these sub-clusters according to their relative interconnectivity and relative closeness. Density-based clustering algorithms attempt to find dense regions separated from other regions that satisfy certain criteria. DBSCAN [9] scans and finds all possible regions such that the size of the region is larger than minPts within the Esp radian. OPTICS [10] represents the hierarchical structure of the data by a one-dimensional ordering of the points. The resulting graph (called a reachability plot) visualizes clusters of different densities as well as hierarchical clusters. DENCLUE [11] uses influence and density functions to improve the clustering result. Even density clustering algorithms can find arbitrary clusters with high accuracy, but they are highly sensitive to the value of parameters and their accuracy
© 2012 ACADEMY PUBLISHER
falls rapidly when the number of attributes increases, especially for high-dimension datasets [10][12] . Grid-based clustering algorithms limit the search space into segments (e.g., cubes, cells, and regions) according to attribute space. STING [13] divides the data into subspace regions (rectangles). These divisions are decided by statistical calculation for each cell. CLIQUE [14], which can be considered both density-based and grid-based, divides each dimension into the same number of interval lengths, and then calculates the density of the cells. These cells are finally connected to generate clusters. D-Stream [15] is a density, grid, and attraction based data clustering algorithm. The input data (stream) are mapped to grids and then clustered by the density-based clustering algorithm and the attraction between grids. Grid-based clustering algorithms accelerate the clustering process, but decrease accuracy due to the division of attribute spaces. In addition, they are very sensitive to the initial value of parameters. Recently, algorithms inspired by natural phenomena have been proposed. AntTree [16], inspired by the behavior of ants, groups objects (ants) by organizing the data as a tree structure, where the order of the nodes is based on similarities between objects and two parameters Tsim and Tdissim. AntSA [17], a hierarchical AntTree-based algorithm, incorporates information related to the silhouette coefficient [18] and the concept of attraction of a cluster in different stages of the clustering process. This algorithm performed best in experiments with different short-text collections of small size. Based on the AntSA algorithm, PAntSA* [19] has been developed to improve clustering ability. PAntSA*, the partitional version of the hierarchical AntSA clustering algorithm, takes the clustering result from arbitrary clustering algorithms and improves it employing techniques based on the silhouette coefficient and the concept of attraction. ITSA* [20], the iterative version of PAntSA*, also takes as input the results obtained by arbitrary clustering algorithms and refines them by iteratively using PAntSA*. These algorithms produce high-quality results for their respective domains. B.
A novel clustering approach Most clustering algorithms attempt to adjust the centroid position of clusters or optimize the static distance matrix to cluster a dataset. However, these methods sometime do not work well for some specific types of dataset. In Fig. 2, we would expect the algorithms to recognize two main clusters: one at the center and another at the bottom. However, K-means (with k = 2) and HAC (using single linkage with k = 2, 3) fail to recognize them. Kmeans completely misidentifies the clusters because of their shape. The results are no better when using HAC, which groups the two clusters as one cluster because they are connected by noise, while identifying some noise as a cluster (it is so-called single-link effect).
JOURNAL OF COMPUTERS, VOL. 7, NO. 3, MARCH 2012
655
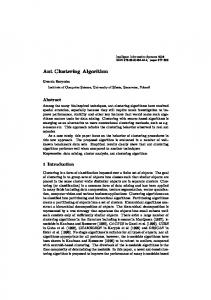
for clustering. By iteratively moving data objects closer together, the clusters gradually form (Fig. 3). When these movements are complete, data objects have gathered into dense regions that can be easily identified as clusters. The main problem of clustering is the misidentification of data points at the border regions due to the effect of noise, density of the centroid and shape of the cluster. However, if we move these points closer to their centroids, which are around the crossing points of these movement vectors, the movements can increase the dissimilarities between clusters and the intracluster similarities, while the global structure of the dataset is maintained (Fig. 4).
Figure 2. Examples in which K-means and HAC fail to cluster a) Original dataset and correct clusters b) Clustering by K-means c) d) Clustering by HAC Figure 4. Effectiveness of moving data objects
In the following sections, we introduce our clustering algorithm, which carries out clustering without specifying the number of clusters or being particularly sensitive to parameter values. a)
b)
II.
PROBLEM DEFINITION AND FRAMEWORK
A. Problem and basic definition Given a dataset D {x | x R } with m data objects (vectors), our objective is to group m data objects into clusters without specifying their number. We assume that each data object is attracted by others via a natural force called attraction as in a physical system. Here we introduce fundamental definitions used in this paper. n
c)
d)
Attraction Attraction is a quantity that represents the attractive force between two data objects xi and xj:
Aij attraction( xi , x j )
1 , distance( xi , x j ) p
where p (p > 0) is a user specified parameter used to adjust the effect of attraction between two data objects. Attractive vector Attractive vector is an n-dimensional vector representing the attractive force between a data object and another data object caused by the attraction between them. Attractive vector avij = (av ij1, avij2… avijn) of xi for xj is computed as e) Figure 3. Illustration of the IMPACT algorithm a)-d) Moving data objects and identifying clusters e) Final result
To address this problem, we propose a clustering algorithm based on a new concept: instead of changing the centroid, we change the value of the data objects used © 2012 ACADEMY PUBLISHER
avijk
x jk xik n
| x jr xir | r 1
Aij (k 1..n) .
656
JOURNAL OF COMPUTERS, VOL. 7, NO. 3, MARCH 2012
Inertia Inertia is a quantity representing the effect of a cluster on its membership. The inertia of each cluster is computed as
Ij
|Cj | largestClusterSize
The attractive forces shift objects, as represented by movement vector. The direction of the movement vector vi of xi is the summation of all attractive vectors of all other data objects to xi:
,
where Cj is the jth cluster. |Cj| is the size of Cj and largestClusterSize is the size of the largest cluster. B. Framework 1) Moving data objects Moving data objects can improve the quality of identified clusters by increasing the similarities between similar data objects and the dissimilarities between clusters. In this section, we describe how to compute the movement of a data object (movement vector). There are three steps to compute the movement vector of a data object: computing the attraction, computing the movement vector, computing the inertia of each cluster and the Scale value. As in physics, objects attract each other and move closer under the effect of an attractive force among them (attraction). The effect of attraction is directly correlated to the parameter p, the quantity used to adjust the local and global distribution of datasets. If p takes a small value (e.g., 1 or 2), not only neighbors but also objects further away can affect an object. In this case, the dataset tends to reach a global balance. In contrast, if p takes a larger value (e.g., 3, 4, ...), the attraction is only toward neighbors1, and the cluster tends to maximize the intracluster similarity (see Fig. 5).
m
vi avij . j 1
The length of the movement vector should be calculated carefully. For the sake of higher clustering accuracy, the distance of movement (magnitude of the movement vector) should not be too long. However, if the distance of the movement is too short, the clustering process will be slow. In addition, after data objects form a cluster, they do not need to move so much. Based on these considerations, the movement is adjusted by two values: Inertia: If xi belongs to a cluster Cj, its movement vector vi is adjusted as vi vi (1 I j ) ,
where Ij is the inertia of cluster Cj. The inertia avoids clusters from moving too quickly and incorrectly merging. Scale: Because the threshold value Th is used during the clustering step, the appropriate magnitude of each movement vector should be no greater than Th. Scale, a value used to adjust the length of movement vector, is computed as
Scale
Th max (| vi | )
.
i 1..m
a) Appropriate movement
b) Inappropriate movement
Figure 6. Appropriate and inappropriate movements of object
After adjustment, all movement vectors are guaranteed not to cross the scanning field of the nearest objects (Fig. 6). It is therefore clear that the movement of data objects retains the global and local structure of the cluster: the inertia ensures clusters do not merge easily, while computation of all the attractions affecting one data object retains the global balance. In this step, data objects are modified (moved) as
xi xi Scale vi . a) Moving data objects and identifying clusters using small p
b) Moving data objects and identifying clusters using large p
Figure 5. Effect of parameter p on IMPACT clustering
1
The attraction between two indistinguishable data objects whose distance is less than a threshold value Th is zero. © 2012 ACADEMY PUBLISHER
The modification increases the similarity between close objects and the dissimilarity between groups by increasing the distance of their borders. Fig. 7 summarizes the steps to move data objects.
JOURNAL OF COMPUTERS, VOL. 7, NO. 3, MARCH 2012
Procedure Moving Begin Compute attraction matrix:
Aij attraction( xi , x j )
1 distance( xi , x j ) p
Compute attractive vectors: x jk xik avijk n Aij (k 1..n) | x jr xir | r 1
avij = (av ij1, avij2… avijn) Compute movement vector of xi: m
vi avij j 1
Compute inertia for each cluster Cj: |Cj | Ij largestClusterSize For each movement vector xi If xi Cj then Adjust xi’s movement vector as: xi C j vi vi (1 I j ) Compute the Scale value: Th Scale max (| vi | ) i 1..m
Move all objects: xi xi Scale vi End;
657
Procedure Grouping Variable l: cluster label V: set of visited objects S: set of next visited objects G: set used to store current group Begin l = 0; V = ∅; For each xi not in V then Begin S = xi; G = ∅; While S ≠ ∅ do Begin Randomly take xz out of S; G = G + xz; V = V + xz; For each xj not in V do If distance(xz,xj)