Hindawi Publishing Corporation International Journal of Distributed Sensor Networks Volume 2015, Article ID 409617, 10 pages http://dx.doi.org/10.1155/2015/409617
Research Article A Novel Multivariable Algorithm for Detecting and Tracing Metal Mobile Objects Employing a Simple RFID Setup Wendy Navarro, Juan C. Velez, Norelli Schettini, and Maria Calle Department of Electrical and Electronics Engineering, Universidad del Norte, Km 5, V´ıa Puerto Colombia, Barranquilla, Colombia Correspondence should be addressed to Maria Calle;
[email protected] Received 6 August 2015; Accepted 9 November 2015 Academic Editor: Antonio Lazaro Copyright © 2015 Wendy Navarro et al. This is an open access article distributed under the Creative Commons Attribution License, which permits unrestricted use, distribution, and reproduction in any medium, provided the original work is properly cited. Radio Frequency Identification (RFID) is a solution for automated inventory and object detection applications. However, if RFID tags are attached to metal objects, detection errors may occur due to Foucault currents and interferences caused by multiple simultaneous reflections. Errors may increase if metal objects are moving. The paper presents a novel algorithm using RFID lowlevel reader variables, such as RSSI (Received Signal Strength Indicator), phase angle, and Doppler shift, to detect and trace metal objects. The algorithm was designed to identify if a tag is static or moving and, in the latter case, to compute its speed and direction. The algorithm differs from previous approaches since it uses a simple setup with one commercial portal reader coupled with one single element antenna. Experiments employed one tag located on one metal moving object and 12 static interferer tags, in both outdoor and indoor locations. Results show that the algorithm identifies static tags with no errors. For moving tags, the algorithm shows a maximum 12% error. The algorithm correctly estimates direction and computes object speed. Test conditions emulate fork lift speeds when carrying objects in an industrial warehouse.
1. Introduction Passive RFID systems employ Ultra High Frequency (UHF) band, between 860 MHz and 960 MHz. They allow object identification in a cover area without requiring direct line of sight. However, UHF RFID system performance may be affected by propagation environment, by RFID reader parameters, and mainly by tag characteristics [1]. Performance may also decrease when tags are located over moving metal objects [2] in areas with high density of static tags. The latter situation degrades antenna gain and impedance match between the RFID Chip and the antenna [1]. When using UHF, metals reflect radio energy transmitted by the RFID reader obstructing the detection process [3]. Additionally, electromagnetic waves induce Foucault currents in conducting surfaces, with opposite fields to the transmitter. The situation attenuates and may cancel the electromagnetic field required for reader-tag communication [2]. If an industry uses RFID to complete an inventory, the system should be able to determine whether the shipment
is entering or leaving a gate, or if tags are moving or static. Without this information, the system may compromise reliability of the inventory process. Therefore, addressing this issue is a must for industrial productive processes based on RFID technology. On the other hand, when the target object is moving, time required to identify it is limited. The object may abandon the cover area without identification, due to interference of static neighbor tags [4, 5]. The phenomenon, where other RFID tags are detected but the target is not, occurs also with static tags, and it is known as “the hidden tag problem” [6]. All these circumstances are relevant for industries that store, transport, and ship metal objects and require automating inventories. Although an object with an RFID tag moving towards the reader should ideally have increasing RSSI values, in most cases the task of classifying moving and static tags is not that easy [7]. In fact, RSSI data collection of gathering cycles demonstrates how difficult it is to identify moving tags, especially due to random variations, up to 22 dB [7]. Given this fact, RSSI by itself does not allow adequate estimation of speed and distance.
2
International Journal of Distributed Sensor Networks
This paper presents a new algorithm based on an experimental method, for detecting a moving metal object, estimating its direction and speed. The algorithm also traces the object: that is, it estimates the object distance from a reader at different times. The algorithm employs multiple radiofrequency variables. The main contributions of this paper are as follows: (i) Unlike other solutions implemented with nonsingle element antennas [8], the proposed algorithm uses a simple hardware setup with only one directive, circular polarization antenna. (ii) To the best of our knowledge, this is the first multivariable algorithm employed for detection, tracing, and speed estimation of different metal objects (cylinders and sheets) moving through one portal. (iii) The algorithm was tested in both indoor and outdoor scenarios. The rest of the paper is organized as follows. Section 2 presents related work in RFID over metal and detection algorithms. Section 3 describes the experimental algorithm employed for analyzing radiofrequency variables and determining appropriate thresholds. Section 4 describes test and results. Section 5 concludes the paper.
2. Related Work The literature presents different techniques for distance or motion estimation using RFID. Examples include three-side approach [9], Direction of Arrival (DOA) [10–12], propagation variables such as RSSI levels [10], and measurements of phase angles [13, 14]. Nevertheless, these works employ more than one single element antenna, and they do not include moving metal objects. One example study employs lab experiments and simulations with one UHF passive RFID system. The research estimated speed and position of one tag going “In” and “Out” of the cover area. However, the model only includes interference from the indoor test area. Additionally, the study uses two antennas for movement characterization of nonmetal objects [15]. Research has employed other variables such as RSSI, phase angle rotation, and Doppler frequency shift to estimate tag speed in a bidirectional flow of objects in a warehouse. Tests used indoor and outdoor scenarios. Nonetheless, the study employs a four-antenna array located on the warehouse roof. Additionally, the paper does not include traceability of metal moving objects [8]. The study in [7] describes a system that tracks pallets leaving and entering an RFID portal as part of a warehouse management system. The main focus of this research was the control of false positive RFID tag reads, that is, tags unintentionally read but not interesting to the system. As a consequence, false positives make it difficult to distinguish pallets intentionally loaded onto the trucks and tags that appear in the reading field by accident. However, in the scenario described in [7] the use of RFID tags on shipments
transporting metal objects was not discussed. Moreover, the study exclusively uses RSSI information. Another study performs a time analysis of recorded readings to differentiate between static and moving tags. The study developed a method using RSSI, phase angle, and Doppler frequency. The method detects if a tag is static or moving by using the average value of Doppler frequency. Nevertheless, the study does not compute position of moving tags in an indoor scenario. Additionally, the work does not include metal surfaces [16]. Regarding RFID over metal surfaces, different studies show that UHF passive RFID tags require a dielectric separation from conductive materials for proper operation [4, 5]. The work in [17] recommends a distance greater than or equal to 2 centimeters (cm) for any transmission power. Another research analyzes changes in properties and electrical parameters of an UHF passive RFID tag when moving closer to a metal surface [18]. The research proposes special antenna designs for RFID applications over conducting objects. The study in [19] shows similar results. One example application of UHF passive RFID system in metal objects is used in [20] to identify pharmaceutical products packed in metal, glass, and plastic. Products move in a conveyor belt with programmable speeds between 0 m/s and 0.66 m/s. However, the system employs two reading antennas, one at each side of the belt.
3. Materials and Methods The proposed algorithm was developed by using an experimental method, performing intensive tests with one Impinj Speedway Revolution R420 portal reader [21], one LAIRD Technologies circular polarization antenna [22], and ShortDipole passive RFID tags [23] located over metal objects. The system works in the 902–928 MHz band [24]. The reader used 30 dBm transmission power. Tests employed different environments and two types of metal objects: cylinders (30 cm diameter, 1 m length) and galvanized sheets (1 m length, 0.7 meters wide). The main goal is to determine if the object is moving, its direction, and speed. The algorithm defines one out of two possible directions: towards the portal (“In”) or away from the portal (“Out”). Figure 1 shows the algorithm. This section details each one of the steps. 3.1. RFID Tag Detection and Variable Measurement. The algorithm includes a procedure similar to an inventory, where the reader is transmitting signals and registering the retransmitted signals from the tags during a specific time. The algorithm obtains three radiofrequency variables by using LLRP (Low-Level Reader Protocol) [25]. The three variables are Received Signal Strength Indicator (RSSI), phase angle rotation, and Doppler frequency shift. Since RFID passive systems use Frequency Hopping, the algorithm obtains all variables for each channel at the end of the inventory. The system uses 50 channels with 500 kHz each [21]. Since every frequency hop takes 300 milliseconds, the system finishes one sweep in 15 seconds.
International Journal of Distributed Sensor Networks
3
Start
Start
RFID tag detection and variable measurement
Δ𝜑i = 𝜑1 − 𝜑0
Δ𝜑i ≥ Thrph 1 ∨ Δ𝜑i ≤ Thrph 2
Variable processing
Yes Voting (2 out of 3) %RSSI changes ≥ Thr 1? ΔRSSI ≥ Thr 2? Δ𝜑 ≥ Thr 3?
No
𝜑_cnt = 𝜑_cnt + 1
Yes
No
RSSI1 ≠ RSSI0
Yes
Static tag Computation %RSSI changes ΔRSSI %𝜑 changes
Yes
No
RSSI_cnt = RSSI_cnt + 1
Moving tag To voting system AvSpeed > 0
Yes
Figure 2: Variable processing.
No In
Out
Next RFID tag
Figure 1: Detection algorithm.
3.2. Variable Processing. Figure 2 shows the initial process of each variable. The algorithm registers significant phase or RSSI changes with counters. The counters help to determine if a tag is static or moving. The first variable is phase change, Δ𝜑. The Impinj reader assigns 12 bits to phase values [0∘ , 360∘ ] with 0.088∘ resolution. Phase is periodical with distance and it repeats every 𝜆/2 [25]. Equation (1) shows total phase rotation in the IQ plane for a radiofrequency signal detected by the reader during identification time [15]: 𝜃 = 2𝜋 (
2𝑅 ) + 𝜃Tx + 𝜃Rx + 𝜃TAG , 𝜆
(1)
where 𝑅 is distance between reader and tag, 𝜆 is the wavelength of a particular carrier received at the reader, 𝜃Tx is phase variation during reader transmission, 𝜃Rx is phase variation produced when signal transmitted by the tag is received by the reader, and 𝜃TAG is phase variation due to tag reflection characteristics. One example of these characteristics is latency time before responding to Backscattering. Since it is not possible to know all values in (1), the research performed indoor and outdoor experiments for detecting metal objects in portals with ranges up to three meters. Using results and phase analysis, the research found
empirical thresholds for determining whether an object is moving or not. Figure 3(a) shows behavior of phase angle of static tags for indoor environments. Phase variation in Figure 3(a) is due to the system employing Frequency Hopping. As a consequence, each reading is detected through a different channel. Temporal analysis of the data is complex; thus, the research computed instant phase variation by using information in two consecutive detections. Figure 3(b) shows these results. Figure 3(b) shows that average values of phase differences gather around 0 radians. Even though most values are between −𝜋 and 𝜋, some values may reach ±2𝜋 radians. To determine the proportion of values outside [−𝜋, 𝜋] (called large variations), there was a new set of experiments using one static tag detected at specific distances, multiples of 𝜋, during 15 seconds. Tests were repeated 10 times. Therefore, there were 3000 data points for each distance. Tests computed the number of times a large variation occurs, given by 𝜑 cnt in Figure 2, out of the total number of detections. Figure 4 shows average values for the 10 repetitions with 95% confidence intervals for each distance. Figure 4 illustrates that, at 30 dBm power, the proportion of large variations is below 30% regardless of distance between reader and static tag. The research tested movement and found that proportion of large variations is always above 30%, regardless of speed. This value may be significant in identifying a static and a moving tag. Hence, the research tested the same two metal objects moving at different speeds and measured the proportion of large variations with 10 repetitions. Figure 5 shows average values with 95% confidence intervals, for In and Out directions in the indoor scenario. Figure 5 shows that all values for moving objects are above 30%. As a consequence, the algorithm established 30% as the threshold for proportion of large variations. If a tag is below 30%, it is defined as static. Otherwise, it is a moving tag.
7 6 5 4 3 2 1 0
Phase change Δ𝜑 (rad)
International Journal of Distributed Sensor Networks Phase angle (rad)
4
0
2
4
6
8 Time (s)
10
12
14
7 5 3 1 −1 −3 −5 −7
0
2
4
6
8 Time (s)
10
12
14
Cylinder Sheet
Cylinder Sheet
(b) Consecutive phase angle changes, Δ𝜑
(a) Phase angle
Average proportion of large variations in phase (%)
Figure 3: Consecutive detections in static tags.
35 30 25 20 15 10 5 0 0
0.5
1
1.5 2 2.5 Reader-tag distance (m)
3
3.5
Cylinder Sheet
Figure 4: Average proportion of large variations with 95% confidence intervals, static tag, and indoor environment.
The second variable presented in Figure 2 is RSSI. Initially, the algorithm computes the RSSI range as the absolute value of the difference between the maximum and minimum RSSI values, |RSSIMax − RSSIMin |. According to [7], this range should be smaller than 22 dB for static tags. Therefore, one can assume there may be a threshold for distinguishing a static from a moving tag. In order to estimate this threshold, the research evaluated RSSI results from the previous test with moving metal objects. Figure 6 shows the RSSI range values with 95% confidence intervals. According to Figure 6, all RSSI ranges are above 25 dB. Therefore, the algorithm establishes moving tags as those with RSSI ranges above 25 dB. The algorithm performs another step with RSSI: counting the number of changes in consecutive RSSI measurements for the same label. Impinj R420 reader measures RSSI with 0.5 dBm resolution [21]. Therefore, the algorithm counts one change if the difference in RSSI is greater than 0.5 dBm. The percentage of RSSI changes is computed as the ratio of the total number of changes, given by RSSI cnt in Figure 2, to the total number of RSSI values measured. Figures 7(a) and 7(b) show results of percentage RSSI changes for the two different metal objects with 95% confidence intervals, in indoor scenario. Figures 7(a) and 7(b) show that all values are above 50%. Therefore, the algorithm sets 50% as a threshold for distinguishing a moving tag from a static tag (below 50%).
3.3. Voting System. This step in Figure 2 compares the values of the three variables to each one of the thresholds. The first comparison verifies if percentage of RSSI changes is greater than or equal to 50% (Thr1). The second comparison determines if the RSSI range is greater than or equal to 25 dB (Thr2). The last comparison establishes if percentage of large variations in phase angle is greater than or equal to 30% (Thr3). If two out of three of these comparisons are true, the algorithm defines that the metal object is moving and proceeds to estimate speed and direction. 3.4. Direction of Movement. Recall that RSSI may provide an idea of movement direction, but values are highly random. Thus, the algorithm improves decisions by employing Doppler frequency. The algorithm computes instant speed V𝑖 using instant values of cannel frequency 𝑓𝑖 , Doppler frequency 𝑓𝐷𝑖 , and the speed of light in vacuum 𝑐, as shown in [26] 𝑐 V𝑖 = 𝑓𝐷𝑖 . (2) 𝑓𝑖 The algorithm computes average speed V with the mean value of all V𝑖 for all frequency channels. The sign of V provides the direction of movement: positive means “In” and negative means “Out”. Finally, the algorithm traces the object by computing the difference Δ𝑡 between two time stamps in two consecutive observations between successive frequencies, multiplied by average speed, V, as presented in Δ𝑥 = VΔ𝑡.
(3)
4. Results and Discussion 4.1. Algorithm Execution Example. This subsection illustrates algorithm behavior with a preliminary experiment using a metal object moving at certain speed and then stopping during an observation window of 15 seconds. The algorithm must classify one tag in either “static” or “moving” and the tag direction as “In” or “Out.” All results in Section 4 were similar for indoor, outdoor, metal cylinders, and sheets. Figure 8 shows results in the case of a metal sheet moving at 0.2 m/s in an outdoor environment, towards the sensor (In).
5
100 80 60 40 30%
20
0 0.0 0.1 0.2 0.3 0.4 0.5 0.6 0.7 0.8 0.9 1.0 1.1 1.2 1.3 Speed (m/s)
Average proportion of large variations in phase (%)
Average proportion of large variations in phase (%)
International Journal of Distributed Sensor Networks
100 80 60 40 30%
20
0 0.0 0.1 0.2 0.3 0.4 0.5 0.6 0.7 0.8 0.9 1.0 1.1 1.2 1.3 Speed (m/s)
Cylinder Sheet
Cylinder Sheet (a) “In” direction
(b) “Out” direction
50 45 40 35 30 25 20 15 10 5 0
25 dB
0.0 0.1 0.2 0.3 0.4 0.5 0.6 0.7 0.8 0.9 1.0 1.1 1.2 1.3 Speed (m/s) Cylinder Sheet
|RSSImax − RSSImin | (dB)
|RSSImax − RSSImin | (dB)
Figure 5: Average proportion of large variations in phase, indoor scenario.
50 45 40 35 30 25 20 15 10 5 0
25 dB
0.0 0.1 0.2 0.3 0.4 0.5 0.6 0.7 0.8 0.9 1.0 1.1 1.2 1.3 Speed (m/s) Cylinder Sheet
(a) “In” direction
(b) “Out” direction
Figure 6: RSSI range values.
Figure 8(a) shows phase changes over time. Figures 8(b) and 8(c) show RSSI levels and Doppler frequency levels, respectively. Figure 9 shows threshold values, obtained from the decision variables calculated in the earlier steps. During this test, the percentage of RSSI changes went from 68.2% at time 𝑡0 = 9.998 s to 21% at 𝑡1 = 10.002 s until the completion of the experiment. Also, the percentage of large variations in the phase angle (Thrph1 ≤ Δ𝜑 ≤ Thrph2) remained for the first 9.998 seconds at 59.8% and then changed to 19.6% for the remaining time, thus confirming the previous observation. Therefore, the algorithm estimates that the object stopped at 10 s. However, Figure 9 shows that RSSI ranges are 17.5 dB before 10 seconds and 2 dB after this time value. Both values are below the 25 dB decision threshold and this could mean that during the period of time from 0 s to 10.002 s the RFID tag remained static when in fact it was not. The algorithm resolves this conjuncture with a Voting System which requires fulfilling a minimum of two out of the three conditions to decide that the tag is moving. Therefore, the algorithm recognizes the percentage of RSSI changes and the proportion of large phase angle variations as sufficient information to determine that the object is in motion. The vertical red dotted line in Figures 8 and 9 represents the moment when the RFID tag changed from moving to
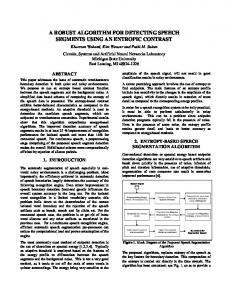
static. The RFID tag stopped at 1 m distance from the reader antenna. On the other hand, in order to determine whether the metal object direction is In or Out, the algorithm uses Doppler frequency. In this particular experiment, as it is shown in Figure 8(c), Doppler frequency values remain concentrated around 0.768 Hz for the first 10.002 seconds. From that moment on, frequency values vary around 0.15 Hz. Therefore, the algorithm determines that the object direction is “In.” Based on this information, the speed of the metal sheet and its position are estimated using (2) and (3). Figure 8(d) shows the final result of traceability estimation. 4.2. Results. Tests employed one tag located on a mobile metal object. Test environment included three static metal sheets with four tags on each one. Therefore, there is one target (mobile) tag and 12 interferer (static) tags. Figure 10 shows an upper view diagram of the test scenario. Tests used three metrics: (i) percentage of correct readings: moving tags detected as moving tags, (ii) percentage of false positives: static tags detected as moving tags, (iii) percentage of false negatives: moving tags detected as static tags.
100 90 80 70 60 50 40 30 20 10 0
50%
RSSI changes (%)
International Journal of Distributed Sensor Networks
RSSI changes (%)
6 100 90 80 70 60 50 40 30 20 10 0
0.0 0.1 0.2 0.3 0.4 0.5 0.6 0.7 0.8 0.9 1.0 1.1 1.2 1.3 Speed (m/s)
50%
0.0 0.1 0.2 0.3 0.4 0.5 0.6 0.7 0.8 0.9 1.0 1.1 1.2 1.3 Speed (m/s)
Cylinder Sheet
Cylinder Sheet (a) “In” direction
(b) “Out” direction
Figure 7: Percentage RSSI changes.
Moving metal sheet
Static metal sheet
Phase changes (rad)
1m 7 5 3 1 −1 0 −3 −5 −7
2
4
6
12
14
16
12
14
16
10
12
14
16
10
12
14
16
8 10 Time (s) (a)
RSSI (dBm)
0 −10 −20 −30 −40 −50 −60 −70
0
2
4
Time (s) 8 10
6
1.4 1.2 1 0.8 0.6 0.4 0.2 0 −0.2 0
Distance (m)
Doppler frequency (Hz)
(b)
2
4
6
8 Time (s) (c)
3.5 3 2.5 2 1.5 1 0.5 0
0
2
4
6
8 Time (s)
Estimated Real (d)
Figure 8: Variable behavior during algorithm execution. (a) Phase changes over time, (b) RSSI values, (c) Doppler frequency values over time, and (d) real and estimated distance.
International Journal of Distributed Sensor Networks
7 Moving metal sheet
𝜑_cnt
RSSI_cnt
RSSImax1 − RSSImin1 = 17.5 dB
90 80 70 60 50 40 30 20 10 0
90 80 70 60 50 40 30 20 10 0
RSSIchange1 = 68.2%
0
2
4
6
8 10 Time (s) (a)
%𝜑 changes = 59.8%
0
2
4
6
8 10 Time (s)
Static metal sheet RSSImax2 − RSSImin2 = 2 dB
1m
RSSIchange2 = 21% 12
14
16
%𝜑 changes = 19.6%
12
14
16
(b)
Figure 9: Variable counters behavior during the algorithm execution. (a) Percentage of RSSI changes and (b) percentage of large variations in phase angle.
Moving metal object
Out
In
Static metal sheet 2m Static metal sheet
1.5 m Static metal sheet 1m
Left
Right
Figure 10: Upper view of the test scenario. Distances are in meters.
Experiments employed five speeds between 0.2 m/s (meter per second) and 1 m/s, in 0.2 m/s steps. The speeds correspond to a fork lift moving objects in an industrial warehouse. The mobile sheet was tested in both directions “In” and “Out,” in two environments: indoor and outdoor. Test
employed 10 repetitions for each case. Percentage of false positives was 0% in all cases. Maximum percentage of false negatives was 12%. According to Figure 11, correct detections show no statistical difference at 90% confidence levels when comparing different movement directions, excepting 0.8 m/s speed. Therefore, the algorithm works essentially in the same way, regardless of movement direction for indoor conditions. Figure 12 shows Mobile Tag Detection in outdoor environment. Percentage of false positives was 0% in all cases. Maximum percentage of false negatives was 11%. Same as in the indoor case, Figure 12 shows no statistical differences at 90% confidence levels when comparing In and Out directions. Since percentage of false positives was 0 in all cases, the proposed algorithm correctly identifies static tags in metal sheets located in the cover area, up to 2 meters. Correct detections are always above 88% for both environments. The result guarantees proper detection in industrial warehouse applications where fork lifts move metal objects. Additionally, tests verified speed results from the algorithm in the experiments. Table 1 shows results for indoor environment. Table 1 shows the algorithm correctly detected direction of movement in all tests, as shown by the positive and negative signs in speed computations. Error seems to increase with speed. However, speeds smaller than 1 m/s present maximum
International Journal of Distributed Sensor Networks
Average correct detections (%)
8 110
Table 1: Comparison of speed results computed by the algorithm.
100
Nominal speed (m/s)
90
0,20 0,40 0,60 0,80 1,00
80 70
Out
Average algorithm speed (m/s)
Error (%)
Average algorithm speed (m/s)
Error (%)
0.2 0.34 0.52 0.77 0.72
0 15 13 4 28
−0.21 −0.41 −0.5 −0.67 −0.80
5 2 17 16 20
60 50 0
0.2
0.4
0.6 Speed (m/s)
0.8
0
1
0
0.5
1
Time (s) 1.5
2
2.5
3
−0.25 −0.5
Indoor “In” Indoor “Out”
110
Distance (m)
−0.75
Figure 11: Percentage average correct detections for indoor environments with 90% confidence intervals.
−1 −1.25 −1.5 −1.75 −2 −2.25
100 Average correct detections (%)
In
−2.5 −2.75
90
−3 Estimated distance Real distance
80
Figure 13: Estimated object distance in time. 70
60
50 0
0.2
0.4
0.6 Speed (m/s)
0.8
1
Outdoor “In” Outdoor “Out”
Figure 12: Percentage average correct detections for outdoor environments with 90% confidence intervals.
28% error, providing an adequate estimate for the same application mentioned above. Regarding traceability, the algorithm employs (3), in order to estimate object distance in time. Figure 13 shows results for 1 m/s speed and “Out” direction. Error increases with distance maybe due to difficult tag reading conditions for larger distances.
5. Conclusions The paper presented a novel multivariable algorithm for detection of mobile metal objects employing RFID. The
algorithm uses a simple hardware setup consisting of one commercial portal reader coupled with a single element antenna. The configuration allows detecting and tracing an object, computing object speed, and determining one of two directions: In and Out. Unlike other alternatives presented in the literature, the algorithm uses just three variables, namely, RSSI range defined as the difference between maximum and minimum RSSI values; percentage of RSSI changes, and percentage of variations in phase angles. The procedure compares these variables to specific thresholds. If two out of the three variables are above these values, a voting system decides the tag is moving. In this case, the algorithm also computes tag speed and direction. If more than one variable is below the threshold, the voting system identifies the tag as static. The algorithm was tested in both indoor and outdoor scenarios, with one tag in a mobile metal object and 12 static interferer tags. All experiments used the maximum transmitter power of the RFID reader (30 dBm). Results show the algorithm detected direction of movement and identified tags as “static” or “moving” with no errors for speeds smaller than or equal to 0.4 m/s. Detection errors (false negatives) increased with speedup to a maximum of 12% with a metal object moving at 1 m/s.
International Journal of Distributed Sensor Networks Regarding direction, the algorithm correctly identifies “In” and “Out” tags with all speeds. The process also computes speed values and object distance. All results show that error increases when speed increases. However, the maximum error value is 28%, found when computing speed. Additionally, results show no evidence of the hidden tag problem, since the target tag was detected all the time, despite the presence of interferer tags. This work is, to the best of our knowledge, the first one to synergistically integrate in one algorithm the use of one simple setup and several low-level reader variables to increase the reliability of a decision system for warehouse inventories. This algorithm decides not only whether the tag is moving or not, but also in which direction it is moving and estimating its speed and relative position. Future work should improve the speed estimation method, in order to decrease errors. Additional studies should include different moving directions (such as “Right” and “Left”) and different passive tags located over metal objects.
Conflict of Interests There is no conflict of interests regarding the publication of this paper.
Acknowledgments The authors thank the RFID Lab at Universidad del Norte for providing equipment and materials for this research. Also, the authors would like to acknowledge the support provided by Roberto Rossetti from Kereon RFID Solutions.
References [1] P. V. Nikitin and K. V. S. Rao, “Performance limitations of passive UHF RFID systems,” in Proceedings of the IEEE Antennas and Propagation Society International Symposium (APS ’06), pp. 1011–1014, Albuquerque, NM, USA, July 2006. [2] G. Zamora Gonz´alez, Radio Frequency Identification (RFID) Tags and Reader Antennas Based on Conjugate Matching and Metamaterial Concepts, Universitat Aut`onoma de Barcelona, Cerdanyola del Vall`es, Spain, 2013. [3] A. Kang, J. H. Park, L. Barolli, and H.-Y. Jeong, “A QoS model for a RFID enabled application with next-generation sensors for manufacturing systems,” International Journal of Distributed Sensor Networks, vol. 2013, Article ID 829691, 6 pages, 2013. [4] M. Kim and M. Kim, “Automated RFID-based identification system for steel coils,” Progress in Electromagnetics Research, vol. 131, pp. 1–17, 2012. [5] M. Kim, B. Song, D. Ju, E. Choi, and B. Cho, “Development of metallic coil identification system based on RFID,” in RFID, Radio Frequency Identification Fundamentals and Applications Design Methods and Solutions, C. Turcu, Ed., pp. 197–214, InTech, Rijeka, Croatia, 2010. [6] R. Li, H. Ding, S. Li, X. Wang, H. Liu, and J. Zhao, “An empirical study on hidden tag problem,” International Journal of Distributed Sensor Networks, vol. 2015, Article ID 526475, 12 pages, 2015.
9 [7] T. Keller, F. Thiesse, J. Kungl, and E. Fleisch, “Using lowlevel reader data to detect false-positive RFID tag reads,” in Proceedings of the Internet of Things (IOT ’10), vol. 7, pp. 1–8, IEEE, Tokyo, Japan, December 2010. [8] A. S. Toivonen, Identifying and controlling stray reads at RFID gates [M.S. thesis], Aalto University, Espoo, Finland, 2012. [9] P. Krishna, J. H. Fischer, Da. J. Husak, and R. A. Stephenson, “Scheduling in an RFID system having a coordinated RFID tag reader array,” Patent US2006/002280 A1, 2006. [10] M. Bolic, D. Simplot-Ryl, and I. Stojmenovic, RFID Systems: Research, Trends and Challenges, John Wiley & Sons, 2010. [11] H. Nogami, “Array antenna, tag communication device, tag communication system, and beam control method for array antenna,” US8362954 B2, 2013. [12] Y. Zhang, M. G. Amin, and S. Kaushik, “Localization and tracking of passive RFID tags based on direction estimation,” International Journal of Antennas and Propagation, vol. 2007, Article ID 17426, 9 pages, 2007. [13] J. C. Carrick and Y. G. Maguire, “Methods and Apparatuses for RFID Tag Range Determination,” Article ID 0109844, US2010/0109844 A1, 2010. ˇ [14] A. Povalaˇc and J. Sebesta, “Phase of arrival ranging method for UHF RFID tags using instantaneous frequency measurement,” in Proceedings of the 20th International Conference on Applied Electromagnetics and Communications (ICECom ’10), pp. 1–4, September 2010. [15] P. V. Nikitin, R. Martinez, S. Ramamurthy, H. Leland, G. Spiess, and K. V. S. Rao, “Phase based spatial identification of UHF RFID tags,” in Proceedings of the 4th Annual IEEE International Conference on RFID (RFID ’10), pp. 102–109, IEEE, April 2010. [16] H. Kamiya, “Rfid Tag Movement Distinguishing Method and RFID Tag Movement Distinguishing Program,” Patent EP2733644A4, 2015. [17] W. Navarro, Y. Ternera, J. C. Velez, and J. E. Candelo, “RFID system on electrical substation equipment,” in Proceedings of the IEEE 15th International Conference on Environment and Electrical Engineering (EEEIC ’15), pp. 15–20, Rome, Italy, June 2015. [18] B. Yu, F. J. Harackiewicz, and B. Lee, “RFID tag antennas mountable on metallic platforms,” in Radio Frequency Identification Fundamentals and Applications Design Methods and Solutions, T. Cristina, Ed., pp. 165–180, InTech, Rijeka, Croatia, 2010. [19] M. L. Ng, Design of high performance RFID systems for metallic item identification [Ph.D. thesis], University of Adelaide, Adelaide, Australia, 2008. [20] L. Catarinucci, R. Colella, M. De Blasi, L. Patrono, and L. Tarricone, “High performance UHF RFID tags for item level tracing systems in critical supply chains,” in Current Trends and Challenges in RFID, C. Turcu, Ed., chapter 10, pp. 187–208, InTech, Rijeka, Croatia, 2011. [21] Impinj, Speedway Revolution Installation and Operations Guide version 5.4.0, 2012. [22] Laird Technologies, “Circular Polarity RFID Panel Antenna PAL90209H PAR90209H Datasheet,” 2012. [23] Smartrac, Short Dipole Datasheet, Smartrac, 2013. [24] R. Aguirre, D. Altamar, J. Cristancho et al., “The grey area in wireless communications: a multiplatform experimental study,” in Proceedings of the 6th IEEE Latin-American Conference on Communications (LATINCOM ’14), pp. 1–6, IEEE, Cartagena de Indias, Colombia, November 2014.
10 [25] Impinj, Speedway Revolution Reader Application Note—Low Level User Data Support, Impinj, Seattle, Wash, USA, 2013. [26] M. A. Richards, Fundamentals of Radar Signal Processing, McGraw-Hill, 2nd edition, 2014.
International Journal of Distributed Sensor Networks
International Journal of
Rotating Machinery
Engineering Journal of
Hindawi Publishing Corporation http://www.hindawi.com
Volume 2014
The Scientific World Journal Hindawi Publishing Corporation http://www.hindawi.com
Volume 2014
International Journal of
Distributed Sensor Networks
Journal of
Sensors Hindawi Publishing Corporation http://www.hindawi.com
Volume 2014
Hindawi Publishing Corporation http://www.hindawi.com
Volume 2014
Hindawi Publishing Corporation http://www.hindawi.com
Volume 2014
Journal of
Control Science and Engineering
Advances in
Civil Engineering Hindawi Publishing Corporation http://www.hindawi.com
Hindawi Publishing Corporation http://www.hindawi.com
Volume 2014
Volume 2014
Submit your manuscripts at http://www.hindawi.com Journal of
Journal of
Electrical and Computer Engineering
Robotics Hindawi Publishing Corporation http://www.hindawi.com
Hindawi Publishing Corporation http://www.hindawi.com
Volume 2014
Volume 2014
VLSI Design Advances in OptoElectronics
International Journal of
Navigation and Observation Hindawi Publishing Corporation http://www.hindawi.com
Volume 2014
Hindawi Publishing Corporation http://www.hindawi.com
Hindawi Publishing Corporation http://www.hindawi.com
Chemical Engineering Hindawi Publishing Corporation http://www.hindawi.com
Volume 2014
Volume 2014
Active and Passive Electronic Components
Antennas and Propagation Hindawi Publishing Corporation http://www.hindawi.com
Aerospace Engineering
Hindawi Publishing Corporation http://www.hindawi.com
Volume 2014
Hindawi Publishing Corporation http://www.hindawi.com
Volume 2014
Volume 2014
International Journal of
International Journal of
International Journal of
Modelling & Simulation in Engineering
Volume 2014
Hindawi Publishing Corporation http://www.hindawi.com
Volume 2014
Shock and Vibration Hindawi Publishing Corporation http://www.hindawi.com
Volume 2014
Advances in
Acoustics and Vibration Hindawi Publishing Corporation http://www.hindawi.com
Volume 2014