A STATISTICAL METHOD
FOR
FORECASTING DEMOGRAPHIC TIME S ERIES C OUNTS
A STATISTICAL METHOD FOR FORECASTING DEMOGRAPHIC TIME SERIES COUNTS, WITH APPLICATION TO HIV/AIDS AND OTHER INFECTIOUS DISEASE MORTALITY IN SOUTHERN THAILAND Apiradee Lim and Chamnein Choonpradub Department of Mathematics and Computer Science, Faculty of Science and Technology, Prince of Songkla University, Pattani Campus, Thailand Abstract. This study investigated regional and temporal patterns of death reported from infectious diseases (including HIV/AIDS) in 14 provinces of southern Thailand over the period 19992004, using data obtained from the Thailand Bureau of Policy and Strategy, Ministry of Public Health. Causes of deaths were identified using the International Classification of Diseases 10th revision (ICD-10), and mortality incidence rates were then calculated using populations obtained from the 2000 population census. Poisson and negative binomial lagged observationdriven regression models for mortality incidence were fitted to the data separately for HIV/ AIDS and other infectious diseases. Overall, the hospital mortality rates started to increase sharply in 2003 - 2004. The in-hospital mortality for HIV/AIDS showed peaks in urban districts and decreased from north to south with mortality for males approximately double that of females. For other infectious diseases, an upward trend in hospital mortality age 40 and over started in 2003-2004, particularly among persons reported as dying from septicemia, while showing a slightly increasing trend for other infectious diseases. Identifying the real cause of hospital deaths recorded as septicemia would substantially improve hospital mortality data quality.
INTRODUCTION Accuracy and complete mortality data are important for sound health planning and policy making (Prasartkul and Vapattanawong, 2006). The prevailing perception in society is that the most reliable mortality data are those with cause of death certified in a hospital by medical professionals. However, such information is available for less than 30% of the estimated 50.5 million deaths occurring in the world each year (Murray and Lopez, 1997). In addition, hospital statistics tend to under-esCorrespondence: Chamnein Choonpradub, Department of Mathematics and Computer Science, Faculty of Science and Technology, Prince of Songkla University, Pattani Campus, Pattani 94000, Thailand. E-mail:
[email protected]; apiradee.s@ psu.ac.th Vol 38 No. 6 November 2007
timate the prevalence of mortality in underdeveloped countries, such as Ethiopia (Reniers et al, 2005). In Thailand, inaccurately recorded causes of death are still a major problem. Approximately 70% of deaths occur outside the hospital (Chuprapawan et al, 2003) and a substantial proportion of these deaths have “senility (senescence)” (ICD10 code R54) recorded as the cause. A study of the completeness of death registration in Kanchanaburi Province in Thailand estimated 12.5% of deaths were not registered (Prasartkul and Vapattanawong, 2006). Infectious diseases account for over a quarter of all global deaths (National Intelligence Council, 2000). The trend in infectious disease mortality has declined in developed countries due to better living conditions and health care (Gage, 1994; Dore et al, 1998; 1029
SOUTHEAST ASIAN J TROP MED PUBLIC H EALTH
Wolleswinkel-van den Bosch et al, 2001; Bi et al, 2003; Serraino et al, 2004) but some developing countries have reemerging infectious diseases (Chow et al, 2003). Infectious diseases are still a leading cause of death in Thailand (Rumakom et al, 2002; Rukumnuaykit, 2006). HIV and its complications was the leading cause of mortality among those age 25-44 years (Bureau of Policy and Strategy, 2002). Therefore, looking at HIV/AIDS separately from other infectious diseases should be useful in investigating disease trends. Although causes of death are more accurately recorded in hospitals, there is still substantial room for improvement. For example, for persons living in southern Thailand over the six year period 1999-2004, of 6,885 deaths in hospitals from infectious disease excluding HIV/AIDS, 61.2% had a principal diagnosis recorded as “septicemia, unspecified” (ICD10: A41.9), which says little about the actual cause. With this lack of information about the real causes of death both inside and outside hospitals, the aim of our study was to investigate and forecast regional and temporal patterns of deaths reported as infectious disease (including HIV/AIDS) in the 14 provinces of southern Thailand over the period 1999-2004. Using statistical models for time series counts in spatial regions to highlight unexplained data variation and deficiencies, such a study can assist health planners to improve the accuracy of the causes of death statistics.
MATERIALS AND METHODS Mortality data from 1999 to 2004 in 14 provinces of southern Thailand were obtained from the Bureau of Policy and Strategy, Ministry of Public Health. For these data, the principal diagnosis and demographic information are given on death certificates that include sex, age, occupation, marital status, place of residence, and date, place, diagnosing officer and
1030
principal diagnosis. The principal diagnosis is coded using the International Classification of Diseases in its 10th revision (ICD10). Population denominators were obtained from the Population and Housing Census of Thailand in the year 2000 undertaken by the National Statistics Office of Thailand. To simplify the effect of location of residence when calculating death rates, one or more contiguous districts in each province were grouped together to form “super-districts” containing populations of 200,000 on average (Table 1), where they are listed in order of geographical location from the northernmost to the southernmost in the region (keeping super-districts within the same province) with their 2000 census populations. Since age was included as a demographic determinant, it was divided into three groups: below 5 years of age, 5 to 39 years and 40 and over. The number of deaths in each demographic group defined by age and/or gender and super-district of residence of the deceased was aggregated in intervals of two months: January-February, March-April, etc, giving six annual seasonal periods. Incidence death rates per 1,000 persons for causes of death categories and per 100,000 persons for HIV/AIDS deaths in the demographic group resident in each superdistrict were calculated to analyze the levels and patterns of mortality. Poisson and negative binomial lagged observation-driven regression models (Venables and Ripley, 1999) for mortality incidence were fitted to the data. Correlations with death rates in preceding periods and other demographic groups were incorporated into these models using autoregressive terms. The simplest model is based on linear regression taking the outcome variable as the death rate in a cell indexed by super-district and a twomonth period, with super-district, season, and autoregressive terms as categorical determi-
Vol 38 No. 6 November 2007
A STATISTICAL METHOD
FOR
FORECASTING DEMOGRAPHIC TIME S ERIES C OUNTS
nants. More complex models included further demographic components separating in-hospital and outside-hospital deaths, age group, and gender, together with corresponding autoregressive terms.
stantial variations occur. However, they become stable when the lagged observations are log-transformed incidence rates using Equation (1), and a suitable generalized linear model based on the Poisson distribution is
Incidence rates generally have positively skewed distributions, so we transformed them by taking logarithms. To handle zero counts we defined the outcome as
ln (λijt )= ln (pij )+ µ + α i + β j + η s + ∑k =1 γ k y ij ,t − k + ρ y ij(α,t)−1 + δ y ij( β,t )−1 ,
(1)
where n is the number of disease cases in the cell, P is the population at risk, and K is a specified constant. Suppose that Nijt is a random variable denoting the reported number of mortality cases in a demographic group i, super-district j and two-month period t and nijt is the corresponding number observed. An observation-driven linear regression model with m lagged variables may be defined by the equation m
Yijt = µ + α i + β j + η s + ∑k =1 γ k y ij ,t − k + ρ y ij(α,t )−1 + δ y ij( β,t )−1 + ε ijt ,
(2) ( α) where yijt and yijt(β) denote the observed (transformed) incidence rates in all demographic groups other than i and in all superdistricts other than j, respectively; Y ijt is the outcome variable specified in Equation (1) and yijt the corresponding number observed, εijt is comprises a set of zero-mean independent Gaussian random variables, and s = mod (t, 6). We assume α1 = 0, β1 = 0 and η1= 0.
Davis et al (2003) suggested observationdriven generalized linear models (GLMs) for time series counts Nt based on the Poisson distribution with mean λt, where ln( λt) is expressed as an additive function of determinants and lagged observations on Nt. These models are not appropriate for disease epidemics because they express the mean of the process at time t as an exponential function of lagged observations on the same process and are thus numerically unstable when subVol 38 No. 6 November 2007
(3) where λijt is the mean of Nijt. Poisson models for disease counts are often over-dispersed due to spatial or temporal clustering of cases, in which case the negative binomial distribution is more appropriate. This distribution has an additional parameter γ and takes the form γ
Prob [N t = n] =
n
Γ(n + γ ) γ λt , Γ(n + 1)Γ(γ ) γ + λt γ + λt
(4)
The conditional expected value of Nt is λ t as in the Poisson model, but the conditional variance is now λ t + λt2 / γ (see for example, Venables and Ripley, 1999). The parameter γ is inversely related to the over-dispersion, with the Poisson model being the limit as γ ➝ .
8
Kn y = ln 1 + , P
m
We used maximum likelihood estimation to fit these GLMs. Deviance residuals (Venables and Ripley, 1999) can be plotted against normal scores with points close to a line with unit slope indicating that the fit is satisfactory. It should be noted that, as in all time series regression models that include lagged observations, the regression coefficients reflect the effects of the predictor variables on the outcomes after these outcomes have been adjusted for the autocorrelations, rather than the direct effects of the predictors on the outcomes. All analyses in this study were undertaken using R software (R Development Core Team, 2007).
RESULTS According to records from death certificates, 250,175 deaths were recorded among
1031
SOUTHEAST ASIAN J TROP MED PUBLIC H EALTH
Table 1 Populations (2000 census) of super-districts in southern Thailand. Super-district
Code
Chumphon North Chumphon South Ranong Surat Thani Northwest Surat Thani City Surat Thani East Surat Thani South Phang-nga Nakhon Si Thammarat North Nakhon Si Thammarat Northwest Nakhon Si Thammarat North Coast Nakhon Si Thammarat Central Nakhon Si Thammarat City Nakhon Si Thammarat South Coast Nakhon Si Thammarat Southwest Krabi North Krabi South Phuket Trang North Trang City Trang South Pattalung City Pattalung West Songkhla North Coast Songkhla West Songkhla City Hat Yai Songkhla Southeast Coast Songkhla South Satun Pattani City-West Pattani Central Pattani East Yala City Yala South Narathiwat Coast Narathiwat Central Narathiwat Southwest
1 2 3 4 5 6 7 8 9 10 11 12 13 14 15 16 17 18 19 20 21 22 23 24 25 26 27 28 29 30 31 32 33 34 35 36 37 38
Population
Year
Total
In hospital
Percent
246,279 199,927 161,210 243,238 241,373 168,801 215,998 234,188 176,496 163,187 212,903 164,324 267,560 238,059 297,282 130,564 205,646 249,446 184,815 190,340 219,955 251,029 247,442 149,706 205,607 162,700 324,596 177,396 235,657 247,875 253,567 219,932 122,486 228,042 187,495 250,997 234,441 176,912
1999 2000 2001 2002 2003 2004 Total
37,817 41,111 41,136 42,114 43,580 44,417 250,175
8,160 7,607 8,211 9,266 12,163 13,648 59,055
21.6 18.5 20.0 22.0 27.9 30.7 23.6
residents of 14 southern Thai provinces for the calendar years 1999 to 2004, corresponding to an average annual death rate of 5.16 per 1000 based the total population of 8.087 million residents according to the 2000 Population and Housing Census. Table 2 shows the 1032
Table 2 Percentages of hospital deaths in southern Thailand by year.
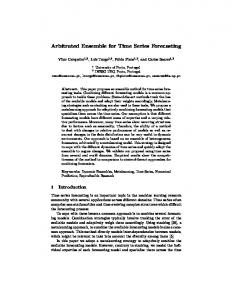
proportions of deaths in hospitals by year, where it can be seen that a jump in the percentage of hospital deaths occurred in 2003. Based on the ICD10 disease classification system and WHO recommendations (Mathers et al, 2002), we grouped causes of death into eight categories: (1) heart diseases (I00-I99), (2) infectious diseases other than HIV/AIDS (A00-A19, A25-B99, G00, G03G04, N70-N73), (3) respiratory diseases (J00J98), (4) HIV/AIDS (A20-A24), (5) cancer (C00C97), (6) injuries (V00-X99), (7) digestive system diseases (K00-92), and (8) other causes. Note that since 1999 pneumonia has been classified as a respiratory disease rather than an infectious disease. Table 3 shows the percentages of in-hospital deaths for each of the eight groups of diseases. The percentages of hospital deaths attributed to the digestive system, respiratory, heart, and infectious diseases other than HIV/ AIDS were all between 40 and 50%, and were around 30% for HIV/AIDS and cancer, and less than 20% of deaths were from injuries and other causes. For 59,619 (53.3%) of the non-hospital deaths from other causes, the cause of death given on the death certificate was “senility (senescence)”. This compares with only 2.5% of hospital deaths from other causes. For hospital deaths only, Fig 1 shows the Vol 38 No. 6 November 2007
A STATISTICAL METHOD
FOR
FORECASTING DEMOGRAPHIC TIME S ERIES C OUNTS
Table 3 Percentages of hospital deaths in southern Thailand by reported cause. Cause of death Heart disease Infectious diseases Respiratory diseases HIV/AIDS Cancer Injuries Digestive system diseases All other causes Total
Total 27,168 15,007 16,021 7,546 20,850 47,180 4,582 111,821 250,175
distribution of the causes of mortality by super-district. The chart shows a broad trend of decreasing in-hospital mortality with increasing distance south (away from Bangkok). The peaks in the chart correspond to the superdistricts containing urban districts, notably the island of Phuket (18) and the districts of Songkhla City (26) and Hat Yai (27) in Songkhla Province. The lower troughs correspond to the central districts of Pattani Province (comprising many rural villages) and most of Narathiwat Province. The causes of death due to infectious disease were divided into 2 groups: deaths due to HIV/AIDS and deaths due to infectious diseases other than HIV/AIDS. The first group comprises of HIV/AIDS deaths both in and outside the hospital. The principal diagnosis was specific in each case. We excluded persons below aged 15 and separated the data cells by gender, but not by age group. For the second group, comprising infectious disease deaths excluding HIV/AIDS, we separated the data cells according to whether or not the principal diagnosis was unspecified septicemia, but only considered in-hospital deaths, given that the percentage of deaths so diagnosed outside hospital was less than 30%, compared with more than 60% in
Vol 38 No. 6 November 2007
In hospital 11,672 6,885 6,445 2,392 5,969 8,371 2,196 15,125 59,055
Percent 43.0 45.9 40.2 31.7 28.6 17.7 47.9 13.5 23.6
the hospital. In this analysis we also separated the data by gender, but restricted analysis to those age 40 or older, because the number of deaths due to “unspecified septicemia” was much less frequent in persons in younger age groups. HIV/AIDS mortality
Fig 2 shows the HIV/AIDS mortality rate per 100,000 residents in super-districts inside hospitals (inner bands) and outside hospitals (outer bands) for males (right panel) and females (left panel). The rates for males are approximately double those for females. The pattern for hospital mortality for HIV/AIDS was similar to that shown for all disease groups in Fig 1, namely, decreased mortality as one moves south with peaks in Phuket and Songkhla City (but not Hat Yai). Nakhon Si Thammarat had a particularly high outsidehospital mortality rate for this disease. Table 4 (super-district effects) and Fig 3 (other effects and residuals plot) show the results of fitting a negative binomial GLM. The model is defined by equations (1), (3) and (4) with m = 3 autoregressive lag terms, and taking gender as the demographic group with a minor modification, namely that we allow different parameters ρ1 and ρ2 for each gender. We separated cells according to whether the death occurred inside or outside the hospital
1033
SOUTHEAST ASIAN J TROP MED PUBLIC H EALTH Death rate per 1,000
Super-district
Heart disease
Infectious disease
Respiratory
HIV/AIDS
Cancer
Injuries
Digestive
Other
Fig 1–Distribution of hospital death rates by residence location of deceased.
and included an additional parameter in the model for this effect. We also chose K = 500,000, because substantially lower values for K give autoregressive coefficients that have a sum greater than 1 (unstable models). The residuals plot indicates that the model fits extremely well. Although the coefficients for the lagged terms relating the death rate in a super-district to the rates in preceding periods in the same super-district low (0.15, 0.14 and 0.09 for lags 1, 2 and 3, respectively) the coefficient of the lagged term from other super-districts was more substantial (0.49), and their sum was 0.98, with the result that the correlation-adjusted outcome 1034
is close to the relative increase in mortality rather than its absolute level. The largest coefficient corresponds to the gender effect, thus indicating that female death rates were not only substantially lower than male rates (as seen in Fig 2) but also increased to a lesser extent than male rates. Table 5 shows the results after fitting negative binomial GLMs to the same data with the autoregressive terms excluded. These results may be used to compare the absolute (rather than autocorrelation-adjusted) HIV/ AIDS death rates with respect to the risk factors. Since negative binomial GLMs are not hierarchical, in the sense that the residual deVol 38 No. 6 November 2007
A STATISTICAL METHOD
FOR
FORECASTING DEMOGRAPHIC TIME S ERIES C OUNTS Death rate per 1000,000
In hospital
Outside hospital
Super-district
Female
Male
Fig 2–Distribution of death rates for HIV/AIDS by gender, place of death (in or outside hospital) and residence location.
viance decreases when additional parameters are included, unless the dispersion parameter is held constant, Table 5 also includes the results obtained by fixing the dispersion parameter at its value estimated by the model containing all the auto-regressive parameters. It shows that the fitted coefficients change only slightly, but the residual deviance is increased substantially, as expected. Fig 4 shows the forecasts based on the full model (Table 4 and Fig 3).The inclusion of the autoregressive time series parameters enables the forecasts to make use of the most recent available information, and thus these forecasts can track the paths of the epidemic reasonably well. The graph clearly shows that reported HIV/AIDS mortality outside the hosVol 38 No. 6 November 2007
pital declined after peaking around the middle of 2003, with a similar but less pronounced pattern for in-hospital mortality among males. Given that overall in-hospital death rates continued to increase in 2004 (Table 2) we examined trends for other disease groups. Infectious disease mortality (excluding HIV/AIDS)
We fitted the negative binomial GLM specified in Equations (1), (3) and (4) to nonHIV/AIDS infectious disease hospital death data, with m = 3 lags, with no demographic subgroups. We separated cells according to whether or not the death had “unspecified septicemia” as its principal cause and included an additional parameter in the model for this effect. We also chose K to be 1035
SOUTHEAST ASIAN J TROP MED PUBLIC H EALTH
Table 4 Regression coefficients and standard errors for super-district effects in negative binomial GLM fitted to HIV/AIDS mortality in southern Thailand. Code Coefficient 1 2 3 4 5 6 7 8 9 10
0 -0.383 -0.046 -0.430 -0.193 -0.025 -0.348 -0.142 -0.081 -0.172
SE 0.143 0.205 0.113 0.102 0.182 0.130 0.106 0.125 0.177
Predictor Constant Season: Jan - Feb Mar - Apr May - Jun Jul - Aug Sep - Oct Nov - Dec Female gender Inside hospital Autoregressive Lag 1 Lag 2 Lag 3 Other districts Lag 1 Female to male Lag 1 Male to female Lag 1 Dispersion parameter
Code Coefficient 11 12 13 14 15 16 17 18 19 20
-0.122 -0.333 -0.013 -0.014 -0.127 -0.464 -0.511 0.163 -0.523 -0.598
Coeff.
SE
-0.848
0.965
0 0.021 0.079 -0.030 -0.063 -0.184 -0.583 -0.105 0.152 0.143 0.086 0.490 0.010 0.102 5.041
0.053 0.053 0.052 0.052 0.053 0.317 0.040 0.014 0.014 0.014 0.433 0.397 0.351 0.473
SE 0.103 0.214 0.209 0.102 0.112 0.308 0.157 0.096 0.188 0.168
Code Coefficient 21 22 23 24 25 26 27 28 29 30
-0.491 -0.170 -0.394 -0.230 -0.272 0.045 -0.373 -0.753 -0.598 -0.676
SE
Code
Coefficient SE
0.138 0.105 0.114 0.226 0.140 0.182 0.153 0.209 0.128 0.130
31 32 33 34 35 36 37 38
-0.722 -1.467 -0.823 -0.758 -0.955 -1.826 -0.910 -1.361
K
500,000
0.129 0.222 0.353 0.143 0.232 0.223 0.160 0.275
HIV/AIDS mortality among persons age 15
Male
Forecast
Female
Forecast
Year
Fig 4–HIV/AIDS mortality forecasts based on past observations in two-month periods for persons age ≥15.
Predictor Constant Season: Jan - Feb Mar - Apr May - Jun Jul - Aug Sep - Oct Nov - Dec Diagnosis: Other cause Unspecified septicemia Autoregressive Lag 1 Lag 2 Lag 3 Other districts Lag 1 Dispersion parameter
Coefficent -1.891 0 -0.022 -0.028 0.007 -0.263 -0.174 0 0.089 0.077 0.014 0.038 0.814 8.300
SE 0.146 0.067 0.067 0.064 0.067 0.066 0.050 0.014 0.013 0.013 0.046 1.400
Other studies have used statistical models for time series counts in spatial regions to account for unexplained data variation, spatial correlation and deficiencies (Rutaremwa, 2000; Congdon, 2006; Lix et al, 2006). Poisson models and Generalized Linear Models with Generalized Estimation Equations (GLM with GEE) have been described by Congdon (2000)
Hospital infectious disease mortality among persons age >40 Deviance residuals
Normal scores
Residual deviance: 2765.2
df: 2460
Fig 5–Coefficients for other model parameters and deviance residuals plot for hospital infectious disease mortality.
1038
Vol 38 No. 6 November 2007
A STATISTICAL METHOD
FOR
FORECASTING DEMOGRAPHIC TIME S ERIES C OUNTS
Hospital infectious disease mortality in those age >40 Number of deaths Other Septicemia
Forecast Forecast
Year
Fig 6–Hospital infectious disease mortality forecasts based on past observations in two-month periods for persons age ≥40.
and Lix et al (2006). In our study, the overdispersion violated the Poisson model assumption, so a negative binomial GLM was used instead. Spatial-time series modeling of the pattern of HIV/AIDS mortality revealed reported incidence rates for males were approximately double those for females and mortality more than doubled in the four years from 1999 to 2003, then declined almost as much in the next two years. This finding is similar to that reported by Rumakom et al (2002). Reported HIV/AIDS mortality outside hospitals declined after peaking in the middle of 2003 but less so for in-hospital mortality among males. The HIV/AIDS mortality trends agree with the projections for HIV/AIDS in Thailand 2000-2020 (Thai Working Group on HIV/AIDS Projection, 2001). Even though HIV/AIDS mortality rates are known to be underreported (Rumakom et al, 2002) this did not have an appreciable effect on overall mortality. In regards to mortality due to other infectious diseases, we evaluated those who died in the hospital due to unspecified septicemia or other causes in those age 40 and over. Statistic regarding deaths from infectious disease outside the hospital in Thailand are known to be unreliable (Chuprapawan et al, 2003) so only in-hospital deaths were considered. Spatial-
Vol 38 No. 6 November 2007
time series modeling revealed the reported incidence rate for each diagnostic class was stable from 1999 until the end of 2002, when a sharp increase occurred in septicemia mortality. Septicemia itself is not the cause of death, but a symptom. There are many causes of death leading to septicemia. A study of risk factors for septicemia mortality in older adults in the United States reported that septicemia mortality was associated with a history of diabetes or cancer (Salive et al, 1993).
Our study raises questions about the real causes of death attributed to unspecified septicemia and to HIV/AIDS in southern Thailand. Further studies are needed to answer these questions.
ACKNOWLEDGEMENTS We are grateful to Prof Don McNeil for his helpful guidance, encouragement and invaluable assistance. Thanks are also due to the Thailand Bureau of Policy and Strategy, Ministry of Public Health for generously providing the data. This study was funded by the Graduate School, Prince of Songkla University.
REFERENCES Bi P, Whitby M, Walker S, Parton KA. Trends in mortality rates for infectious and parasitic diseases in Australia: 1907-1997. Intern Med J 2003; 33: 152-62. Bureau of Policy and Strategy, Ministry of Public Health. Thailand health profile 1999-2000. Bangkok: Express Transportation Organization, 2002. Chow KM, Wu AK, Szeto CC. Secular trend in medical education regarding infectious disease. Med Educ 2003; 37: 881-3. Chuprapawan C, Porapakkham Y, Jirawatkul A, Paoin W. Report on the study of causes of
1039
SOUTHEAST ASIAN J TROP MED PUBLIC H EALTH death of Thailand population who died within one year during 1997-1999 in 16 provinces in Thailand. Nonthaburi: Ministry of Public Health, 2003. Congdon P. A model framework for mortality and health data classified by age, area, and time. Biometrics 2006; 62: 269-78. Davis R, Dunsmuir W, Streett S. Observation-driven models for Poisson counts. Biometrika 2003; 90: 777-90. Dore GJ, Li Y, Plant AJ, Kaldor JM. Trends in infectious disease mortality in Australia, 19791994. Med J Aust 1998; 168: 601-4. Gage TB. Population variation in cause of death: level, gender, and period effects. Demography 1994; 31: 271-94. International Labour Office. A technical note to the Government: Financing Universal Health Care in Thailand. Geneva: The International Labour Office, 2004. Lix LM, Ekuma O, Brownell M, Roos LL. A framework for modeling differences in regional mortality over time. J Epidemiol Commun Health 2006; 58: 420-5. Mathers CD, Stein C, Fat DM, et al. Global burden of disease 2000: Version 2 methods and results. Global Programme on Evidence for Health Policy. Geneva: World Health Organization, 2002; Discussion Paper No.50: 55-59. Murray CJ, Lopez AD. Mortality by cause for eight regions of the world: Global Burden of Disease Study. Lancet 1997; 349: 1269-76. National Intelligence Council. National intelligence estimate: the global infectious disease treat and its implications for the United States. Environ Change Secur Proj Rep 2000; Issue 6: 33-65. National Statistical Office. The 2000 population and housing census, southern region. Bangkok: Statistical Data Bank and Information Dissemination Division, National Statistical Office, 2002. Prasartkul P, Vapattanawong P. The completeness of death registration in Thailand: Evidence from demographic surveillance system of the Kanchaburi project. World Health Popul 2006. [Cited 2006 Dec 8]. Available from: URL:
1040
(http://www.longwoods.com) R Development Core Team. R: A language and environment for statistical computing. Vienna, Austria: R Foundation for Statistical Computing, 2007. [Cited 2007 Jan 8]. Available from: URL: http://www.R-project.org Reniers G, Araya T, Schaap A, et al. Monitoring cause-specific adult mortality in developing countries: a comparison of data sources for Addis Ababa and its implications for policy and research. Soc Sci Med 2005; 61: 1952-7. Rukumnuaykit, P. Mortality and causes of death in Thailand: evidence from the survey of population change. Asia-Pacific Popul J 2006; 21: 67-84. Rumakom P, Prasartkul P, Punpuing S. Change to the epidemiological transition in Thailand due to HIV/AIDS: Implications for population and health policies. The 2002 IUSSP Regional Population Conference, Nakhon Pathom: Institute for Population and Social Research, Mahidol University, 10-12 June 2002. Rutaremwa G. Analysis of regional differentials in under-five mortality in Kenya using a countdata regression model. The African Census Analysis Project (ACAP), Population Studies Center. Philadelphia, Pennsylvania: University of Pennsylvania, ACAP working Paper 14, March 2000. Salive ME, Wallace RB, Ostfeld AM, Satterfield S, Havlik RJ. Risk factors for septicemia-associated mortality in older adults. Public Health Rep 1993; 108: 447-53. Serraino D, Bidoli E, Piselli P, et al. Time trends in infectious disease mortality in Italy: 19691999. Epidemiol Prev 2004; 28: 322-9. Thai Working Group on HIV/AIDS Projection. Projections for HIV/AIDS in Thailand: 2000-2020. Bangkok: Karnsana Printing Press, 2001. Venables WN, Ripley BD. Modern applied statistics with S. 3 rd ed. New York: Springer-Verlag, 1999: 217, 233. Wolleswinkel-van den Bosch JH, van Poppel FW, Looman CW, Mackenbach JP. The role of cultural and economic determinants in mortality decline in the Netherlands, 1875/1879-1920/ 1924: a regional analysis. Soc Sci Med 2001; 53: 1439-53.
Vol 38 No. 6 November 2007