A Support Vector Machine Ensemble for Cancer Classification Using Gene Expression Data Chen Liao and Shutao Li College of Electrical and Information Engineering, Hunan University, Changsha 410082, China
[email protected]
Abstract. In this paper, we propose a support vector machine (SVM) ensemble classification method. Firstly, dataset is preprocessed by Wilcoxon rank sum test to filter irrelevant genes. Then one SVM is trained using the training set, and is tested by the training set itself to get prediction results. Those samples with error prediction result or low confidence are selected to train the second SVM, and also the second SVM is tested again. Similarly, the third SVM is obtained using those samples, which cannot be correctly classified using the second SVM with large confidence. The three SVMs form SVM ensemble classifier. Finally, the testing set is fed into the ensemble classifier. The final test prediction results can be got by majority voting. Experiments are performed on two standard benchmark datasets: Breast Cancer, ALL/AML Leukemia. Experimental results demonstrate that the proposed method can reach the stateof-the-art performance on classification. Keywords: Support Vector Machine, Wilcoxon Rank Sum Test, Gene Selection, Ensemble Classifier, Classification Accuracy.
1 Introduction Accurate cancer diagnosis is crucial for the successful application of specific therapies nowadays. Recent studies show that DNA microarrays can provide useful information for cancer classification at the gene expression level because of their ability to measure the large quantity of messenger ribonucleic acid (mRNA) transcripts for genes simultaneously [1]. There are many classification methods used in cancer diagnosis. Such as K-nearest neighbor (KNN), neural network, SVM and so on. KNN uses an integer parameter K. Provided an input, the algorithm finds the K closest training data points to the input, and then the label of the input based on the label of the K points will be predicted [2]. Neural network is also often used in cancer classification. It contains some structure consisting of a certain number of hidden layers and one output layer. Among the different training procedures of neural networks, the back propagation algorithm with adaptive learning and momentum is most popular and is often utilized. The learning algorithm will not be stopped until the classification performance of the validation set starts to diverge from that of the training set [3]. SVM is one of the most popular I. Ma˘ ndoiu and A. Zelikovsky (Eds.): ISBRA 2007, LNBI 4463, pp. 488–495, 2007. © Springer-Verlag Berlin Heidelberg 2007
A SVM Ensemble for Cancer Classification Using Gene Expression Data
489
cancer classification methods. If the data is linearly separable, it computes the hyperplane which maximizes the margin between the training samples and the class boundary. And when the data is not linearly separable, the samples are projected into a high dimensional space where such a separating hyperplane can be found [4]. SVM ensemble is actually a type of cross-validation optimization of single SVM with a more stable classification performance than other models. In this paper, a SVM ensemble classification method is proposed. We construct SVM ensemble classifier. The first SVM uses all of the training samples, and the next two SVMs respectively use the samples, which are incorrectly classified or low confidence obtained by the preceding SVM. This paper is organized as follows. In next section, the basic theory of SVM is introduced. In section 3, the new classification method is proposed. In section 4, the experimental results are shown, and in the last section, the paper is concluded.
2 Support Vector Machines SVM has been considered as a widely used classification approach of statistical learning theory. The training set is supposed to be {( xi , yi )}iN=1 , with each input
xi ∈ R m and yi ∈ {±1} . The SVM projects x to z = ϕ ( x ) in a Hilbert space F by a nonlinear map ϕ : Rm → F . The dimensionality of F is very high in most conditions. When the data is linearly separable in F , a hyperplane ( w, ϕ( x) + b) is constructed by the SVM, the separation between the positive and negative examples is maximized for the hyperplane. By minimizing ||w||, the w for the optimal hyperplane is obtained, N and the solution can be presented as w= αi yi ϕ( xi ) for some certain α i ≥ 0 . The
∑
i =1
vector of α i 's, Λ = (α i ,..., α N ) , can be obtained by solving the following quadratic programming problem: maximize W ( Λ ) = ΛΤ 1 − 1 ΛΤQ Λ ,
(1)
2
with respect to Λ , subject to the constraints Λ ≥ 0 and ΛΥ = 0 . Here, Υ Τ = ( y1 ,..., y N ) and Q are symmetric matrixes with elements
Qij = yi y j ϕ( xi ),ϕ( x j ) .
(2)
For those α i 's greater than zero, the relevant training examples should lie along the margins of the decision boundary, and these are defined as the support vectors. However, due to the high dimensionality of F and ϕ( xi ) and ϕ( x j ) in (2), the way is not so impractical. An important characteristic of the SVM, and of kernel methods in general, plays a crucial part here. It is that one can gain ϕ( xi ), ϕ( x j ) in (2) without explicit ϕ( xi ) and ϕ( x j ) first, this is realized by using kernel function. The kernel methods provide good tools to process, analyze, and compare many types
490
C. Liao and S. Li
of data, and provide state-of-the-art performance in many cases. Here some kinds of kernel functions are introduced as follows: 1 linear kernel
○
K L ( x, y ) = xT y ,
(3)
where x is the value of the independent variable for which one seeks an estimate, and y are the values of the independent variable in the data. 2 polynomial kernels
○
K P ( x, y ) = ( xT y )d , where d is the degree of the polynomial, its kernel
(4)
K p of degree 2 is corresponding to
a feature space spanned by all products of two variables, that is, { x12 , x1 x 2 , x22 } .
○ Gaussian RBF kernel 3
2 K G ( x , y ) = exp( − σ ∗ x − y ) ,
(5)
where σ is a parameter, the Gaussian kernel is one of the most popular utilized kernels in practice due to its capacity to produce nonparametric classification functions [5].
3 Proposed Method We suppose a gene expression dataset with M genes (features) and N samples (observations) be represented by the following matrix:
⎡ x11 ⎢x X = ⎢ 21 ⎢ # ⎢ ⎣ xM 1
x12 x22 # xM 2
x1N ⎤ " x2 N ⎥⎥ , % # ⎥ ⎥ " xMN ⎦ "
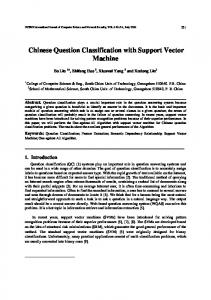
where xij is the measurement of the expression level of gene i in sample j. Let xj = (x1j, x2j, ..., xMj) denote the jth sample of X, and yj the corresponding class label (e.g, tumor type or clinical outcome). The schematic diagram of the proposed method is shown in Figure 1. Step 1: Preprocessing using Wilcoxon rank sum test Due to the small size of training set, leave-one-out cross validation (LOOCV) is utilized to select the training set and the testing set. The statistics formula of Wilcoxon rank sum test is:
s( g ) =
∑ ∑ I ((x
i∈N +1 j∈N −1
(g) j
− x(i g ) ) ≤ 0) ,
where I is the discrimination function, if the logic expression in the bracket is true, the value of I is 1, or else it is 0. xi( g ) is the expression value of the sample i in the gene g. N +1 and N −1 are the index sets of different classes of samples. s ( g ) can represent the measurement of the difference between the two classes. When it is closer to 0 or
A SVM Ensemble for Cancer Classification Using Gene Expression Data
491
closer to the max value of n+1n−1 (here n+1 = N +1 , n−1 = N −1 ), the corresponding gene is more important to the classification. So according to (6), the importance degree of gene can be calculated [6]:
q ( g ) = max( s( g ), n−1n+1 − s ( g )) .
(6)
Genes are ranked according to q ( g ) , and the top m genes are selected to form a new training subset.
Fig. 1. The proposed method of SVM ensemble classification
Step 2: Constructing SVM ensemble classifier Using each new training set, we train SVM1, and SVM1 is tested by the training set itself to obtain the prediction results. Then we select the samples with incorrect prediction result or low confidence to train SVM2, and SVM2 is also tested. As the same, SVM3 can be obtained. Finally, SVM ensemble classifier is composed of these three SVM together. The value of confidence is defined as:
f ( x) = wTϕ ( x) + b . And the dual form is
f ( x) =
∑α
j∈ SV
j
y j K (x j , x) + b ,
where α j is Lagrange multiplier, and y j represents for the jth support vector.
492
C. Liao and S. Li
Step 3: Classification The testing set is fed into the ensemble classifier, and there are three classification results from the three SVM classifiers. We use majority voting to decide the final classification result, that’s to say, if more than one classifier show the result to be +1, the final classification result will be +1, otherwise it will be -1.
4 Experimental Setup and Results 4.1 Setup The gene selection and classification performance of the proposed method is evaluated by two benchmark datasets: Breast cancer dataset: It consists of a total of 38 samples, 18 of them are ER+ (estrogen receptor) samples while the remaining 20 are ER-. Each sample contains expression values of 7129 genes [7]. ALL/AML Leukemia dataset: It contains a total of 72 samples of two types of leukemia: 25 of acute myeloid leukemia (AML) and 47 of acute lymphoblastic leukemia (ALL). Each sample contains expression values of 7129 genes [8].
4.2 Experimental Results In our experiments, the samples with error classification result or confidence less than 1 are used to construct the next classifier. For Breast cancer dataset, the numbers of training sample of SVM1, SVM2 and SVM3 are respectively 37, 13 and 11. And for Leukemia dataset, the numbers are respectively 71, 17 and 16. Table 1 shows the classification accuracy of Breast cancer dataset with different parameters, and Table 2 shows the results of Leukemia dataset. In these tables, m is the number of the informative genes selected by Wilcoxon rank sum test. Gaussian kernel is used and there are two parameters σ and C for each SVM. σ1 , C1, σ 2 , C2, σ 3 and C3 represent the corresponding σ and C for SVM1, SVM2 and SVM3 , respectively. Because σ1 and C1 have the most obvious effect on the classification results, we only list the effect of σ1 and C1 in the tables for the length limit. Table 3 shows the classification accuracy obtained by single SVM classifier, and Gaussian kernel is also used with the value of σ set to 0.0001. For Breast cancer, it can reach the prediction result of 100%, and for Leukemia dataset, it’s only 97.2%. Compared to the results using single SVM classifier, we can conclude that SVM ensemble classifier can obtain better and more stable prediction results. Table 4 shows the performance of various methods on the two datasets as reported in the literature. All these methods use LOOCV and so their classification accuracies can be directly compared. As can be seen, the proposed method, which attains the best classification accuracy (of 100%) on both of Breast cancer dataset and Leukemia dataset, outperforms most of the methods. The JCFO (Joint Classifier and Feature Optimization) [9] with linear kernel can also attain 100% on Leukemia dataset, however, JCFO relies on the Expectation-Maximization (EM) algorithm [9] and is much slower.
A SVM Ensemble for Cancer Classification Using Gene Expression Data
493
As can be seen, for both Breast cancer and Leukemia data, SVM ensemble can reach the best classification performance 100%. Table 1. Classification accuracy (%) of Breast cancer data ( σ 2 =0.1, C2=10, C3=100) m
σ1 0.1
50
0.01 0.001 0.1
70
0.01 0.001 0.1
90
0.01 0.001
C1
Classification accuracy
10 100 10 100 10 100 10 100 10 100 10 100 10 100 10 100 10 100
100.0 100.0 100.0 100.0 100.0 100.0 100.0 100.0 100.0 100.0 100.0 100.0 100.0 100.0 100.0 100.0 100.0 100.0
Table 2. Classification accuracy (%) of Leukemia data ( σ 2 =0.001, C2=10, m
σ1 0.01
50
0.001 0.0001 0.01
70
0.001 0.0001 0.01
90
0.001 0.0001
C1
Classification accuracy
1 10 1 10 1 10 1 10 1 10 1 10 1 10 1 10 1 10
98.6 98.6 98.6 98.6 98.6 98.6 97.2 97.2 97.2 97.2 97.2 97.2 100.0 98.6 100.0 98.6 100.0 98.6
σ 3 =0.01,
σ 3 =0.01, C3=10)
494
C. Liao and S. Li Table 3. Classification accuracy (%) obtained by single SVM classifier m 30
50
70
90
C 1 100 1000 1 100 1000 1 100 1000 1 100 1000
Breast cancer 52.6 89.5 100.0 52.6 100.0 100.0 52.6 100.0 100.0 52.6 100.0 100.0
Leukemia 65.3 81.9 94.4 65.3 88.9 97.2 65.3 93.1 97.2 65.3 95.8 97.2
Table 4. Classification accuracy (%) obtained by various methods Classifier Adoboost (decision stumps) [10] SVM (quadratic kernel) [10] SVM (linear kernel) [10] RVM (linear kernel) [9] RVM (no kernel) [9] Logistic regression (no kernel) [9] Sparse probit regression (quadratic kernel) [9] Sparse probit regression (linear kernel) [9] Sparse probit regression(no kernel) [9] JCFO (quadratic kernel) [9] JCFO (linear kernel) [9] Proposed method
Breast cancer --97.4 94.7 89.5 --
Leukemia 95.8 95.8 94.4 94.4 97.2 97.2
--
95.8
97.4
97.2
84.2 -97.4 100.0
97.2 98.6 100.0 100.0
5 Conclusion A SVM ensemble classification method is proposed in this paper. Experiments are performed on the Breast cancer and Leukemia datasets. While the use of single SVM classifier does not yield satisfactory results, the ensemble classifier shows the superior classification performance on both of the datasets, and the classification performance of both datasets can reach to a state-of-the-art level. The SVM ensemble classification method proves to be a reliable method.
Acknowledgement This paper is supported by the National Nature Science Foundation of China (No. 6040204), Program for New Century Excellent Talents in University, and the Excellent Youth Foundation of Hunan Province (06JJ1010).
A SVM Ensemble for Cancer Classification Using Gene Expression Data
495
References 1. Wang, Y., Tetko, I. V., Hall, M. A., Frank. E., Facius. A., Mayer, K. F. X., Mewes, H. W.: Gene Selection from Microarray Data for Cancer Classification—A Machine Learning Approach. Computational Biology and Chemistry 29 (2005) 37-46 2. Li, T., Zhang, C., Ogihara, M.: A Comparative Study of Feature Selection and Multiclass Classification Methods for Tissue Classification Based on Gene Expression. Bioinformatics 20 (2004) 2429-2437 3. Guo, H., Jack, L. B., Nandi, A. K.: Feature Generation Using Genetic Programming with Application to Fault Classification. IEEE Transactions on Systems 35 (2005) 89-99 4. Huerta, E. B, Duval, B., Hao J.: A Hybrid GA/SVM Approach for Gene Selection and Classification of Microarray Data. EvoWorkshops, Budapest (2006) 34-44 5. Cristianini, N., Shawe-Taylor, J.: An Introduction to Support Vector Machines, Cambridge University Press, Cambridge (2000) 6. Park, P. J., Pagano, M., Bonetti, M.: A Nonparametric Scoring Algorithm for Identifying Informative Genes from Microarray Data. Pacific Symposium on Biocomputing (2001) 52-63 7. West, M., Blanchette, C., Dressman, H., Huang, E., Ishida, S., Spang, R., Zuzan, H., Marks, J. R., Nevins, J. R.: Predicting the Clinical Status of Human Breast Cancer Using Gene Expression Profiles. Proceedings of the National Academy of Science 98 (2001) 11462-11467 8. Golub, T., Slonim, D., Tamayo, P., Huard, C., Gaasenbeek, M., Mesirov, J. H. H. C., Loh, M., Downing, J., Claligiuri, M., Bloomfield, C., Lander, E.: Molecular Classification of Cancer: Class Discovery and Class Prediction by Gene Expression Monitoring. Science 286, 531-537 9. Krishnapuram, B., Carin, L., Hartemink, A.: Gene Expression Analysis: Joint Feature Selection And Classifier Design. In Kernel Methods in Computational Biology, Schölkopf, B., Tsuda, K., & Vert, J, -P., eds. MIT Press (2004) 10. Ben-Dor, A., Bruhn, L., Friedman, N., Nachman, I., Schummer, M., Yakhini, Z.: Tissue Classification with Gene Expression Profiles. Proceedings of the Fourth Annual International Conference on Computational Molecular Biology (2000) 54-64


![A Support Vector Machine Classification Model for Benzo[c] - MDPI](https://m.moam.info/img/260x300/a-support-vector-machine-classification-model-for-_59f7b3ff1723dd71c04fbf69.jpg)