URSI-NG Conference Proceedings (2015) 115 - 124
Determination of Tropospheric Duct Characteristics for Radio Propagation Design in Akure, Southwest Nigeria Ashidi, A. G.; Adediji, A. T.; Ojo, J. S.; Adedayo, K. D. and Ajewole, M. O. Department of Physics, Federal University of Technology, P.M.B. 704 Akure.
Email:
[email protected]
Abstract Tropospheric ducting of radio signals often occur when a large mass of cold air is overrun by warm air leading to temperature inversion such that the gradient of refractivity is less than -157 N/km. This usually results in radio energy bending downwards and becoming trapped between different layers within the troposphere; and travelling long distance with higher energy than usual. This work focuses on the determination of seasonal and diurnal characteristics of radio duct distribution as well as its vertical profile over Akure (7.15 oN, 5.12 oE). Archived meteorological data of pressure, temperature and humidity between January 2010 and December 2011 were used for the study. The data were recorded using Davis 6162 Vantage Pro 2 weather station and it covers the whole 24 hours of the day beginning from 00 local time(LT) and for a time interval of 30 minutes. Results show varying occurrence of ducting phenomenon that are spread across different periods of the day and seasons of the year. Keywords: ducting, refraction, variation and inversion.
1. Introduction Ducting phenomenon has significant effect on radiowaves propagating on both line-of-sight and non-line-of-sight paths within the troposphere. During ducting, the waves bend downwards more sharply and travel with signal strength that exceeds its free-space value, because its radius of curvature becomes greater than that of the earth, hence may interfere with other signals propagating within near or distant channels, Adediji and Ajewole, (2008). Most of the time, due to decrease of temperature with height, the troposphere is thermodynamically unstable and in a situation of turbulent mixing. As a result, the refractivity gradient is then not very different from -40 N/km. However, in some circumstances, temperature increases with height resulting in refractivity layering such that different layers have different refractive index gradients. Such a
Citation:
Ashidi et al., 2015, Determination of Tropospheric Duct Characteristics for Radio Propagation Design in Akure, Southwest Nigeria, Proceedings of URSI-NG Edited by J.O. Adeniyi and A.A. Ayeni, Pp 115 – 124, Publisher: Physics Department, University of Ilorin and International Union of Radio Science - Nigeria
Proceedings of the Annual National Conference of the International Union of Radio Science - Nigeria
layer, with a refractivity gradient below -157 N/km immersed in a broader region having a smaller refractive index lapse rate, is termed a ducting layer ITU-R, (2004). Several authors have studied anomalous propagation with focus on ducting phenomenon. In Singapore and Ajaccio, Young et al., 2004, reported a high correlation factor of 0.727 between average monthly temperature and percentage of ducting occurrence. Using high resolution balloon-borne GPS radiosondes, Zhao et al., 2013, reported that probability of ducting occurrence for evaporation, surface-based and elevated ducts; are 75.3%, .5% and 43.7% respectively. Using the artificial bee colony optimization (ABCO) algorithm, Chao Yang, 2013, estimated the atmospheric duct in maritime environment and reported good agreement with weather factors. Many authors in Nigeria have also carried out researches on anomalous propagation. Adediji and Ajewole, 2008, studied the vertical profile of radio refractivity gradient in Akure and reported prevalence of super-refractive conditions. Also, Falodun and Ajewole, 2006 studied radio refractive index in the lowest 100 m layer of the troposphere in Akure, their results confirmed the impacts of local climate on tropospheric radio wave propagation in the locality which also agrees with the works of Adediji et al., 2010 and Adediji, et al., 2015. Ducting occurs when the gradient of refractivity is less than -157 N/km, a situation brought about when weather alters the temperature, pressure and humidity of regions of air as they are moved about, mixed up, elevated and depressed by cyclones and anti-cyclones, and are heated by the sun and cooled down through radiation at night. The mechanisms of occurrence usually revolve round evaporation in areas of large water bodies, advection, subsidence and temperature inversion among other weather phenomena, Hall (1979).
2. Duct Theory Duct occurrence can be of two types (i) duct that have the ground as its lower boundary, referred to as surface ducts, and (ii) ducts whose lower boundary occur above the ground level, known as elevated ducts. Some of the meteorological processes that lead to duct formation include evaporation over the sea, nocturnal radiative cooling over land, and advection, Turton et al., 1988. Evaporation ducts are frequently observed over the oceans due to large lapse of humidity normally present immediately above the sea surface, while ducts resulting from nocturnal radiative cooling are associated with temperature inversions, dew deposition, and fog development; and advection ducts may form when warm, dry continental air passes over a cooler sea Atkinson et al., 2001. Within duct layers, the radius of curvature of a propagating wave trajectory becomes smaller than the radius of the earth and consequently, signal may get trapped between two levels which often enhance the strength of such wave. As an offshoot of anomalous propagation studies, ducting is estimated from gradient of radio refractivity using ITU-Recommendation (ITU-R, 2004). The radio refractivity, N, of air can be calculated from equation 1:
N
77.6P e 3.73 105 2 T T
(1) 116
Ashidi et al. | URSI-NG Conference Proceedings (2015) 115 - 124
and the absolute value of refractivity gradient ( N / h) is given in equation 2: N N s N h h h hs
(2)
while the partial pressure of water vapour, e, is calculated using equation 3:
17.502t 6.1121 exp t 240.97 eH 100
(3)
where t is temperature (oC), T is absolute temperature (K) and H is relative humidity (%). Ns is the refractivity at surface level, Nh is the refractivity at altitude h, and hs = height above the earth’s surface.
3. Data and Methodology Two years archived data of in-situ measured tropospheric parameters from January 2010 to December 2011 are used for the study. The study location is at the old premises of the Nigerian Television Authority (NTA) at Iju in Akure North local government area of Ondo State. Instrument used for the measurements is the Davis 6162 Wireless Vantage Pro2 equipped with an Integrated Sensor Suite (ISS), a solar panel (with an alternative battery source) and wireless console. The console is connected to a computer, through which stored data are downloaded. The ISS houses the sensors for pressure, temperature, relative humidity, UV index and dose, solar radiation, rain rate, wind speed and direction, among others; and the Sensor Interface Module (SIM). The SIM contains electronics that measure and store values of weather variables for transmission to the console via radio. The ISSs are positioned at the ground surface and at different heights (50 m, 100 m, 150 m and 200 m) on a 220 m-high TV tower, for continuous measurement of the weather parameters. The measurement covers 24 hours each day beginning from 00LT and taken with a time interval of 30 minutes. Thus, there are forty-eight (48) observations of each parameter in a day. The error margin of the ISS device for temperature, pressure and relative humidity are ±0.1 0C, ±0.5 hPa and ±2 % respectively. More details about the experimental location and the instrumentation set-up is available in Adediji and Ajewole, 2008. From the measured parameters, radio refractivity, its gradient and partial pressure of water vapour are computed using equations (1) to (3). The computed data were analysed on a diurnal basis averaged over a 30-minute time interval for each month in (January – December) for the two years. Expectedly, the three possible anomalous propagation conditions were present in varying intensities, but only those involving duct phenomenon are hereby presented. For this analysis, two duct types (surface ducts and elevated ducts) were targeted. Archived data, from the surface to 150 m altitude, of measured parameters were extracted and three possible duct layers at 50 m, 100 m and 150 m were examined. 117
Proceedings of the Annual National Conference of the International Union of Radio Science - Nigeria
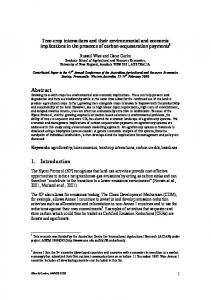
4. Results and Discussion Figures 1 to 5 represent the diurnal plots of half hourly average of dN/dh showing instances of ducting. Figure 1 shows the diurnal plot of dN/dh at fixed heights, i.e. 50 m, 100 m and 150 m, for January 2011, ducting phenomenon was observed at about 14:30 LT with dN/dh value of 158.3 N/km. The period between 12:30 and 3:30 LT have been in the neighbourhood of very strong super-refractive condition, but actual ducting was observed at around 14:30 LT and it occurred within the layer between the surface and 50 m altitude. Consequently, it can be regarded as a surface duct. Similar observations were made in March 2010, April 2010, December 2010 and December 2011. However, the period of occurrence vary from one event to another. While that of March 2010 was “prolonged” between midnight and 14:30 LT, and between 19:30 and 23:30 LT (Figure 2); others were short-lived. April 2010 event took place around 21:30 LT (Figure 3), while December 2010 events occurred around 13:30 and 17:00 LT (Figure 4); and that of December 2011 occurred around 11:00 and 14:00 LT (Figure 5). This shows that near or distant radio signal can be trapped within these duct layers, which cause them to propagate with very high strength beyond their line of sight limit. However, this may also result into interference of near and far signals, causing quality degradation.
Fig.1: Diurnal plots of half hourly average of dN/dh over January 2011 118
Ashidi et al. | URSI-NG Conference Proceedings (2015) 115 - 124
Fig.2: Diurnal plots of half hourly average of dN/dh over March 2010
Fig.3: Diurnal plots of half hourly average of dN/dh over April 2010 119
Proceedings of the Annual National Conference of the International Union of Radio Science - Nigeria
Fig.4: Diurnal plots of half hourly average of dN/dh over December 2010
Fig.5: Diurnal plots of half hourly average of dN/dh over December 2011 120
Ashidi et al. | URSI-NG Conference Proceedings (2015) 115 - 124
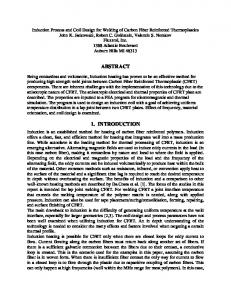
Moreover, all the ducting events observed occurred within the first 50 m altitude of the study location. The elevated layers (100 m and 150 m) did not record any ducting event. Figure 6 shows a typical plot of diurnal half hourly average of dN/dh at fixed heights, i.e. 50 m, 100 m and 150 m, with strong values of dN/dh, however, the refraction is not strong enough to result in a ducting. This typifies the AP conditions prevalent in the remaining period of this study. Intensity of duct events varies in no particular order due to its scarce occurrence. Duct intensity ranges from about -285 N/km in March 2010 to -158.3 N/km in January 2011. The periods of ducts occurrence were matched against temperature and water vapour pressure profiles of the same period. Figures 7, 9 and 11 are the vertical profile of monthly average values of temperature for January 2011, March 2010 and December 2011 respectively. Similarly, Figures 8, 10 and 12 represent the corresponding vertical profile of monthly average values of water vapour pressure for the same period. Both temperature and water vapour pressure exhibited the tendency to increase (instead of decrease) with height within the lowest 50 m altitude, the same region where the ducting phenomena were observed. This underscores the prevalence of ducting during inversion. Since pressure makes rather stable contribution to refractivity variation (Adediji, et al., 2015), its influence on duct occurrence is minimal.
Fig.6: Diurnal plots of half hourly average of dN/dh over July 2011 121
Proceedings of the Annual National Conference of the International Union of Radio Science - Nigeria
Fig.7: Temperature profile for January 2011
Fig.8: water vapour profile for January 2011
Fig.9: Temperature profile for March 2010
Fig.10: water vapour profile for March 2010
122
Ashidi et al. | URSI-NG Conference Proceedings (2015) 115 - 124
Fig.11: Temperature profile for December 2011
Fig.12: water vapour profile for December 2011
5. Conclusion From the analyses of duct occurrences and intensities, it was discovered that ducting events occurred sparsely throughout the period of evaluation. The few ducting events were observed in the lowest 50 m altitude of the troposphere and occurred during dry season month of December, which is associated with the inter-tropical discontinuity (ITD) movements notable in that period of the year. Ducting events were also observed in the month of March, which marks the transition from dry to wet season. Radio signal propagated during these occurrences will, with high strength and good quality, traverse longer distance beyond line of sight limit; an advantage that can be exploited by occasional-use terrestrial communication systems.
Acknowledgements The authors are grateful to Alexander von Humboldt Foundation; the University of Bonn, Germany, the Centre for Basic Space Science, Nsukka of the National Space Research and Development Agency (NASRDA) for research collaborations and equipment donation and the Nigeria Television Authority (NTA) for the use of its facilities.
123
Proceedings of the Annual National Conference of the International Union of Radio Science - Nigeria
References Adediji, A. T. and Ajewole, M. O. “vertical profile of radio refractivity gradient in akure southwest Nigeria” Progress In Electromagnetics Research C, Vol. 4, 157–168, 2008. Adediji A.T., and Ajewole, M.O., “Microwave Anomalous Propagation (AP) Measurement over Akure South-Western Nigeria” Journal of Atmospheric and Solar-Terrestrial Physics, 72, 5 – 6, 550 – 555, 2010. Adediji, A. T., Ajewole, M. O., Ojo, J. S., Ashidi, A. G., Ismail, M. and Mandeep, J. S., Influence of Some Meteorological Factors on Tropospheric Radio Refractivity Over a Tropical location in Nigeria. Mausam, vol 66, No 1, pp 123 – 128, 2015 Atkinson, B.W., Li J. G., and Plant, R. S. “Numerical Modeling of the Propagation Environment in the Atmospheric Boundary Layer over the Persian Gulf” Journal of applied meteorology, vol 40, pp 586 – 602, 2001. Bean, B.R. and Dutton, E.J., “Radio Meteorology”, Dover Publications Inc. New York (USA), 9–13, 1968. Chao Yang, “Estimation of the Atmospheric Duct from Radar sea Clutter using artificial Bee colony optimization Algorithm” Progress in Electromagnetics Research, vol. 135, 183-199, 2013. Falodun, S.E. and Ajewole, M. O., “Radio Refractive Index in the Lowest 100 m Layer of the troposphere in Akure, South Western Nigeria”, Journal of Atmospheric and Solar-Terrestrial Physics 68, 2, 236–243, 2006. Hall, M.P.M., “Effects of the Troposphere on Radio Communication” Peter Peregrins Ltd, U.K. & U.S., 1- 22, 1979. ITU-R, “The radio refractive index: its formula and refractivity data” Recommendation P.453459, 2004. Turton, J. D., Bennetts, D. A. and Farmer S. F. G. “An introduction to radio ducting. meteor. Mag. 117, 245–254, 1988. Young Kin Chuan, Loke M.K., Jolene Shui R.C, and Frank C.L “Ducting Phenomena and their impact on a Pulse Doppler Radar” DSTA Honrizons pp 93-96, 2007. Zhao X.F, Wang D.X, Huang S., Huang K., and Chien J “Statistical Estimations of atmospheric duct over the South China Sea and the Tropical Eastern Indian Ocean” Chinese Science Bulletin, vol. 58, No23, pp 2794-2797, 2013.
124