The automation of the data processing pipeline for virus structure determination ... generic constructs for dynamic coordination of workflows. The more complex ...
An Automated Data Processing Pipeline for Virus Structure Determination at High Resolution Chen Yu1 , Dan C. Marinescu1 , John P. Morrison2 , Brian C. Clayton2 , and David A. Power2 1
University of Central Florida School of EECS Orlando, FL 32816 USA {yuchen, dcm}@cs.ucf.edu
University College Cork Computer Science Department Cork, Ireland {j.morrison, b.clayton, d.power}@cs.ucc.ie
Abstract The automation of the data processing pipeline for virus structure determination at high resolution is a very challenging problem. The interaction between the data collection process and the theoretical modeling and computer simulation is very complex; routine tasks are mixed with decision making processes and unforeseen conditions. This paper dissects some of the most difficult problems posed by the dynamic coordination of complex computational tasks in a large scale distributed data acquisition and analysis system. A flexible coordination model should be capable of accommodating user actions, handling system related activities such as resource discovery and resource allocation, permitting dynamic process description modification, allowing different level of abstraction, providing some level of fault tolerance and backtracking capability. The Condensed Graphs model of computing developed at University College Cork (UCC) which combines availability-, demand-, and control- driven computation seems to be the most promising for certain classes of problems and complements our previous efforts in developing an intelligent environment for large scale-distributed data acquisition and analysis workflow applications. 1
1 This
research was funded by in part by National Science Foundation grants ACI0296035, EIA0296179 and by I2Lab Graduate Fellowship at the College of Engineering & Computer Science at University of Central Florida. c 1-4244-0910-1/07/$20.00 �2007 IEEE.
2
1
Introduction and Motivation
A fair number of data collection and data analysis systems are in use today in areas such as biological sciences, high energy and nuclear physics, astrophysics, material sciences, and chemistry. Many of them allow for automatic data collection and analysis tailored to the specific task of the system. Yet, it is very unlikely that one could adapt any of these systems to any other use than the one the system has been originally designed for. A major problem is the inflexibility of the process description and the lack of generic constructs for dynamic coordination of workflows. The more complex the original workflow description is, the more difficult it is to coordinate its execution in a sophisticated computing environment such as a computational Grid. Virus Structure Determination at High Resolution in Cryo-Transmission Electron Microscopy (CryoTEM) is no exception. The 3D reconstruction of viruses may take many months, or even years, and may involve large group scattered around the globe [6]. There are two major factors that distinguish the structural studies of large macromolecular structures like viruses from those of small proteins and make the automation of the data processing pipeline a very hard task: • The very large amount of experimental data and the humongous level of computing resources consumed for high resolution reconstruction. • The complexity of the protocols used for data analysis. To handle the massive amount of data we have developed parallel algorithms for the main tasks required by the 3D reconstruction of virus structures, origin and orientation refinement and the reconstruction of the 3D electron density map from 2D particle projections obtained experimentally in CryoTEM. More recently, we have developed algorithms
which allow us to execute the same program concurrently on several high performance computing systems, such as clusters, shared memory systems, or massively parallel systems. In this case, data partitioning is done at two levels; first, the data is distributed to a collection of heterogeneous parallel systems with different resources and startup times, then, on each system the data is partitioned to the available nodes using traditional SPMD strategy. Concurrent execution on multiple parallel systems complicates an already complex workflow management problem. Table 1 summarizes the estimated increases in the amount of data and the corresponding increase in memory requirements for high resolution reconstruction for a medium-size and for a large-size virus. The number of computing cycles required for the refinement of the electron density map, thus the execution times, increases faster than linear with the amount of experimental data. In a recent paper [6], we discuss an algorithm for origin and orientation refinement for virus structure determination. To reconstruct a 3D electron density map of a virus, we use a number of 2D projections from micrographs obtained experimentally with a cryo transmission electron microscope. We do not know the orientation of each 2D projection; finding the origin and orientation of 104 − 106 projections is a computationally intensive problem. In [6, 9] we report that our algorithm for origin and orientation refinement for virus structure determination includes several optimizations, but, in spite of these optimizations, the computing time required to improve the resolution of a medium-sized virus such as the Mammalian Re˚ to better than 7.0 A ˚ on 42 ovirus (MRV), from about 7.6 A processing nodes of one cluster, is about 14 hours/iteration. The refinement process in this case required about 100 iterations, thus the total time taken to improve the resolution ˚ to 7.0 A ˚ was about 1, 400 hours, or nearly from 7.6 A 60 days. A single processor system with the same single processor process rate and with sufficient memory would need some 2, 500 days to finish this computation. Conversely, if we had exclusive use of a 1, 000 node system with the same processor running in each node, the total computing time could be reduced to 3 days or less. Our aim regarding parallel computing for virus structure determination is ˚ or better starting from an to reach a resolution of say 5.0 A ˚ for a virus of similar electron density map of say 40.0 A size. Thus, for a typical problem, we probably need one order of magnitude more iterations; consequently, the total computing time would be one order of magnitude larger than the time reported in [6]. The interaction between the data collection process and the theoretical modeling and computer simulation is very complex; routine tasks are mixed with decision making processes and unforeseen conditions which sometimes can be handled based upon a set of rules and in other cases
require human decisions. Often, experimental data is collected with an instrument which produces a “distorted image” of the experimental sample and some form of correction is necessary. High level of noise makes some of the measurement results unusable; such data points have to be identified and discarded. The desire to “improve the quality” of results forces us to collect additional data. Often, experimental data obtained with different settings of the measuring instruments have to be re-calibrated. The instrument used to collect the experimental evidence may alter or destroy the “sample” and it becomes impossible to repeat the data collection phase under perfectly identical conditions. The coordination of a complex data acquisition and analysis task involving multiple activities poses numerous challenges even when the activity graph is static and when the resources necessary for the completion of each activity are known and can be acquired in advance. Yet, in many instances, the dynamics of the task is affected by factors such as: the availability of resources necessary to complete individual activities; timing constraints; the service model; changes required by the individual(s) who initiated the execution of the task; and possibly by unforeseen events such as the failure of some of the agents involved. The execution of a complex computational task involving multiple programs, in a heterogeneous computing environment, gives rise to many problems that require dynamic coordination. The execution time of individual programs/activities is both data and target system dependent. In general, it is hard to predict the precise time when the results of a computation will be available for its successors in an activity graph. This problem is further complicated when the activity graph requires iterative execution of a sub-graph which includes activities where the number of iterations is not known in advance. The next level of complication derives from the besteffort service model supported by most large-scale distributed systems such as computational grids. This requirement means that the coordination model has to continually monitor the execution to detect any lack of progress of an activity, the forced termination of the activity, or the failure of a target system, and to take appropriate action. Occasionally, activity may have to be replaced with a sub-graph involving several other activities. Thus, this replacement will require a change in the process description, or switching to a different process description. Probably the most difficult aspect of dynamic coordination for some classes of problems is user control. User actions, typically known as computation steering, range from inspection of partial results to backtracking and restarting a computation with different model parameters, or even switching to an alternative process description. A dynamic coordination model able to address the challenges discussed in this paper is a significant step towards
Table 1. Data set size for high resolution reconstruction (1 MB=106 , 1 GB=109 , 1 TB = 1012 bytes) for Mammalian Reovirus (MRV) and Paramecium Bursaria Chlorella Virus (PBCV-1). We assume 8 bits per pixel. Virus MRV PBCV-1 ˚ Resolution (A) 12 6 3 12 6 3 ˚ Pixel size (A) 4 2 1 4 2 1 Particle Image Size (pixels) 2562 5122 10242 5122 10242 20482 Memory /One Particle Image 256 KB 1 MB 4 MB 1 MB 4 MB 16 MB Number of Particle Images 103 104 106 5 × 10³ 5 × 10⁴ 5 × 10⁶ Image Data Set Size 256 MB 10 GB 4 TB 5 GB 200 GB 80TB 3D Map Size (voxels) 2563 5123 10243 5123 10243 20483 Memory/3D Map 64 MB 0.5 GB 4 GB 0.5 GB 4 GB 32 GB
a more general framework for such systems. A goal of our work is to fully automate data acquisition and analysis workflow, while at the same time, incorporating the following characteristics: • Backtracking, the ability to roll back the state and restart the process from an earlier stage. • Human control should be able to override the automatic control at any stage. • A hierarchical control structure. For example, the local control of a computation may be overridden by a higher level authority. • Collaborative activities. Multiple versions of data analysis may be running concurrently, and the principals of each process may be allowed to share a subset of partial results. • Different level of abstraction. Details should be transparent to those who are not concerned with them. • Allow activities which are not fully specified at the time when the workflow is defined, but known at the instance when they should be activated. • Capability to define complex preconditions to trigger the execution of activities. Many computational problems in neuroscience, physics, astrophysics, chemistry, and biology are based upon complex protocols similar to the ones described in this paper. Some of these problems are data intensive and require computing resources, primarily CPU cycles and main memory, well beyond those available on a single system, thus, require the coordination of computations carried out at multiple sites concurrently. The approach we consider in this paper has the potential to be useful for a large class of applications. In this paper, we first discuss briefly the Condensed Graphs model in Section 2. Then in Section 3, a nontrivial 3D Virus Reconstruction workflow example is introduced to show the capability of the Condensed Graphs model in
dealing with dynamic coordination concerns we mentioned above. An experimental environment is also reported in Section 4.
2
Condensed Graphs Model
Dynamic coordination can be greatly facilitated by having the flexibility to alter the sequencing constraints associated with activities execution. While being conceptually as simple as classical dataflow schemes [2, 4], the Condensed Graphs (CGS) model [7] is far more general and powerful. Like classical dataflow, the CGS model is graph-based and uses the flow of entities on arcs to trigger execution. In contrast, CGS are directed acyclic graphs in which every node contains not only operand ports, but also an operator and a destination port. Arcs incident on these respective ports carry other CGS representing operands, operator and destination, called as computation triple. Condensed Graphs are so called because their nodes may be condensations, or abstractions, of other CGS . (Condensation is a concept used by graph theoreticians for exposing meta-level information from a graph by partitioning its vertex set, defining each subset of the partition to be a node in the condensation, and by connecting those nodes according to a well-defined rule [5]). Condensed Graphs can thus be represented by a single node (called a condensed node) in a graph at a higher level of abstraction. It is possible to navigate between these abstraction levels, moving from the specific to the abstract through condensation, and from the abstract to the specific through a complementary process called evaporation. The basis of the CGS node firing rule is the presence of a condensed graph (CG) in every port of a node. That is, CGS representing operands are associated with every operand port, an operator CG with the operator port and a destination CG with the destination port. A condensed node, a node representing a datum, and a multi-node CG can all be operand. The present representation of a destination in
Figure 1. CGS congregating at a node to form an instruction.
the CGS model is as a node whose own destination port is associated with one or more port identifications. Figure 1 illustrates the congregation of computation triple at a node and the resultant rewriting that takes place. Operator strictness can be used to determine the strictness of operand ports: a strict port must contain a datum CG before execution can proceed, a non-strict port may contain any CG . If, by computation, a condensed or multi-node CG attempts to flow to a strict operand port, the grafting process intervenes to construct a destination CG representing that strict port and sends it to the operand. The grafting process, in conjunction with port strictness, ensures that operands are only evaluated when needed. By statically constructing a CG to contain operators and destinations, the flow of operand CGS sequences the computation in a dataflow manner. Similarly, constructing a CG to statically contain operands and operators, the flow of destination CGS will drive the computation in a demand-driven manner. Finally, by constructing CGS to statically contain operands and destinations, the flow of operators will result in a control-driven evaluation. This latter evaluation order, in conjunction with side-effects, is used to implement imperative semantics. The power of the CGS model results from being able to exploit all of these evaluation strategies in the same computation, and dynamically move between them, using a single, uniform formalism.
3
Dynamic Coordination under Condensed Graphs Model
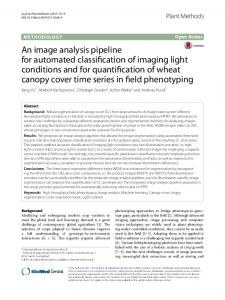
The capability of combining availability-, demand-, and control-driven computation of Condensed Graphs model is well suited for dynamic coordination. A 3D Virus Reconstruction workflow [6] is presented here to show the CGS modeling process and its capability of dealing with the challenges of dynamic coordination concerns for data acquisition and analysis systems. 3D Virus Reconstruction (3DR) is an iterative process described by a worflow consisting of several activities: “Origin and Orientation Refinement” (OOR), followed by “3D Reconstruction” (3DR), followed by branch selection of whether to continue with additional iterations at the same
Figure 2. Workflow describing the electron density map refinement.
resolution. Figure 2 illustrates the 3DR workflow and Figure 3 shows the corresponding CG graphical expression. Note that the CGS model allows different level of abstraction. The topmost level CG expression of a complex task could consist of one or more nodes providing a very high level description of the task. In the example, level(a) in Figure 3 only has one node: 3D Reconstruction. This models, at the highest level, only domain specific computational activities, the ones a user typically understands, and hides the detailed steps of the task. At level(b), the detailed steps involved in 3D Reconstruction are outlined. System related or data-related auxiliary activities such as resource discovery, or data staging, which may distract and confuse a nonexpert user, are hidden in level(c). This hierarchical decomposition and aggregation is an inherent feature of CGS model and the evaporation function establishes the link to the detailed subgraph definition for a given node. It makes it possible to associate one CG node with multiple subgraph definitions and makes switching between alternative process descriptions more manageable. In Figure 3, node OOR at level(b) has four possible expansions with different physical execution options. The selection of a subgraph definition can be done statically as well as dynamically. Before the execution of graph, the evaporation function return of one node can be set to one specific subgraph definition statically. When the execution of graph begins, the node can also choose one subgraph definition dynamically based on a predefined mechanism, a user’s hint or a user intervention. Backtracking is easy to handle under the CGS model. The nodes that have fired are stored into a V-graph memory, the graph stores all fired nodes in the sequence of their activation with the relevant data, control, and state infor-
Figure 3. CG expression of 3D Virus Reconstruction Workflow. The topmost CG describes the core of the 3D reconstruction process; level(a) can be expanded as the CG at level(b) which illustrates iterations consisting of Origin and Orientation Refinement (OOR), carried out by a program called PO2 R, followed by 3D Reconstruction (3DR), carried out by a program called P3DR, followed by a branch selection node. This selection node determines whether to continue with additional iterations at the same resolution, or to move to the next resolution. The OOR node can be expanded differently at level(c); we may run the program PO2 R with local data as in (c1); we may run PO2 R remotely after a Resource Discovery (RD) stage, followed by Resource Allocation (RA) stage, followed by a Data Staging (DS) stage as in (c2); we may run PO2 R with local data after some Input Data Noise Filtering (IDF) stage as in (c3); or run it remotely after an input data filtering stage as in (c4). At level(b), node P3DR grafts on branch selection node and may be executed repeatedly based on the choice of iteration decision node. The E and X nodes of a condensed graph correspond to the start and respectively termination of the activity.
mation used during their activation. To rollback and restart the process, the rollback point information in the V-graph is compared with the nodes initial static definition, the node’s computation triple is reset and the computation is restarted. Most of the workflow coordination systems nowadays deal with human control at the execution level instead of the modelling level. That is, user control or interruption operations are not expressed explicitly in the process description. This contrasts with the CGS model approach. Here, human interruption can be explicitly modelled in the graph definition by adding one non-strict operand port to the node. The non-strict firing rule triggers execution of a node as soon as a specific proper subset of its operand set (not including the operand reserved for human control) is formed. Take node 3DR in Figure 3 for example. By adding a new non-strict operand port to it, see Figure 4, and applying the non-strict firing rule, 3DR will be fired as soon as its predecessor OOR finishes, even though it does not get input from the non-
strict operand port for human control. A user can provide commands through this operand port at run-time and so direct execution of node 3DR. Combined with the features of the evaporation function and the backtracking capability of the CGS model, great flexibility in the process control is obtained.
Figure 4. Computation steering using nonstrict operand port.
Figure 5. CG expression for an activity with multiple output data.
Figure 6. CG expression for the data partition process. Often an activity can produce multiple results which should be dispatched to different successors activities. Some successor activities may only be concerned with a segment of the result. Moreover, security and privacy considerations may require that some successor activities do not have access to the entire result. The CGS model only allows one output destination port. This implies that when one node produces multiple results, all of them have to be in one output package. Consider the workflow in Figure 5(a). Activity A generates two output data packages marked as O1 and O2. O1 is targeted to successor activity B and O2 is dispatched to activity C. Figure 5(b) illustrates the equivalent representation using CG . The node, Data Filler, is introduced, which has two operands ports, One for a data package that will be analyzed and one for getting the data sub-package identifier. For simplicity, the identifiers “O1” and “O2” are used to identify the sub-packages O1 and O2 respectively. The task of Data Filler is to separate input data package based on the specified identifier and to output the corresponding sub-package to its successors. Node A generates the output data package and after the Data Filler nodes, O1 goes to node B and O2 goes to node C. Note that condensed node G is required in order to guarantee the syn-
chronization of the node B and node C. It is easy to see in Figure 5(a), Activities B and C receive the data from A and are activated at the same time logically. Consider the counterpart in Figure 5(b), data package O1 and O2 can reach node G at different time due to possible different process latency of two Data Filler nodes. However, node G will be fired only when both O1 and O2 reach its strict operand ports. This guarantees the synchronized firing of nodes B and C and the equivalence of two representations. Data partitioning is another concern for data acquisition and analysis applications. Input data is partitioned and dispatched to multiple parallel computing systems. The pool of available computing resources for one application is highly dynamic and the output of the data partitioning algorithm may be different during each run. This leads to the requirement of dynamic process description modification. Recall the feature of evaporation function: the return of evaporation function of one condensed node can be set dynamically. This provides the support for dynamic process description modification on the model level. Consider the node OOR in Figure 3 whose input data partitioning procedure is shown in Figure 6. Node “Decision Maker” runs the partitioning algorithm and generates the mapping between data blocks
and computation resources. The Coordination Engine generates the subgraph definition for node OOR dynamically based on the output of “Decision Maker” and sets the evaporation function return of OOR point to this subgraph definition. There are n parallel paths in OOR’s subgraph definition where n equals to the number of computation resources selected by “Decision Maker”. Each path has one “Data Filter” which retrieves a data block from OOR’s input data set according to the data block identifier. The data block is transmitted to an appropriate computation resource by node “Data Staging” (DS). Data processing is done by the node “Parallel Origin and Orientation Refinement” (PO2 R) on each resource. Node “Result Assembler” gathers and assembles partial results and returns the outcome to OOR’s successors.
4
An Experimental Testbed
The technologies presented in this paper are currently implemented as part of a joint project with University College Cork (UCC). In this project, we develop a dynamic coordination environment for virus structure determination at high resolution [6]. There are three components in this dynamic coordination environment: the Workflow Coordination Engine running on coordination server, the Application Container running on each computing engine, and the Knowledge Base which includes an Ontology. The Ontology describes all classes of objects, the relationships among classes of objects, as well as the instances of each class. Figure 7 illustrates the interaction between the three components.
Figure 7. The components of the dynamic coordination environment. The functions of Workflow Coordination Engine include: • receive and process workflow definition; • coordinate workflow execution; • dispatch job to execution machine (Application Container); • monitor and update workflow execution status; • interact with human control on the fly; • failure detect and recovery; • resource recovery and resource allocation; • user authorization and security management.
In our implementation, we use WebCom [8], a distributed computing engine developed at University College Cork. Webcom implements the Condensed Graphs computation model and provides load-balancing, fault-tolerance, resource-discovery management and security. In our case Webcom acts as the Workflow Coordination Engine. Although the workflow is coordinated by the Workflow Coordination Engine, the actual job execution is carried out by the Application Container located at each computing resource or execution machine. The functions of the Application Container are: • allocate and manage local resource; • authorize users • process the jobs submitted by the Workflow Coordination Engine; • manage data and program staging; • monitor job execution; • report the status of job execution to the Coordination Engine; • update the Knowledge Base upon job termination; • detect hardware malfunction, system failure, or program malfunction and attempt recovery. The data and program staging function of the Application Container running on a target system is implemented by the gridftp service [1] provided by Globus Toolkit [3]. Remote access through Globus is available on all resources for data and program staging implementation. Knowledge Base is used to store: • the Condensed Graph description of all the workflows involved; • the instances of the workflows; • the state information; • the pool of available computing resources; • the status of computing resources; • the list of authorized users. The Workflow Coordination Engine and the Application Container interact with the Knowledge Base. The Workflow Coordination Engine stores process definition into the Knowledge Base, updates and retrieves workflow state information, verifies user identity, and accesses the Knowledge Base to determine what computing resources are available before making scheduling decisions. The Application Container may register itself with the Ontology, update local resource state, retrieve job execution parameters, update job execution state, and obtain user information. Coordination is carried out by a hierarchy of Webcom engines which make scheduling decisions at different levels. Once a scheduling decision is made, an instance of a condensed graph is partitioned accordingly and it is transferred to the next level. A coordination engine may run
on the same system where an Application Container is installed. The Knowledge Base is visited for available computing resources or execution machines information when coordination engine decides to execute the job physically. Job execution state is returned to Coordination Engine as well as stored into the Knowledge Base by Application Container.
5
Summary
Automating the data acquisition and data analysis pipeline for virus structure determination at high resolution poses serious challenges. In this paper we outline these challenges and propose a dynamic coordination environment based upon Condensed Graphs. The Condensed Graphs model combines availability-, demand-, and control-driven computation and it is extremely well suited for dynamic coordination of complex computational tasks in large-scale distributed systems such as computational Grids. We present some of the workflows involved in virus structure determination at high resolution, show the corresponding Condensed Graphs and discuss specific advantages of the CGS model. We focus on the ability of the model to abstract complex activities, to allow late binding of actions and support computation steering, to enable concurrent execution and support data partitioning, and last but not least deal with dynamic resource management. The model is supported by Webcom, a distributed computing environment based upon an abstract Condensed Graphs engine which facilitates the development of the automated data processing pipeline for virus structure determination at high resolution. The dynamic coordination model discussed in this paper provides a rather general framework and we hope that other applications could benefit from it.
References [1] W. Allcock. GridFTP: Protocol Extensions to FTP for the Grid. Global Grid Forum GFD-R-P.020, 2003. [2] Arvind and K.P. Gostelow. A Computer Capable of Exchanging Processors for Time. In Proc. IFIP Congress 77, Toronto, Canada, pp. 849–853, 1977. [3] I. Foster. Globus Toolkit Version 4: Software for ServiceOriented Systems. Int. Conf. on Network and Parallel Computing, LNCS 3779, Springer-Verlag, pp. 2–13, 2005. [4] J.R. Gurd, C.C. Kirkham, and I. Watson. The Manchester Prototype Dataflow Computer. CACM, vol.28(1), pp. 34–52, 1985. [5] F. Harary, R. Norman, and D. Cartwright. Structural Models: An Introduction to the Theory of Directed. John Wiley and Sons, 1969.
[6] Y. Ji, D.C. Marinescu, W. Zhang, X. Zhang, X. Yan, and T.S. Baker. A Model-based Parallel Origin and Orientation Refinement Algorithm for CryoTEM and its Application to the Study of Virus Structures. Journal of Structural Biology, vol. 154(1), pp.1–19, 2006. [7] J.P. Morrison. Condensed Graphs: Unifying AvailabilityDriven, Coercion-Driven and Control-Driven Computing. PhD thesis, Eindhoven, 1996. [8] J.P. Morrison, D.A. Power, and J.J Kennedy. An Evolution of the WebCom Metacomputer. Journal of Mathematical Modelling and Algorithms, Special Issue on Computational Science and Applications, vol. 2003(2), pp. 263–276, 2003. [9] X. Zhang, Y. Ji, L. Zhang, M.A. Agosto, S.C. Harrison, M.L. Niebert, D.C. Marinescu, and T.S. Baker. Features of Re˚ or Better ovirus Outer-Capsid Protein µ1 Revealed at 7.0-A by Electron Cryomicroscopy and Image Reconstruction of the Virion. Structure, vol. 13, pp. 1–13, 2005.