An Automated Multi Scale RETINEX with Color Restoration for Image Enhancement Sudharsan Parthasarathy
Praveen Sankaran
Department of Electronics and Communication Engineering Department of Electronics and Communication Engineering National Institute of Technology Calicut National Institute of Technology Calicut Kerala, India Kerala, India Email:
[email protected] Email:
[email protected]
Abstract—The dynamic range of a camera is much lesser than that of human visual system. This causes images taken by the camera to look different from how the scene would have looked to a naked eye. Multi Scale Retinex with Color Restoration(MSRCR) algorithm enhances images taken under a wide range of nonlinear illumination conditions to the level that a user would have perceived it in real time. But there are parameters used in this enhancement method that are image dependent and have to be varied based on the images under consideration. In this paper we propose a completely automated approach for MSRCR by obtaining parameter values from the image being enhanced.
I. I NTRODUCTION Standard image enhancement techniques modify the image by using techniques such as histogram equalization, specification etc. [1] so that the enhanced image is more pleasing to the visual system of the user than the original image. There is a difference between the way our visual system perceives a scene when observed directly and in the way a digital camera captures the scene. Our eyes can perceive the color of an object irrespective of the illuminant source. But the color of the captured image depends on the lighting conditions at the scene. Our aim is to enhance the quality of the recorded image as to how a human being would have perceived the scene. This property that we aim to achieve is called ‘color constancy’. This property cannot be achieved using standard image enhancement techniques. Histogram equalization is basically a contrast enhancement technique that works well on images that are uni-modal (i.e.very dark or bright images). Advanced variants of histogram equalisation like Adaptive Histogram Equalisation(AHE) [2], Contrast Limiting Adaptive Histogram Equalisation(CLAHE) [3], Multi Scale Adaptive Histogram Equalisation (MAHE) [4] give strong contrast enhancement. But these methods are not used in color image processing as strong contrast enhancement, might make the image look unnatural. One of the enhancement techniques that tries to achieve color constancy is Retinex(Retina+Cortex) [5]. A color constancy algorithm must be able to simultaneously achieve the 3 properties given below [6], i. dynamic range compression, 978-1-4673-0816-8/12/$31.00 ©2012 IEEE
ii. color independence from the spectral distribution of the scene illuminant and, iii. color and lightness rendition. The first property can be achieved by applying logarithmic transformations on the image [1]. The second property can be achieved by eliminating the illuminance component in the image. Every pixel in an image can be represented as a product of illuminance and reflectance i.e. S(x, y) = R(x, y) ∗ L(x, y)
(1)
where L represents illuminance, R represents reflectance and S represents the image pixel. Our aim is to eliminate L(x, y). Illumination varies slowly across the image unlike reflectance. So illuminance of an image can be obtained by low pass filtering the image. Instead of obtaining R = S/L, we use logarithmic approach to achieve the same, since applying logarithm on an image gives us dynamic range compression. Let s = log(S), r1 = log(R), l = log(L). So now equation 1 can be represented as, r1(x, y) = s(x, y) − l(x, y)
(2)
L can be obtained by convolving a low pass filter F with image S. Initially Land 1/r2 as the low pass � proposed[5] (x2 + y 2 ), x and y are the pixel filter F , where r = locations. By using this function, the first 2 properties of color constancy were achieved but not the third one. Zia et al. [6], proposed a new method popularly known as Single Scale Retinex(SSR) to overcome this problem. In this paper we will look at the SSR algorithm in Section II, a modified version of SSR named as Multi Scale Retinex (MSR) in Section III, a variant of MSR known as Multi Scale Retinex with Color Restoration(MSRCR) in Section IV and finally we present our proposed automated approach to MSRCR in Section V.
where N is the number of scales, Rni is the ith component of the nth scale, RM SRi is the ith spectral component of the MSR output, and wn is the weight associated with the nth scale [7]. The only difference between R(x, y) and Rn (x, y) is that the surround function is given as, Fn (x, y) = ke−r
2
/c2n
(6)
Experimental results have shown that it is enough to use just 3 scales viz. one small scale (cn < 20), one large scale (cn > 200) and third one as an intermediate scale value [6]. The three different retinex outputs that we get because of using the gaussian surround function with three different scaling functions, is equi-weighed and added to get the final retinex output. IV. M ULTI S CALE RETINEX WITH COLOR RESTORATION (MSRCR)
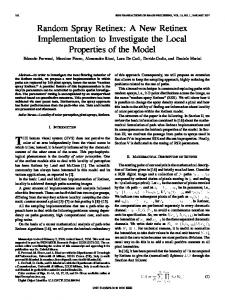
Fig. 1.
Single scale retinex outputs a) c=15 b) c=80 c) c=250
II. S INGLE S CALE R ETINEX (SSR) Mathematically, Retinex equation can be represented as, Ri (x, y) = log[Ii (x, y)] − log[F (x, y) ∗ Ii (x, y)]
(3)
where Ii (x, y) is the image distribution in the ith color spectral band, ‘∗’ denotes the convolution operation, F (x, y) is the surround function and Ri (x, y) is the associated retinex output. The problem with Land’s model can be overcome by using a Gaussian surround function as given in the equation below, 2 2 F (x, y) = e−r /c (4) The retinex operation is performed on each spectral band. For the gaussian surround function, when the surround constant is varied from a small value to a large value, dynamic range compression is sacrificed for improved rendition as shown in Fig. 1. The middle of the range(50 < c < 100 pixels) represents a reasonable compromise, where shadows are fairly compensated and rendition achieves acceptable levels of image quality [6]. To compensate for this disadvantage of single scale retinex i.e. it can either achieve good dynamic range compression or good color rendition, we go for multi scale retinex method which helps us to achieve both simultaneously. III. M ULTI S CALE R ETINEX (MSR) In the multi scale retinex method [7], we find the retinex output according to equation 5 for various values of surround constants and add all the retinex outputs by giving them equal weight as, N � RM SRi = wn Rni (5) n=1
Retinex algorithm was originally developed for images that do not violate the ‘grey-world’ assumptions. If the reflectances of the image in all the three color bands are same on an average then the image is said to obey grey-world assumption. The general effect of retinex processing on images with regional or global grey-world violations is “greying out” of the image, either globally or in specific regions. This desaturation of color in some cases can be severe. So we have to find a color restoration method that provides good color rendition for images that contain grey-world violations [7]. But one should be careful not to compromise on color constancy in our pursuit of color rendition, as color constancy is one of the prime objectives of retinex. The algorithm for color restoration is given below,
RM SRCRi (x, y) = G[Ci (x, y)RM SRi (x, y) + b] where
�
(7) (8)
Ci (x, y) = f [Ii (x, y)]
is the ith band of the color restoration function(CRF) and RM SRCRi is the ith spectral band of the multiscale retinex with color restoration. The function that provides us the best overall color restoration is, Ci (x, y)
= =
�
(9)
βlog[αIi (x, y)] βlog[αIi (x, y)] − βlog[
S �
Ii (x, y)] (10)
i=1
where β is a gain constant, α controls the strength of the non linearity, G and b are final gain and offset values. The values specified for these constants by Zia et al. [6] are β = 46, α = 125, b = −30, G = 192. After performing color restoration it was found that the restored images were still “greyed-out”. Though final gain and offset values, G and b, are used for the adjustment from logarithmic domain to display domain, “greying -out”
Fig. 2.
Histogram of a single scale retinex enhanced image
still remains. It was found that the “greying -out” of the image happens at the single scale retinex stage itself. So any treatment for this problem had to be applied at that stage. Zia et al’s paper on MSRCR [6] does not deal with this problem. But their earlier work on SSR [7] deals with this problem and recommends a histogram based approach. In Land’s paper [5], this problem was not dealt with at all. Subsequently, Hulbert dealt with this problem in his Ph.D dissertation [8]. He proposed an automatic gain/offset approach, where the retinex values are adjusted by the absolute maximum and minimum found across all the values in all the color bands. But since this method could not give us a very good color rendition, we have used Zia et al.’s [7] canonical gain/offset method. The method showed in Fig. 2 actually results in clipping of some of the highest and lowest signal values, but it is not a problem since those regions carry very less information. Problem with this method is that the authors have not clearly specified how to choose the lower clipping and upper clipping point. V. P ROPOSED M ETHOD Though many modified versions of MSRCR are available in the literature [9]-[11], none of these propose an automated approach for Retinex. We propose an automated (image independent) method to choose the upper and lower clipping points. We can choose the upper and lower clipping points using two methods, i. by using variance of the histogram as a control measure or ii. by using the frequency of occurrence of pixels as shown in the histogram as a control measure. Our initial approach was to use variance as a control measure. A particular test image was taken. After performing single scale retinex on that image, the histogram of the enhanced (single scale retinexed) image was plotted and variance was found from that. The clipping point was chosen as ‘x’ times the variance where ‘x’ can take any value from 1 to 5 as shown in Fig. 3. The output image was obtained
Fig. 3.
Histogram explaining clipping points using the variance
Fig. 4. Histogram explaining choosing clipping points using frequency of occurrence of pixels
after clipping the histogram and rescaling the clipped region to 0 to 255 as shown in Fig. 2. But after testing this method across various images, we came to a conclusion that a unique ‘x’ value would not work for all images. So the procedure of finding clipping points cannot be automated if variance is chosen as a control measure. In the second method, control measure depends on the frequency of occurrence of pixels. For most of the images, the histogram of the enhanced image is similar to a gaussian (but not exact). The frequency of occurrence of pixel value ‘0’ in the enhanced image is found. Let this value be ‘max’ as shown in the Fig. 4. The lower and upper clipping points are obtained as shown in the Fig. 4. After testing across many images, y = 0.05 was found to be an optimum value that can be used for many types of images, meaning that 5 percent of pixels on either side of the histogram are discarded. This approach has removed the image dependency that the previous method has and this is a really great advantage
in real time applications [12], [13] where the user would not have time to choose the optimum clipping points for a particular image. The reason we are not able to automate our method using variance based control approach is because the histogram is not perfectly gaussian in nature. In this type of histograms, pixels which are at equidistant values from either side of the mean point do not have the same percentage of occurrence of pixels. The values ‘a1’ and ‘a2’ are not equal in the Fig. 3. We mentioned that this histogram based approach is applied at SSR stage i.e. after SSR output is obtained for each surround constant values c = 15, 80, 250. But while testing we found that better outputs are obtained if we apply this technique after MSR instead of applying at SSR stage itself, reason being that this approach is non-linear in nature. And also the algorithm is computationally faster if we apply this histogram based correction once after MSR, instead of applying thrice in SSR stage.
Fig. 5.
a) Input image b) Our output c) Software output
Fig. 6.
a) Input image b) Our output c) Software output
A. Results We use the standard Retinex test images that are given in the website of NASA for comparison. The enhanced outputs provided for each test image in the website have been obtained by adjusting the parameters depending on the image. This Retinex algorithm is also commercially provided by True View Imaging Company as a part of Photoflair software. The demo version of this software is available for free. This software also uses some image independent (automated) approach for Retinex. Their method gives very good results for some images but very bad results for certain images (especially dark or shadowed images). But our automated approach gives very good enhancement for all types of images. We present here three images for comparing the software output with our automated approach. The first image Fig. 5 a) is obtained from the NASA Retinex website. Fig. 5 shows clearly that our method is better than software output. The red colour uniform and the subjects are better visible in our enhanced image than in the software enhanced image. The second image Fig. 6 a) was taken by us under poor lighting conditions. For this image too, our enhanced image is much better than the software’s. The third image Fig. 7 a) is also taken from NASA’s website. For this image, both the software and our proposed method perform equally well. B. Luma based approach Though automated MSRCR performs well in most of the cases, it fails to render exact colour when there are large constant areas of constant colour. Applying MSRCR algorithm on the luma component of the image turned out to be a good solution for this problem. The PCA is the best transform from RGB space to luma and chroma space since the luma and chroma components are made to be completely independent(orthogonal) of each other. But PCA is not widely used since the transform is image dependent. Meylan et
al., have compared in their work [14] the difference in the outputs obtained when MSRCR is applied only on the luma components that are obtained from different colour transforms. According to this paper, the outputs obtained after applying MSRCR on the luma components of YUV and Lab transforms is as close as the outputs obtained after applying MSRCR on the luma component of PCA transform. Figure 8 shows the disadvantage of using the original MSRCR and how luma based MSRCR overcomes it. Even color rendition is better in luma based MSRCR for this particular example. Another advantage of luma based MSRCR is the simulation time is reduced approximately to one-thirds of the time it took for the original MSRCR since here the MSRCR algorithm is
Fig. 7.
a) Input image b) Our output c) Software output
applied only on the luma component. One of the reasons for luma based MSRCR to give better results than original MSRCR is the automation step. Since the optimal value to automate the MSRCR algorithm was found using the trial and error procedure, a uniform optimal value of y = 0.05 was used across all the three RGB colour bands. This might work for some images but need not necessarily work for all images. In luma based MSRCR approach, since the MSRCR algorithm(automated) is applied only on the luma channel, our automation algorithm is found to be more consistent across different images. VI. F UTURE W ORK The automation process proposed in this paper has been achieved by testing across various images. Future work would concentrate on achieving this automated value through mathematical analysis. R EFERENCES [1] R. C. Gonzalez, R. E. Woods, “Digital Image Processing,” Third Edition, Pearson Publications. [2] S. M. Pizer, J. B. Zimmerman, E. Stab, “Adaptive grey level assignment in CT scan display,” Journal of Computer Assistant Tomography, vol. 8, pp. 300-305, 1984. [3] S. M. Pizer, E. P. Amburn, “Adaptive histogram equalization and its variations,” Computer Vision, Graphics and Image Processing, vol. 39, pp. 355-368, 1987. [4] Y. Jin, L. M. Fayad, A. F. Laine, “Contrast enhancement by multiscale Adaptive Histogram Equalization,” Proceedings of SPIE, vol. 4478, pp. 206-213, 2001. [5] E. Land, “An alternative technique for the computation of the designator in the Retinex theory of color vision,” in Proceedings of Natural Academy of Science, vol. 83, pp. 3078-3080, 1986. [6] D. J. Jobson, Zia-ur-Rahman, G. A. Woodell, “Properties and performance of a Center/Surround Retinex,” IEEE Transactions on Image Processing, vol. 6, no. 3, March 1997. [7] D. J. Jobson, Zia-ur Rahman, G .A. Woodell, “A Multiscale Retinex for Bridging the Gap Between color images and the human observation of scenes,” IEEE Transactions on Image Processing, vol. 6, no. 7,July 1997.
Fig. 8. output
a) Input image b) original MSRCR output c) luma based MSRCR
[8] A. C. Hulbert, “Formal connections between lightness algorithms,” Journal of Optical Society of America, vol. 3,issue 10, pp. 16841693,1986. [9] L. Yong, Y. Xian, “Multi dimensional multi scale image enhancement algorithm,” Second International Conference on Signal Processing Systems, 2010. [10] Li Tao, R. Tompkins, V .K . Ansari, “An illuminance reflectance model for non linear enhancement of color images,” IEEE Conference on Computer Vision and Pattern Recognition, 2005. [11] H. Hu, G. Ni, “Color Image Enhancement based on the Improved Retinex,” International Conference on Multimedia Technology, October 2010. [12] W. J. Kyung, Y. H. Ha, D. C. Kim, “Real time Multi Scale Retinex to enhance night scene of vehicular camera,” 17th Korea-Japan Joint Workshop on Frontiers of Computer Vision, 2011. [13] G. D. Hines, Zia-ur-Rahman, D. J. Jobson, G. A. Woodell, S. D. Harrah, “Real time enhanced vision system,” Proceedings of the SPIE, vol. 5802, pp. 127-134, 2005. [14] L. Meylan, S. Susstrunk, “The Influence of Luminance on Local Tone Mapping, ” ISTSID Color Imaging Conference, 2005.