DOI: http://dx.doi.org/10.7551/978-0-262-32621-6-ch073
POET: an evo-devo method to optimize the weights of large artificial neural networks Alessandro Fontana1 , Andrea Soltoggio2 and Borys Wr´obel1,3 1
Evolving Systems Laboratory, Faculty of Biology, Adam Mickiewicz University, Pozna´n, Poland 2 Computer Science Department, Loughborough University, Loughborough LE11 3TU, UK 3 Systems Modelling Laboratory, IO PAS, Sopot, Poland
[email protected],
[email protected],
[email protected] Abstract
a very large number of interacting cells (in the order of 1013 ; Wolpert and Ticke, 2010; Bianconi et al., 2013).
Large search spaces as those of artificial neural networks are difficult to search with machine learning techniques. The large amount of parameters is the main challenge for search techniques that do not exploit correlations expressed as patterns in the parameter space. Evolutionary computation with indirect genotype-phenotype mapping was proposed as a possible solution, but current methods often fail when the space is fractured and presents irregularities. This study employs an evolutionary indirect encoding inspired by developmental biology. Cellular proliferations and deletions of variable size allow for the definition of both regular large areas and small detailed areas in the parameter space. The method is tested on the search of the weights of a neural network for the classification of the MNIST dataset. The results demonstrate that even large networks such as those required for image classification can be effectively automatically designed by the proposed evolutionary developmental method. The combination of real-world problems like vision and classification, evolution and development, endows the proposed method with aspects of particular relevance to artificial life.
Some models of direct encoding mimic biology by starting from a single element, from which a final structure grows, consisting of many such elements (Smith and Thelen, 1993; Bongard and Pfeifer, 2003; Kumar and Bentley, 2003; Roggen and Federici, 2004). Others, notably HyperNEAT (Stanley et al., 2009), produce a phenotype by means of a single-step indirect mapping function of a compact genotype. Indirect encodings, whether they model development or not, are characterized by compact representations of correlated parameters in the large phenotype space. Such compact encoding, however, biases the search, sometimes with detrimental effect, particularly in the presence of irregularities (Clune et al., 2009; van den Berg and Whiteson, 2013), even though these findings have been later put in question (Stanley et al., 2013). In short, while direct encodings are inefficient while searching regular patterns, indirect encodings suffer from the opposite problem of struggling with irregular and fractured search spaces.
Introduction
The observation of the inefficiencies of both types of encoding inspired methods that can search both regularities as well as particularities in the solution space (van den Berg and Whiteson, 2013). The present study contributes to this line of research by demonstrating the capabilities of an evolutionary developmental method in searching large parameter space in a neural network for image classication. The proposed method is inspired by biological development, and based on gene expression mechanisms that can map genes locally with variable intensity, affecting at times large, at times small parts of the phenotype. For this reason, arbitrarily large search spaces can be searched without losing the ability to discover particularities.
An important feature of artificial living systems is that of learning from and computing with rich sensory information. In biology, such feats are performed by large learning neural structures capable of developing and learning during lifetime. Computational models of large neural networks, however, are difficult to design due to the large search space. For example, artificial neural networks for image classification require computationally intensive learning algorithms to optimize large numbers of parameters (Bengio, 2009), and evolutionary computation was not, so far, an efficient way to do so (Koutn´ık et al., 2013). This is especially true for evolutionary search with direct encodings, which ignore regularities, repetitions and patterns in the desired solutions. Indirect encodings (Lindenmayer, 1968; Stanley and Miikkulainen, 2003; Federici, 2004; Roggen and Federici, 2004; Hornby, 2005) were proposed as a more suitable representation to help evolutionary search. Such encodings are inspired by biology, where compact genotypes encode complex phenotypes such as the human body, a structure built of
The method proposed here introduces a novel parameter search technique that makes use of a biologically-inspired evolutionary developmental algorithm called ET (for Epigenetic Tracking). ET allows evolution and development of very large complex artificial systems built from cells with diverse cell types (Fontana, 2008), and modeling of biologically-relevant phenomena (Fontana, 2009), such as
ALIFE 14: Proceedings of the Fourteenth International Conference on the Synthesis and Simulation of Living Systems
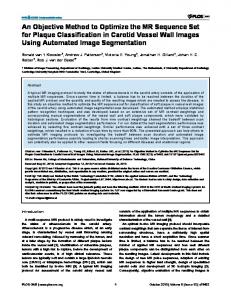
Figure 1: Structure of a stem cell. A stem cell is composed of one mobile code and several developmental genes. If the regulatory set of the developmental gene matches the mobile code of the cell and the timer matches the global clock, that particular developmental gene is activated and a change event (in this case a proliferation) is produced.
regeneration (Fontana and Wr´obel, 2013a) and carcinogenesis (Fontana and Wr´obel, 2013b) and the hypothetical transfer of genetic elements from soma to germline (Fontana and Wr´obel, 2012). In the current study, cells are mapped to neural network weights and the method is tested on an image classification problem (hand-written images from the MNIST dataset; LeCun and Cortes, 1998). The results demonstrate, to the best of our knowledge, unmatched performance on the MNIST dataset with purely evolutionary methods. The rest of the paper is organized as follows. We first describe ET as a model of developmental biology. We then explain the new method proposed here, and its application to searching weights in artificial neural networks. In Experimental Results we show how the method can be used in an image classification task. The final sections discuss the implications of our results and draw the conclusions.
The cellular model of development This section gives an overview of ET, a model of development introduced in (Fontana, 2008), and belonging to the field of Artificial Embryology (Stanley and Miikkulainen, 2003). Notable examples of Artificial Embryology models are (Gruau et al., 1996; Eggenberger-Hotz, 1997; CussatBlanc, 2008). In ET, artificial bodies are composed of two categories of cells: stem cells and normal cells, placed on a grid. Artificial development starts with the value of a global clock set to 0, and with one or several stem cells on the grid. Each stem cell (Fig. 1) has a unique mobile code, but all
Figure 2: Illustration of the ability of ET to develop cellular structures similar to a target that contains regular patterns and irregularities. Two developmental sequences are shown, each in seven 1000 × 1000 frames (the frames with a red border are the targets).
cells have the same genome, which consists of developmental genes. All cells have access to the same temporal information provided by the global clock. As the clock advances, developmental genes are activated. When a developmental gene is activated in a stem cell, the right part of the gene specifies a change event orchestrated by the cell. Two types of change events, proliferation and apoptosis, result—respectively—in filling a volume around the stem cell with new cells (displacing older cells if present), or deleting the cells around this stem cell (leaving an empty space). Where and when the change event occurs is specified by the left part of the developmental gene, consisting of a regulatory set and a timer. A gene is activated in the stem cell whose mobile code matches the regulatory set, and when the global clock matches the timer. Thus, the mobile code corresponds in biology to regulators (such as transcription factors) specific for a given cell; the global clock corresponds to regulators that provide the temporal information in development (to which all cells have access); the regulatory set and the timer correspond to the regulatory sequences to which regulators can bind. In the current software implementation, the clock and the timer are integers, while the mobile code and the regulatory set are arrays of integers (each number in the array can be interpreted as a transcription factor or a regulatory locus, respectively). After a proliferation, normal cells which are sufficiently distant (the distance is a parameter of the system) from any stem cell are turned into new stem cells. This process of stem cell formation is inspired by the recently emerging paradigm of dymanic stemness (Cruz et al., 2012; Roesch
ALIFE 14: Proceedings of the Fourteenth International Conference on the Synthesis and Simulation of Living Systems
et al., 2010). In this novel view, stemness is considered as a dynamic property: the stem-non stem conversion would occur in both directions, triggered by genetic and epigenetic factors, and influenced by the cellular microenvironment. In the ET implementation used in this paper, the stem cell formation mechanism results in stem cells evenly spaced in the body (a simplification of the biological reality introduced for computational reasons). Each new stem cell receives a new and unique mobile code. This developmental model can be evolved by means of a genetic algorithm, and becomes an evo-devo process (examples of other evo-devo models are Joachimczak and Wr´obel, 2009; Cheney et al., 2013). Briefly, in every generation a fitness value is obtained for each genome in the population. The fitness is computed by testing the network at the end of the developmental process, i.e. when the value of the global clock reaches a pre-specified value. The fitness may be determined as the proximity to a predefined target structure, as it was done in previous work (Fontana, 2008), or by other measures, as it is described in the next section. A peculiar feature in this implementation of the genetic algorithm, called progressive freezing (Fontana, 2012), warrants a more detailed description. With progressive freezing, the genomes are separated in sections of G (20 in the current implementation) genes, each with the same timer value. Sections are executed in a sequential order, as the global clock advances. During simulated evolution, only one section of all genomes evolves for a number of generations, which means that mutations affect the regulatory sets and right parts only of the genes in the section being currently evolved. Development ends (and the fitness is calculated for the genome) when the clock strikes the number corresponding to the section under evolution. The other sections of the genome remain unchanged (“frozen”). A parameter specifies for how many generations a section evolves. More details of the genetic algorithm are provided in the Appendix.
From cell structures to neural networks The coupling of the model of development and the genetic algorithm, described in the previous section, gives origin to an evo-devo process, which was proven capable to “devoevolve” structures of unprecedented complexity when proximity of the developed cellular structure to a pre-specified target was used as a fitness measure. Let us consider two 2-dimensional target structures that contain regularities and particularities (Fig. 2). Although the search of genomes regulating development of structures similar to a target is not the purpose of this study, these two examples show the capability of ET when dealing with search spaces with a large number of parameters (in this case, colored pixels of an image). In the present study, we build on this capability and propose an extension of ET that creates a more general method for parameter optimization. This new method is called POET (for Parameter Optimization using Epigenetic
Tracking). The following subsections describe how POET exploits 2-dimensional cellular structures to specify weights of a network with arbitrary predefined topology. In this initial study, the focus is limited to indirect developmental encoding of a large number of static weights. Once the cellular structure is interpreted as weights, they do not change during fitness calculation for a particular genome. The task considered is image classification. The fitness is computed on the performance of the network on the classification of sets of images. Using a machine learning terminology, the set of images used during evolution is called “training set”. At the end of evolution, the evolved networks are tested on a set of images that was not seen during evolution. These additional images are the “test set”.
Mapping the parameter space Each weight of a neural network is associated with a progressive index i ∈ {0, N − 1} with N being the total number of weights. Each weight with index i is linked to k locations on the developmental grid—which may or may not be the location of a cell—by means of a mapping function f : i → {(m, n)1 , (m, n)2 ...(m, n)k }, where m, n are coordinates on the grid (Fig. 3). How do cells contribute to a weight in the network? First, each cell has a real value in the range [-1, 1], specified by the genetic material. Then, the value of the weight i is derived by summing the k values of k cells specified by the mapping function f . The function f is initialized randomly and can be modified by a new change event called swap, orchestrated—in addition to proliferation and apoptosis, taken from ET—by dynamic stem cells during the growth of the cellular structure. Development starts from a number of stem cells initially placed on the grid (2500 evenly spaced stem cells in this study), and proceeds through a number of developmental stages (50 in our simulations). In each stage a maximum number of change events (20 proliferation, apoptosis and swap events in total) was allowed to take place. Swap During a swap event, an area around the stem cell exchanges the values of the function f with another area of the grid (Fig. 4). The swap area has the shape of an ellipse whose size, elongation and orientation are specified in the right part of the associated gene. The centers of the two swapped areas are given by the location of the stem cell which gives origin to the swap event and by another couple of coordinates, also contained in the gene’s right part. The swap event has the purpose to cluster in the same area of the grid parameters which are correlated, so that they can be optimized together by means of a proliferation or apoptosis event. Proliferation and apoptosis As in standard ET, when a stem cell undergoes proliferation, the right part of the activated POET gene specifies the shape of the region filled by
ALIFE 14: Proceedings of the Fourteenth International Conference on the Synthesis and Simulation of Living Systems
Figure 3: Parameter mapping in POET. To each cell two numbers are associated: a real valued number, represented by the intensity of shading, and an integer value (shown inside the cell). The value of parameter whose index value is i is calculated by adding all real valued numbers of cells whose integer value is i.
Figure 4: Swap event in POET. Two elliptical regions are selected in the grid and the values contained therein are swapped. This operation leaves the values associated with each cell in the grid (represented by the intensity of shading) unaffected.
new cells in the same way as the swap area, and the same goes for the area emptied during apoptosis (Fig. 5). The activated gene specifies also the differentiation state of the new cells resulting from proliferation. The state includes a real value that contributes to a weight in the neural network.
Neural network and classification An input example in the MNIST set is a 28×28 pixel image. The resulting 784 inputs are fed to an equal number of input neurons in the input layer of the network. A hidden layer comprises 336 neurons, and the output layer has 80 neurons, divided in 4 groups of 20 neurons each (Fig. 6). The structure in this particular setting was devised to classify only the first four digits (0 to 3) of the MNIST dataset. In addition, the network structure is constrained such that the network may be seen as four separate networks with structure
Figure 5: Proliferation events in POET. Proliferations events affect elliptical regions, changing the values (represented by the intensity of shading) inside the regions, without affecting the associated parameter indexes.
784 · 84 · 20 for input, hidden and output neurons, respectively. Each network has 784 · 84 + 84 · 20 = 67536 weights, resulting in a total of 67538 · 4 (subnetworks) = 270144 total weights. This large number is generally considered intractable for any evolutionary search method with direct encoding. The constraints on the network topology imply that the algorithm is evolving effectively four separate networks for each class to be classified. The lack of processing units that extract common features to more classes is in contrast to other approaches in the literature, particularly deep learning. While the present method may indeed be applied to deep structures, the experiments presented here are a proof-ofconcept of the potential of optimizing a very large parameter space. Correspondingly, the grid was divided into four quadrants, each of which associated to a given subnetwork (Fig. 7). In other words, the weights of each subnetwork are mapped to one quadrant only, and the swap event is restricted in such a way as to preserve the “fencing” between quadrants. More specifically, the rule imposed states that, if the center of the source ellissoid of a swap event belongs to quadrant Q, also the center of the destination ellissoid is forced to belong to quadrant Q. An image is assigned a class by observing which of the four output neuron groups has the highest activation value (the sum of activations of all members). In case the first and the second groups have the same activation value, the image is not assigned to any class. The fitness function is expressed as Fitness = 0.75 · (Occ − Oh ) + 0.25 · sign(Occ − Oh ) where Occ is the average output of the neurons in the correct class, Oh is the average value of the highest output group excluding Occ . The first term (Occ − Oh ) is proportional to the margin between the values of the correct class and the best of
ALIFE 14: Proceedings of the Fourteenth International Conference on the Synthesis and Simulation of Living Systems
Figure 6: Structure of the neural network used for the classification of MNIST images (784-pixel images of digits). The network is composed of four subnetworks, each dedicated to a given class (one of four digits). Nodes of the output layer of subnetwork 1 (blue) are fully connected to nodes of the hidden layer of the same subnetwork, which are fully connected to all 784 input nodes. The same is true for the other subnetworks. There is no connections between neurons of different subnetworks.
the other groups (negative if the correct class is not correctly classified); the second term sign(Occ − Oh ) introduces a nonlinear step which gives a fitness premium when a correct classification is achieved. This fitness measure creates a gradient in the fitness landscape towards a correct classification. Preliminary experiments (data not shown) indicated an advantage of this fitness function in comparison to simpler versions that considered only the number of correct classifications.
Experimental results The experiments tackled the classification of four digits, from 0 to 3. Although only a part of the MNIST set was used in this first study, the results demonstrate the feasibility of purely evolved neural weights in image classification. The evolution was performed using 1000 training images for each digit. Fig. 8 shows examples of correctly classified images. At the end of evolution, the set of evolved weights were extracted and tested on a different platform (MATLAB) to verify the performance both on the training set and on the test set of the MNIST dataset. The error rates in classification averaged over four simulations are summarized in Tables 1 and 2. Fig. 9 shows the developed organism of one of the champion networks. From this graphical representation, it is evident that the large search space makes it difficult to understand intuitively how the quarter of a million weights cooperate to perform classification. However, one hypothesis is that each cell proliferation contributes to the extraction
Figure 7: Subdivision of the grid into four quadrants. Each quadrant maps the weights associated to one of the four subnetworks which perform the classification task. The colors correspond to the colors in Fig. 6.
Figure 8: Examples of handwritten digits from the MNIST set that were correctly classified.
of useful features, which then contribute in the output layer to the correct classification. The results outline two important points. The first is that a purely evolutionary algorithm was shown to solve image classification with a large neural network. Although the error rates are worse when compared to the state-of-the-art learning algorithms on the MNIST set, they nevertheless demonstrate the capability of the algorithm to perform classification in such a problem domain, which was traditionally considered intractable with evolutionary algorithms. In particular, it is possible to observe that the network acquires throughout evolution the capability of recognizing well written digits. Fig. 10A shows the case of the digit 3 that was recognized with the highest confidence, while Fig. 10B shows a digit 3 that was misclassified as 2. Interestingly, the second guess was 3. The examples indicate that the algorithm fails in a human-like fashion particularly when the hand-written digit presents ambiguities. A second remarkable aspect is the fact that the algorithm
ALIFE 14: Proceedings of the Fourteenth International Conference on the Synthesis and Simulation of Living Systems
Table 1: Summary of performance for four champion networks evolved in independent runs on a subset of the MNIST training database (1000 examples for each digit class). Training set - Classification error run no. class 0 class 1 class 2 class 3 mean 1.30% 1.80% 11.20% 9.40% 5.93% run 1 run 2 1.80% 3.10% 8.20% 6.10% 4.80% 0.80% 2.10% 10.30% 8.80% 5.50% run 3 run 4 0.70% 2.60% 8.50% 8.00% 4.95% 1.15% 2.40% 9.55% 8.08% 5.29% mean
Table 2: Summary of performance for the four champion networks assessed using a subset of the MNIST database different than the training set (1000 examples for each digit class). Test set - Classification error run no. class 0 class 1 class 2 class 3 mean run 1 0.80% 2.40% 11.60% 8.50% 5.83% run 2 1.20% 4.10% 9.40% 6.40% 5.28% run 3 1.10% 2.30% 10.90% 8.50% 5.70% run 4 0.60% 3.60% 9.10% 6.40% 4.93% mean 0.93% 3.10% 10.25% 7.45% 5.43%
evolved with a limited number of examples, 1000 for each digit class to be exact. The MNIST set, however, contains approximately 6000 examples for each digit. The error rates on the test set, composed of examples (1000 for each digit) that were not seen during evolution, indicate a clear generalization capability. Whereas most evolutionary algorithms tend to exploit the evolutionary environments and to perform less well with new inputs, the proposed POET method appears to generalize well. In particular, we observe that the drop in performance on the test set is extremely small. Tables 1 and 2 indicate that the network 1 has even slightly improved performance, whereas networks 2, 3 and 4 have very marginal drops in performance, 0.48%, 0.20%, and 0.24% respectively. A possible explanation for this fact is that the gene expression mechanisms, from which weights are derived, perform distributed weight changes, rather than specific singleweight mutations. Therefore, rather than fitting single pixels in the input images (which may lead to overfitting), classifications may relay on larger pixel areas. Another hypothesis is that the size of the network (relatively small for such image classification tasks) contributed to reduce the gap in performance between the training and the test set. To sum up, more analysis is needed at this point to explain the high generalization capabilities of the proposed algorithm. Nonetheless, the evidence presented here suggests that the proposed algorithm may implicitly bring high generalization capabilities.
Figure 9: Image of the POET grid at the end of development, for one of the champions in the image classification evolutionary experiments. The grayscale-code indicates the contribution of the cell to weights. Elliptical areas outline the locations of several cell proliferations.
Discussion The results described here demonstrate, for the first time in this particular domain, the full potential of indirect encoding in the optimization of large search spaces. In particular, the method shows that evolutionary search may leave the domain of toy problems and be applied to real world problems such as image recognition and classification. The rationale for the method performance is the ability of ET to devoevolve target shapes of any kind and size. In this work, we have replaced a geometric target with a computational one, and proved that the method still works. Nonetheless, more investigations with different network topologies is needed to assess the intrinsic mechanisms and rules of POET’s search dynamics. The generalization capabilities, suggested by the similar error rates both in the training and in the test set, indicate that the developmental method may extract general features of the input spaces. This encouraging result calls for more analysis on the network topologies that emerge autonomously from the interaction of evolution and development. The absolute error rates on the training set (around 5%) are similar to error rates of other 2-layer neural networks with a similar number of hidden units (300) (LeCun and Cortes, 1998), although those rates refer to the complete MNIST dataset. It is important to observe that this study proposes a proof-of-concept on the use of evolutionary de-
ALIFE 14: Proceedings of the Fourteenth International Conference on the Synthesis and Simulation of Living Systems
A
B
Figure 10: Examples of correct and incorrect classifications. (A) This digit was classified as 3 with the highest confidence. (B) This digit (labelled as 3 in the MNIST set) was classified as 2 with low confidence, the second guess was 3.
velopmental algorithms on image classification problems. A more optimized evolutionary process, for example involving larger populations or more generations (see Appendix), might lead to better performance. A second consideration is that the evolutionary developmental network might be used effectively as a starting point for further training with a standard approach (e.g., error backpropagation or Hebbian learning), possibly resulting in an improvement of the classification rate. The process of development, directed by genetic instructions in stem cells, implies that the phenotype grows during a lifespan before reaching a mature state when it is capable to classify the input images. During development, the morphogenetic process in the current algorithm does not involve neural plasticity. Therefore, an exciting future direction consists in the combination of evolution, development, and plasticity. Particularly in the domain of image classification, in which learning algorithms for deep structures performed the best, the combination of development and learning is of high interest to understand general principles of learning in living organisms. In this work the mapping of the 2D grid points to parameters (the weights) is initially done randomly and then allowed to change by means of swap events under genetic control. This mapping method is only one among many possible, and we are currently entertaining other possibilities. As the model is further improved, we plan to keep using swap events, because they help bring correlated parameters close to each other. Thanks to swap events such parameters can be optimized together. Otherwise they would have to be optimized independently, and encoded (in the case of the genetic algorithm) with separate genes. A final consideration regards the possibile use of the optimization method proposed in this initial work. Here, POET was employed to optimize weights in artificial neural networks. Nevertheless, the method is not limited to this domain and, in fact, any number of parameters in a large search space can be optimized with the proposed method. This will be the matter of future work.
Conclusions A new generative-developmental system for parameter optimization, named POET, is presented. The method is tested on the optimization of weights of a large neural network, evolved to classify handwritten digits from the MNIST database. The results show competitive error rates for evolutionary algorithms (although not for state-of-the-art learning algorithms), but more interestingly, they show impressive generalization capabilities on the test set, a remarkable result for evolutionary methods. To the best of our knowledge, the proposed method is the first purely evolutionary algorithm to search the neural network weights to classify the MNIST database. While this first test was performed on a subset of the MNIST database, and on a shallow neural network, the results are encouraging for the possible future application of POET to deep neural networks and more challenging classification problems.
Appendix This section presents additional implementation details. We provide the source code of our software at www.evosys.org/software. Here a brief description of the key parameters of the algorithm. For the experiments we used a grid size of 1000 × 1000 cells, in which an initial number of 2500 stem cells was injected. The maximum distance between stem cells was 10 grid points (a higher distance elicited the formation of new stem cells). Development was allowed to proceed for 50 developmental stages. In each stage a maximum number of 20 events (proliferation, apoptosis and swap combined) was allowed to take place. The maximum size of the event area was 200 × 200 cells. Each developmental stage was evolved in 1000 generations. Each neural weight was mapped to 3 different positions on the grid. For the genetic algorithm, we used a population size of 512 distinct individuals. Each individual was composed of 1000 genes, and each gene was encoded with 500 base-4 digits, for a total genome size of 500000 digits. We used wheel selection with elitism (the best 64 genomes were copied without mutation in the next generation). We employed the genetic operators of mutation (with probability 0.005 per digit), and crossover (with probability 0.5 for each offspring genome).
Acknowledgements This work was supported by the Polish National Science Center (project BIOMERGE, 2011/03/B/ST6/00399). This work was also partially supported by the European Communitys Seventh Framework Programme FP7/2007-2013, Challenge 2 Cognitive Systems, Interaction, Robotics under grant agreement No 248311 - AMARSi.
ALIFE 14: Proceedings of the Fourteenth International Conference on the Synthesis and Simulation of Living Systems
References Bengio, Y. (2009). Learning deep architectures for AI. Foundations and Trends in Machine Learning, 2(1):1–127. Bianconi, E., Piovesan, A., Facchin, F., Beraudi, A., Casadei, R., Frabetti, F., Vitale, L., Pelleri, M., Tassani, S., Piva, F., PerezAmodio, S., Strippoli, P., and Canaider, S. (2013). An estimation of the number of cells in the human body. Annals of Human Biology, 40(6)2:463–467. Bongard, J. and Pfeifer, R. (2003). Evolving complete agents using artificial ontogeny. In Morpho-functional Machines: The New Species, pages 237–258. Springer. Cheney, N., MacCurdy, R., Clune, J., and Lipson, H. (2013). Unshackling evolution: Evolving soft robots with multiple materials and a powerful generative encoding. In Proceedings of the Genetic and Evolutionary Computation Conference (GECCO), pages 167–174.
Fontana, A. and Wr´obel, B. (2013b). Embryogenesis, morphogens and cancer stem cells: putting the puzzle together. Medical Hypotheses, 81(4):643–649. Gruau, F., Whitley, D., and Pyeatt, L. (1996). A comparison between cellular encoding and direct encoding for genetic neural networks. In Genetic Programming 1996: Proceedings of the 1st Annual Conference, pages 81–89. Hornby, G. (2005). Measuring, enabling and comparing modularity, regularity and hierarchy in evolutionary design. In Proceedings of the Genetic and Evolutionary Computation Conference (GECCO), pages 1729–1736. Joachimczak, M. and Wr´obel, B. (2009). Evolution of the morphology and patterning of artificial embryos: scaling the tricolour problem to the third dimension. In Proceedings of the 10th European Conference on Artificial Life (ECAL), volume 5777 of LNCS, pages 33–41.
Clune, J., Ofria, C., and Pennock, R. (2009). The sensitivity of HyperNEAT to different geometric representations of a problem. In Proceedings of the Genetic and Evolutionary Computation Conference (GECCO), pages 675–682.
Koutn´ık, J., Cuccu, G., Schmidhuber, J., and Gomez, F. (2013). Evolving large-scale neural networks for vision-based reinforcement learning. In Proceedings of the Genetic and Evolutionary Computation Conference (GECCO), pages 1061– 1068.
Cruz, M., Siden, A., Calaf, G., Delwar, Z., and Yakisich, J. (2012). The stemness phenotype model. ISRN Oncology.
Kumar, S. and Bentley, P. (2003). On growth, form and computers. Academic Press.
Cussat-Blanc, S. (2008). From single cell to simple creature morphology and metabolism. In Proceedings of the 11th International Conference on the Simulation and Synthesis of Living Systems (ALife XI), pages 134–141.
LeCun, Y. and Cortes, C. (1998). MNIST handwritten digit database. AT&T Labs [Online]. Available: http://yann. lecun. com/exdb/mnist.
Eggenberger-Hotz, P. (1997). Evolving morphologies of simulated 3d organisms based on differential gene expression. In Proceedings of the 4th International Conference on the Simulation and Synthesis of Living Systems (ALife IV), pages 205– 213. Federici, D. (2004). Using embryonic stages to increase the evolvability of development. In Proceedings of the Genetic and Evolutionary Computation Conference (GECCO) Workshop Program. Fontana, A. (2008). Epigenetic tracking, a method to generate arbitrary shapes by using evo-devo techniques. In Proceedings of the 8th International Conference on Epigenetic Robotics (EPIROB).
Lindenmayer, A. (1968). Mathematical models for cellular interaction in development. Journal of Theoretical Biology, 18:280– 315. Roesch, A., Fukunaga-Kalabis, M., Schmidt, E., Zabierowski, S., Brafford, P., Vultur, A., Basu, D., Gimotty, P., Vogt, T., and Herlyn, M. (2010). A temporarily distinct subpopulation of slow-cycling melanoma cells is required for continuous tumor growth. Cell, 141(4):583–594. Roggen, D. and Federici, D. (2004). Multi-cellular development: is there scalability and robustness to gain? In Parallel Problem Solving from Nature-PPSN VIII, pages 391–400. Springer. Smith, L. and Thelen, E. (1993). A dynamic systems approach to development: applications. The MIT Press.
Fontana, A. (2009). Epigenetic tracking: biological implications. In Proceedings of the 10th European Conference on Artificial Life (ECAL), volume 5777 of LNCS, pages 10–17.
Stanley, K., Clune, J., D’Ambrosio, D., Green, C., Lehman, J., Morse, G., Pugh, J., Risi, S., and Szerlip, P. (2013). CPPNs effectively encode fracture: a response to critical factors in the performance of HyperNEAT. University of Central Florida Dept. of EECS Technical Report CS-TR-13-05.
Fontana, A. (2012). Epigenetic Tracking: an evolutionarydevelopmental approach to generate 3-dimensional simulated structures. PhD thesis, Technical University of Gdansk, Gdansk, Poland.
Stanley, K., D’Ambrosio, D., and Gauci, J. (2009). A hypercubebased encoding for evolving large-scale neural networks. Artificial Life, 15(2):185–212.
Fontana, A. and Wr´obel, B. (2012). A model of evolution of development based on germline penetration of new “no-junk” DNA. Genes, 3:492–504. Fontana, A. and Wr´obel, B. (2013a). An artificial lizard regrows its tail (and more): regeneration of 3-dimensional structures with hundreds of thousands of artificial cells. In Proceedings of the 12th European Conference on Artificial Life (ECAL), pages 144–150.
Stanley, K. and Miikkulainen, R. (2003). A taxonomy for artificial embryogeny. Artificial Life, 9(2):93–130. van den Berg, T. and Whiteson, S. (2013). Critical factors in the performance of HyperNEAT. In Proceedings of the Genetic and Evolutionary Computation Conference (GECCO), pages 759–766. Wolpert, L. and Ticke, C. (2010). Principles of development. Oxford University Press.
ALIFE 14: Proceedings of the Fourteenth International Conference on the Synthesis and Simulation of Living Systems