Hindawi Complexity Volume 2018, Article ID 1967398, 13 pages https://doi.org/10.1155/2018/1967398
Research Article An Improved Differential Evolution Algorithm for a Multicommodity Location-Inventory Problem with False Failure Returns Congdong Li ,1 Hao Guo ,1 Ying Zhang ,2 Shuai Deng
,3 and Yu Wang4
1
School of Management, Jinan University, Guangzhou, Guangdong 510632, China Department of Industrial and Systems Engineering, State University of New York at Buffalo, Buffalo, NY 14260, USA 3 School of Economic Management, Hunan Institute of Technology, Hengyang 421001, China 4 International Business School, Jinan University, Zhuhai, Guangdong 519070, China 2
Correspondence should be addressed to Hao Guo;
[email protected] and Ying Zhang;
[email protected] Received 29 December 2017; Revised 26 September 2018; Accepted 15 October 2018; Published 24 October 2018 Academic Editor: Laszlo T. Koczy Copyright © 2018 Congdong Li et al. This is an open access article distributed under the Creative Commons Attribution License, which permits unrestricted use, distribution, and reproduction in any medium, provided the original work is properly cited. Customer returns are a common phenomenon in many industries, and they have a significant impact on business organizations and their supply chains. False failure returns are returned products that have no functional or cosmetic defects, and they represent a large body of customer returns in practice. In this paper, we develop a mixed-integer nonlinear programming model to study a multicommodity location-inventory problem in a forward-reverse logistics network. This model minimizes the total cost in this network by considering false failure returns, and it also considers many real-world business scenarios in forward and reverse logistics flows. Moreover, we design a new heuristic approach to solve the model efficiently. Finally, numerical experiments are conducted to validate our solution approach and provide meaningful managerial insights.
1. Introduction Reverse logistics is an emerging topic that has attracted many research attentions because of the great importance of customer returns in today’s business. Nowadays, the percentage of customer returns in total sales varies from 5% to 9% for durable goods, and it is up to 35% for fashion apparel products [1]. Since customer returns are more frequent in e-commerce, return rate in online shopping has exceeded 18% of total sales, and especially, it reaches 74% for fashion products [2]. In the retail industry, the value of customer products has exceeded $100 billion per year in the United States [3]. Although many products are returned because of quality issues, a lot of items that have no defects can still be returned for various reasons such as installation difficulties, bad user experience, or price competition. Those items represent a large body of customer returns, and they are defined as “false failure returns” [4]. Forward-reverse logistics network consist of forward flows that are directed from suppliers to customers and
reverse flows of returned products from customers to suppliers. Since network design can contribute to reducing 60% the cost of a firm [5], Supply chain network design is an important strategic decision in supply chain management, and it is a big challenge to business managers. For example, many big companies such as Kodak, Xerox, and General Motors have developed their reverse logistics systems and those efforts are very successful [6]. Currently, many business decisions are made jointly to improve the efficiency of business organizations and their supply chains. Location-inventory problem (LIP) [7] is such a problem that integrates strategical facility location decisions and tactical inventory management decisions, and it can be studied by incorporating many realworld business scenarios to improve the performance of a logistics system. In this paper, we study a multicommodity locationinventory problem (MCLIP) in a forward-reverse logistics network in which the reverse flow consists of false failure returns. This problem is formulated as a mixed-integer nonlinear programming model whose objective function
2 is to minimize the total cost in such a network, and it incorporates many business decisions and processes such as facility locations, return processing, and order fulfillment. More specifically, the solution to this problem will determine the number and locations of hybrid distribution-collection centers (HDCCs), how to use those HDCCs to fulfill orders and collect returns, and how to replenish inventories in those HDCCs. Due to the complexity of LIPs, we also design an improved differential evolution algorithm (IDE) to solve the MCLIP efficiently. Computational results are presented to validate the solution approach, and research implications and managerial insights are also discussed. The rest of this paper is organized as follows: In Section 2, we review related research works in the literature. In Section 3, we describe the research problem and present the mathematical model. In Section 4, we propose a new heuristic approach to solve the problem efficiently. In Section 5, we show computational results and discuss managerial insights. Section 6 concludes the paper and provides directions for future research.
2. Literature Review The design of logistics networks involves several core components such as facility location and inventory management. LIPs have been extensively studied because of their great importance in practice, and Farahani et al. [8] provide a comprehensive review of such works in the literature. In this section, we review the research works on LIPs from the perspective of forward and reverse logistics, respectively. In the literature, most LIPs are studied under forward logistics networks. For example, Daskin et al. [7] study a LIP with the risk-pooling effect and design a Lagrangian relaxation algorithm as the solution approach. Shen et al. [9] use the same integer programming model as that in Daskin et al.[7] and convert it into a set-covering integer programming model and then solve it by column generation. Moreover, LIPs are studied by incorporating many business scenarios and processes. For example, Ozsen et al. [10] consider capacitated warehouses and the impact of multisourcing in addition to Shen et al. [9]. Amiri-Aref et al. [11] study multisourcing location-inventory problem with stochastic demand. Silva et al. [12] and Qu et al. [13] study the stochastic location-inventory problems under different replenishment policies. Mousavi et al. [14] study a seasonal multiple-product location allocation and inventory control problem in a planning horizon consisting of multiple periods. Since business environments are always dynamic, demand uncertainty [15–17] and different risks [18] are also considered. It is emerging to study LIPs in the reverse logistics. Since reverse logistics is an important part of closed-loop supply chains (CLSCs), those works are usually conducted with CLSCs. For example, Diabat et al. [19] study a closedloop location-inventory problem by considering spare parts, Asl-Najafi et al. [20] study a dynamic closed-loop locationinventory problem under disruption risk, and Kaya et al. [21] and Guo et al. [22] extend such studies by incorporating
Complexity
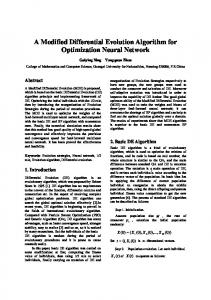
Plant
Forward flow
Candidate HDCC
Reverse flow
Customer Zone
Figure 1: A forward-reverse logistics network with false failure returns.
pricing and vehicle routing decisions in CLSCs, respectively. Since returned products are usually sold to secondary markets in practice, LIPs are also studied by considering CLSCs and secondary markets [23, 24]. Although LIPs have been extensively studied from the perspective of reverse logistics, those works are still very limited because the types of customer returns are rarely considered. This paper studies a LIP in a forward-reverse logistics network in which the reverse logistics flow only consists of false failure returns. To the best of our knowledge, this is the first paper that considers false failure returns in the LIP literature, and it makes a significant contribution to the literature because of the great importance of false failure returns in practice.
3. Mathematical Model 3.1. Problem Description. We consider a three-echelon supply chain network in which a manufacturing plant ships multiple commodities to customer zones via a set of facilities. Moreover, returned products will be collected from customers and shipped to the same facilities. Therefore, those facilities are hybrid distribution-collection centers (HDCCs) [25, 26], and they have many advantages such as cost saving and pollution reduction by improving the efficiency of workflows. In this network, we assume that only false failure returns will be collected. Since those returns do not have any quality issues, they will not be sent to the plant for repair, and instead, they will be resold in the market after some simple processes (e.g., inspection, repackaging, etc.) in HDCCs. Figure 1 shows the forward-reverse logistics network under study. In this network, forward flows will be unidirectional from the plant to HDCCs and then from HDCCs to customer zones, but reverse flows will only be directed from customer zones to
Complexity HDCCs because false failure returns will not be sent to the plant for repair. This paper studies a multicommodity location-inventory problem (MCLIP) in the network shown in Figure 1, and we make the following assumptions to simplify the problem: (i) customer zones are predetermined and fixed; (ii) the returned products will be the same as new items when they are resold to the market; (iii) the distances between HDCCs and customer zones are Euclidean distances. In practice, this problem can be solved to answer the following questions: (1) What are the best locations for HDCCs in this network? (2) How to assign those HDCCs to customer zones in the forward and reverse networks, respectively? (3) How to optimize inventory replenishment decisions at HDCCs? 3.2. Notations Sets 𝑊: set of commodities, indexed by 𝑤; R: set of candidate HDCC locations, indexed by r; I: set of customer zones, indexed by i. Parameters 𝑎𝑟 : fixed (yearly) cost of building a HDCC at location r, for each r∈R; 𝑏𝑟𝑤 : fixed administrative and handling cost of placing an order for product 𝑤 at HDCC r, for each r∈R and 𝑤 ∈ 𝑊; 𝑐𝑟𝑤 : basic transportation cost per shipment of product 𝑤 from the plant to HDCC r, for each r∈R and 𝑤 ∈ 𝑊; 𝑒𝑟𝑤 : additional transportation cost per unit of product 𝑤 from the plant to HDCC r, for each r∈R and 𝑤 ∈ 𝑊; 𝑑𝑟𝑖𝑤 : shipping cost per unit of product 𝑤 from HDCC r to customer zone i, for each r∈R, i∈I and 𝑤 ∈ 𝑊; 𝑓𝑟𝑤 : repackaging/refurbishing cost per unit of returned product 𝑤 at HDCC r, for each r∈R and 𝑤 ∈ 𝑊; 𝑔𝑟𝑤 : inspection cost per unit of returned product 𝑤 at HDCC r, for each r∈R and 𝑤 ∈ 𝑊; ℎ𝑟𝑤 : (yearly) holding cost per unit of product 𝑤 at HDCC r, for each r∈R and 𝑤 ∈ 𝑊; 𝑞𝑤 : return rate of product 𝑤, for each 𝑤 ∈ 𝑊; 𝜇𝑖𝑤 : mean (daily) demand of product 𝑤 at customer zone i, for each i∈I and 𝑤 ∈ 𝑊; 2 : variance of (daily) demand of product 𝑤 at 𝜎𝑖𝑤 customer zone i, for each i∈I and 𝑤 ∈ 𝑊; 𝛼: desired percentage of market demand satisfied; 𝑧𝛼 : standard normal deviation such that 𝑃(𝑧 ≤ 𝑧𝛼 ) = 𝛼; L: order lead time in days at HDCCs;
3 𝜆: working days per year; 𝐷𝑟𝑤 : mean (yearly) demand of product 𝑤 at HDCC r, for each r∈R and 𝑤 ∈ 𝑊. Decision Variables 𝑄𝑟𝑤 : order quantity of product 𝑤 per order at HDCC r; X r = 1 if opening one HDCC at location r, and 0 otherwise, for each r∈R; 𝑌𝑟𝑖𝑤 = 1 if HDCC r fulfills demand at customer zone i, and 0 otherwise, for each r∈R, i∈I and 𝑤 ∈ 𝑊; 𝑍𝑖𝑟𝑤 = 1 if HDCC r collects returns from customer zone i, and 0 otherwise, for each r∈R, i∈I and 𝑤 ∈ 𝑊. 3.3. The Model. In this paper, the research problem is formulated by a mixed-integer nonlinear programming model. The objective of this model is to minimize the total cost in the forward-reverse logistics network, and it comprises (i) location costs, (ii) shipping costs from HDCCs to customer zones, (iii) inventory costs including working inventory and safety stock costs, and (iv) return costs. 3.3.1. Location Cost. Obviously, the total location cost (𝐶𝐿 ) can be written as 𝐶𝐿 = ∑ 𝑎𝑟 𝑋𝑟 . 𝑟∈𝑅
(1)
3.3.2. Shipping Cost from HDCCs to Customer Zones. The total shipping cost (CT ) from HDCCs to customer zones in the forward logistics flow can be expressed as follows: 𝐶𝑇 = 𝜆 ∑ ∑ ∑ 𝜇𝑖𝑤 𝑑𝑟𝑖𝑤 𝑌𝑟𝑖𝑤 . 𝑟∈𝑅 𝑤∈𝑊 𝑖∈𝐼
(2)
3.3.3. Inventory Cost. Inventory strategy plays an important role in supply chain management. In this study, we assume that HDCCs order new products from the plant by using an (R, Q) policy with type I service, and the total inventory cost includes working inventory and safety stock costs. The (R, Q) model can be approximated by an economic order quantity (EOQ) model [9], and Axsater [27] shows that the maximum relative error introduced by using the EOQ model instead of the (Q, r) policy is 0.118. Therefore, we use an EOQ model to optimize the inventory strategy in this study, and the order frequency and quantity at a HDCC will be calculated by using the total demand of the customer zones served by this HDCC. In general, the working inventory cost includes (1) fixed cost of placing orders, (2) shipping cost from the plant to HDCCs, and (3) holding cost of the working inventory. The individual cost terms are formulated as follows. (1) Order Cost. The annual fixed cost of placing orders for product 𝑤 from HDCC r to the plant is given by 𝑏𝑟𝑤 (𝐷𝑟𝑤/𝑄𝑟𝑤 ).
4
Complexity
(2) Shipping Cost from the Plant to HDCCs. Since false failure returns will be resold to the market after they are processed in HDCCs, shipping quantities from the plant to HDCCs will equal the difference between market demands and return volumes. Therefore, the total shipping cost from the plant to HDCC r per year is given by 𝑐𝑟𝑤
𝐷𝑟𝑤 + 𝜆𝑒𝑟𝑤 (∑ 𝜇𝑖𝑤 𝑌𝑟𝑖𝑤 − ∑ 𝑞𝑤 𝜇𝑖𝑤 𝑍𝑖𝑟𝑤 ) . 𝑄𝑟𝑤 𝑖∈𝐼 𝑖∈𝐼
(3)
(3) Holding Cost of the Working Inventory. In this study, the working inventory comes from two sources which are the new products ordered from the plant and the returned products collected from customer zones. Therefore, the forward and reverse logistics flows will be integrated at HDCCs, and the average inventory of product 𝑤 at HDCC r during period T can be expressed as follows: 𝑆 − 𝑞𝑤 𝑆𝑟𝑤 1 𝑇 1 ) 𝑑𝑡 = 𝑆𝑟𝑤 − 𝜃𝑟𝑤 𝑇 ∫ (𝑆𝑟𝑤 − 𝑟𝑤 𝑇 0 𝑇 2 (1 − 𝑞𝑤 ) (1 + 𝑞𝑤 ) 𝑄𝑟𝑤 𝑆𝑟𝑤 = 𝑄 , = − 1 − 𝑞𝑤 2 2 (1 − 𝑞𝑤 ) 𝑟𝑤
𝑖∈𝐼
(1 + 𝑞𝑤 ) ℎ𝑟𝑤 𝑄 . 2 (1 − 𝑞𝑤 ) 𝑟𝑤
𝐶𝑅 = 𝜆 ∑ ∑ ∑ 𝑞𝑤 𝜇𝑖𝑤 (𝑔𝑟𝑤 + 𝑓𝑟𝑤 + 𝑑𝑟𝑖𝑤 ) 𝑍𝑟𝑖𝑤 . 𝑟∈𝑅 𝑤∈𝑊 𝑖∈𝐼
(5)
Using Eppen’s risk-pooling result [28], the amount of safety stock to ensure that stockouts occur with a probability
min 𝑍 = 𝐶𝐿 + 𝐶𝑇 + 𝐶𝐼 + 𝐶𝑅 = ∑ 𝑎𝑟 𝑋𝑟 𝑟∈𝑅
{ 𝐷 + 𝜆 ∑ ∑ ∑ 𝜇𝑖𝑤 𝑑𝑟𝑖𝑤 𝑌𝑟𝑖𝑤 + ∑ ∑ {𝑏𝑟𝑤 𝑟𝑤 𝑄𝑟𝑤 𝑟∈𝑅 𝑤∈𝑊 𝑖∈𝐼 𝑟∈𝑅 𝑤∈𝑊 { + 𝑐𝑟𝑤
𝐷𝑟𝑤 + 𝜆𝑒𝑟𝑤 (∑ 𝜇𝑖𝑤 𝑌𝑟𝑖𝑤 − ∑ 𝑞𝑤 𝜇𝑖𝑤 𝑍𝑖𝑟𝑤 ) 𝑄𝑟𝑤 𝑖∈𝐼 𝑖∈𝐼
+∑
} (1 + 𝑞𝑤 ) ℎ𝑟𝑤 2 𝑌 𝑄𝑟𝑤 + ℎ𝑟𝑤 𝑧𝛼 √ 𝐿 ∑ 𝜎𝑖𝑤 𝑟𝑖𝑤 } 2 (1 − 𝑞𝑤 ) 𝑖∈𝐼 }
𝑖∈𝐼
𝑟∈𝑅 𝑤∈𝑊 𝑖∈𝐼
subject to ∑ 𝑋𝑟 ≥ 1; ∑ 𝑌𝑟𝑖𝑤 = 1,
∀𝑖 ∈ 𝐼, ∀𝑤 ∈ 𝑊;
(10)
∑ 𝑍𝑖𝑟𝑤 = 1,
∀𝑖 ∈ 𝐼, ∀𝑤 ∈ 𝑊;
(11)
2 𝑌 . HDCC r is given by ℎ𝑟𝑤 𝑧𝛼 √𝐿 ∑𝑖∈𝐼 𝜎𝑖𝑤 𝑟𝑖𝑤 Therefore, the total annual inventory cost (CI ) of product 𝑤 at HDCC r is given by
𝑟∈𝑅
𝑖∈𝐼
+∑ 𝑖∈𝐼
(9)
𝑟∈𝑅
𝑟∈𝑅
∑ ∑ 𝑌𝑟𝑖𝑤 = |𝑊| ,
∀𝑖 ∈ 𝐼;
(12)
∑ ∑ 𝑍𝑖𝑟𝑤 = |𝑊| ,
∀𝑖 ∈ 𝐼;
(13)
𝑌𝑟𝑖𝑤 ≤ 𝑋𝑟 ,
∀𝑖 ∈ 𝐼, ∀𝑟 ∈ 𝑅, ∀𝑤 ∈ 𝑊;
(14)
𝑍𝑖𝑟𝑤 ≤ 𝑋𝑟 ,
∀𝑖 ∈ 𝐼, ∀𝑟 ∈ 𝑅, ∀𝑤 ∈ 𝑊;
(15)
𝑟∈𝑅 𝑤∈𝑊
+ 𝜆𝑒𝑟𝑤 (∑ 𝜇𝑖𝑤 𝑌𝑟𝑖𝑤 − ∑ 𝑞𝑤 𝜇𝑖𝑤 𝑍𝑖𝑟𝑤 ) 𝑖∈𝐼
𝑟∈𝑅 𝑤∈𝑊
(6)
(1 + 𝑞𝑤 ) ℎ𝑟𝑤 2 𝑌 . 𝑄 + ℎ𝑟𝑤 𝑧𝛼 √ 𝐿 ∑ 𝜎𝑖𝑤 𝑟𝑖𝑤 2 (1 − 𝑞𝑤 ) 𝑟𝑤 𝑖∈𝐼
∑ ∑ 𝑌𝑟𝑖𝑤 ≥ 𝑋𝑟 ,
∀𝑟 ∈ 𝑅;
𝑤∈𝑊 𝑖∈𝐼
3.3.4. Return Cost. Returns costs are incurred by customer returns, and they include inspection cost, repackaging cost, and shipping cost from customer zones to HDCCs. (1) Inspection Cost. Returned products will be inspected at HDCCs, and the total inspection cost is given by 𝜆 ∑𝑟∈𝑅 ∑𝑤∈𝑊 ∑𝑖∈𝐼 𝑞𝑤 𝜇𝑖𝑤 𝑔𝑟𝑤 𝑍𝑟𝑖𝑤 . (2) Repackaging Cost. The returned products also need to be repackaged before they are resold to the market, and the total repackaging cost is given by 𝜆 ∑𝑟∈𝑅 ∑𝑤∈𝑊 ∑𝑖∈𝐼 𝑞𝑤 𝜇𝑖𝑤 𝑓𝑟𝑤 𝑍𝑟𝑖𝑤 .
(8)
+ 𝜆 ∑ ∑ ∑ 𝑞𝑤 𝜇𝑖𝑤 (𝑔𝑟𝑤 + 𝑓𝑟𝑤 + 𝑑𝑟𝑖𝑤 ) 𝑍𝑟𝑖𝑤
2 𝑌 , and the safety stock cost at of 𝛼 or less is 𝑧𝛼 √𝐿 ∑𝑖∈𝐼 𝜎𝑖𝑤 𝑟𝑖𝑤
𝐷 𝐷 𝐶𝐼 = 𝑏𝑟𝑤 𝑟𝑤 + 𝑐𝑟𝑤 𝑟𝑤 𝑄𝑟𝑤 𝑄𝑟𝑤
(7)
3.3.5. Optimization Model. Given the individual cost functions above, the research problem under study can be formulated by a mixed-integer nonlinear program as follows:
(4)
where 𝑆𝑟𝑤 is the mean daily demand of product 𝑤 at HDCC 𝑟. Consequently, the holding cost of the working inventory is given by ∑
(3) Shipping Cost from Customer Zones to HDCCs. The total shipping cost from customer zones to HDCCs is given by 𝜆 ∑𝑟∈𝑅 ∑𝑤∈𝑊 ∑𝑖∈𝐼 𝑞𝑤 𝜇𝑖𝑤 𝑑𝑟𝑖𝑤 𝑍𝑟𝑖𝑤 . Therefore, the total annual return cost (CR ) is given by
∑ 𝑍𝑖𝑟𝑤 ≤ 𝑀 ∑ 𝑌𝑟𝑖𝑤 , 𝑖∈𝐼
𝑋𝑟 = {0, 1} ,
∀𝑟 ∈ 𝑅, ∀𝑤 ∈ 𝑊;
𝑖∈𝐼
∀𝑟 ∈ 𝑅;
(16) (17) (18)
𝑌𝑟𝑖𝑤 = {0, 1} ,
∀𝑖 ∈ 𝐼, ∀𝑟 ∈ 𝑅, ∀𝑤 ∈ 𝑊;
(19)
𝑍𝑖𝑟𝑤 = {0, 1} ,
∀𝑖 ∈ 𝐼, ∀𝑟 ∈ 𝑅, ∀𝑤 ∈ 𝑊;
(20)
In this model, objective function (8) means that the total cost will be minimized. Constraint (9) means that at least one
Complexity
5
HDCC will be built. Constraint (10) means that the demand of a product in a customer zone will be fulfilled by only one HDCC. Constraint (11) means that the returns of a product from a customer zone will be collected by only one HDCC. Constraint (12) means that all types of products will be provided to a customer zone by HDCCs in the forward flow. Constraint (13) means that all types of returned products will be collected from a customer zone by HDCCs in the reverse flow. Constraints (14) and (15) mean that a customer zone can be assigned to a HDCC in the forward and reverse logistics flows, respectively, only if this HDCC is built. Constraint (16) means that a HDCC will serve at least one customer zone in the forward logistics network after it is built. Constraint (17) means that a HDCC will collect the returns of a product in the reverse flow only if it fulfills the demand of this product in the forward flow. Constraints (18)–(20) indicate that X r , 𝑌𝑟𝑖𝑤 , and 𝑍𝑖𝑟𝑤 are binary variables. Note that decision variable 𝑄𝑟𝑤 only appears in the objective function. Since the objective function is convex in 𝑄𝑟𝑤 , its optimal value can be obtained by taking the partial derivative of the objective function with respect to it, which gives 𝑄∗𝑟𝑤 = √∑ 𝑖∈𝐼
2 (1 − 𝑞𝑤 ) (𝑏𝑟𝑤 + 𝑐𝑟𝑤 ) 𝐷𝑟𝑤 . (1 + 𝑞𝑤 ) ℎ𝑟𝑤
(21)
Therefore, the objective function can be rewritten as follows: min 𝑍 = 𝜆 ∑ ∑ ∑ 𝜇𝑖𝑤 𝑑𝑟𝑖𝑤 𝑌𝑟𝑖𝑤 𝑟∈𝑅 𝑤∈𝑊 𝑖∈𝐼
+ ∑ ∑ √∑ 𝑟∈𝑅 𝑤∈𝑊
𝑖∈𝐼
2𝜆ℎ𝑟𝑤 (1 + 𝑞𝑤 ) (𝑏𝑟𝑤 + 𝑐𝑟𝑤 ) 𝜇𝑖𝑤 𝑌𝑟𝑖𝑤 (1 − 𝑞𝑤 )
+ 𝜆 ∑ ∑ ∑ 𝑒𝑟𝑤 (𝜇𝑖𝑤 𝑌𝑟𝑖𝑤 − 𝑞𝑤 𝜇𝑖𝑤 𝑍𝑖𝑟𝑤 )
(22)
𝑟∈𝑅 𝑤∈𝑊 𝑖∈𝐼
2 𝑌 + ∑ ∑ ℎ𝑟𝑤 𝑧𝛼 √ 𝐿 ∑ 𝜎𝑖𝑤 𝑟𝑖𝑤 + ∑ 𝑎𝑟 𝑋𝑟 𝑟∈𝑅 𝑤∈𝑊
𝑖∈𝐼
Table 1: IDE notations. Notation
Explanation
Np
population size dimension (i.e., number of customer zones in this study) maximum number of generations for evolution number of consecutive iterations if no better individual solution vector of individuals i in generation 𝑔 (i=1, 2, . . ., Np) mutant vector of individuals i in generation 𝑔 (i=1, 2, . . ., Np) trial vector of individuals i in generation 𝑔 (i=1, 2, . . ., Np) mutation factor of individuals i in generation 𝑔 (i=1, 2, . . ., Np) crossover factor
N G K 𝑍𝑖,𝑔 V𝑍𝑖,𝑔 U𝑍𝑖,𝑔 𝐹𝑖,𝑔 CR
factor F based on the Gaussian distribution N(0,1) to enhance the diversity of populations. 4.1. Individuals and Operators. Generally, a DE algorithm has four main operations: initialization, mutation, crossover, and selection. After an initial population is created in the initialization step, the algorithm will execute mutation, crossover, and selection operations iteratively to improve the population until a stop criterion is satisfied. IDE follows the same procedure, and it uses notations shown in Table 1. 4.1.1. Initialization. When DE is applied to solve optimization problems, an encoding-decoding scheme will be needed to convert individuals in DE to the solutions to the optimization model, and vice versa. In IDE, an individual is represented by the matrix shown in (23). 𝑍𝑖,𝑔 𝑖,𝑔
+ 𝜆 ∑ ∑ ∑ 𝑞𝑤 𝜇𝑖𝑤 (𝑔𝑟𝑤 + 𝑓𝑟𝑤 + 𝑑𝑟𝑖𝑤 ) 𝑍𝑟𝑖𝑤 𝑟∈𝑅 𝑤∈𝑊 𝑖∈𝐼
4. Solution Approach Location problems are NP-hard in general [29], and LIPs can be more complicated. Evolutionary algorithms are widely used to solve LIPs, and differential evolution (DE), which was first introduced by Storn and Price [30], is popular method to solve nonlinear and nonconvex functions [31]. Although DE has a strong global search ability to solve such problems, its performance is not always guaranteed due to its weaknesses such as the poor local search ability. To obtain a more stable and effective approach, we design an improved differential evolution algorithm (IDE) to solve MCLIP. More specifically, IDE enhances the performance of DE by two ways: First, IDE introduces opposition-based learning (OBL) [32] to generate better initial populations. Second, it uses a novel mutation
𝑖,𝑔
𝑖,𝑔
𝑖,𝑔
𝑖,𝑔
𝑖,𝑔
𝑥1,1 , 𝑥1,2 , . . . , 𝑥1,𝑁, 𝑦1,𝑁+1 , 𝑦1,𝑁+2 , . . . , 𝑦1,2𝑁
𝑟∈𝑅
=(
...
) , (23)
𝑖,𝑔 𝑖,𝑔 𝑖,𝑔 𝑖,𝑔 𝑖,𝑔 𝑖,𝑔 𝑥𝑊,1 , 𝑥𝑊,2 , . . . , 𝑥𝑊,𝑁, 𝑦𝑊,𝑁+1 , 𝑦𝑊,𝑁+2 , . . . , 𝑦𝑊,2𝑁
𝑖 = 1, 2, . . . , 𝑁𝑝; 𝑔 = 1, 2, . . . , 𝐺;
This matrix has 𝑊 rows and 2N columns. For the research problem under study, 𝑊 and N denote the numbers of commodities and customers, respectively, and the first and last N columns are related to the forward and reverse flows, 𝑖,𝑔 respectively. More specifically, if 𝑥𝑤,𝑗 = 𝑟, then the demand of product 𝑤 in customer zone j will be fulfilled by HDCC r in 𝑖,𝑔 the forward flow, and if 𝑦𝑤,𝑗 = 𝑟, then the returns of product 𝑤 from customer zone j will be collected by HDCC r in the reverse flow. Figure 2 shows an example matrix for a MCLIP that has two commodities, ten customer zones, and five candidate HDCC locations. For product 1, HDCC 1 fulfills demands in customer zones 1, 6, and 10 and collects returns from
6
Complexity Forward logistics Customer
Reverse logistics
1 2
3
4
5
6
7
8
9
10
1
2
3
4
5
6
7
8
9
10
Product 1
1 3
3
2
3
1
2
3
5
1
1
2
5
3
3
2
1
3
1
5
Product 2
2 2
3
5
3
2
3
5
2
5
3
2
2
3
2
5
5
2
5
3
Product
Figure 2: An example individual.
customer zones 1, 7, and 9; HDCC 2 fulfills demands in customer zones 4 and 7 and collects returns from customer zones 2 and 6; HDCC 3 fulfills demands in customer zones 2, 3, 5, and 8 and collects returns from customer zones 4, 5, and 8; HDCC 5 fulfills the demand in customer zone 9 and collects returns from customer zones 3 and 10. For product 2, location decisions can be also explained in the same manner. The aim of encoding is transforming the initial individual to practical solution of LIP. The formulation of decoding is as follows. To decode an individual to a solution to the optimization problem, we can use a mechanism shown in (24) and (25).
Step 1. Generate an initial population Zi,0 randomly:
𝐿 𝑈 𝐿 𝑥𝑖,0 𝑤,𝑗 = 𝑟𝑜𝑢𝑛𝑑 (𝑥 + rand ⋅ (𝑥 − 𝑥 )) ;
𝑖 = 1, 2, . . . , 𝑁𝑝; 𝑗 = 1, 2, . . . , 𝑁; 𝑤 = 1, 2, . . . , 𝑊;
𝑖 = 1, 2, . . . , 𝑁𝑝; 𝑗 = 𝑁 + 1, 𝑁 + 2, . . . , 2𝑁; 𝑤 = 1, 2, . . . , 𝑊; 𝑖,𝑔
(24)
𝑍𝑖,0 𝑖,0 𝑖,0 𝑖,0 𝑖,0 𝑖,0 𝑥𝑖,0 1,1 , 𝑥1,2 , . . . , 𝑥1,𝑁, 𝑦1,𝑁+1 , 𝑦1,𝑁+2 , . . . , 𝑦1,2𝑁
𝑖,0 𝑦𝑤,𝑗 = 𝑈 (𝑟𝑜𝑢𝑛𝑑 (𝑦𝐿 + rand ⋅ (𝑙𝑒𝑛𝑔𝑡ℎ (𝑈) − 1))) ;
𝑖,𝑔
are the lower and upper bounds of 𝑥𝑖,0 𝑤,𝑗 , and round is the rounding function. Obviously, we have xL = yL = 1, and xU is decided by the number of candidate HDCC locations. The 𝑖,0 ensures that product 𝑤 can be returned to expression of 𝑦𝑤,𝑗 a HDCC in the reverse flow only if it provides this product in the forward flow, which is reinforced by Constraint (17) in the optimization model shown in Section 3.3.5. IDE introduce a new mechanism based on OBL to generate better initial populations. More specifically, IDE will improve an initial population that is generated randomly by checking its opposite population by the following steps.
(25)
...
=(
) , (26)
𝑖,0 𝑖,0 𝑖,0 𝑖,0 𝑖,0 𝑥𝑖,0 𝑊,1 , 𝑥𝑊,2 , . . . , 𝑥𝑊,𝑁, 𝑦𝑊,𝑁+1 , 𝑦𝑊,𝑁+2 , . . . , 𝑦𝑊,2𝑁
𝑖,𝑔
where 𝑈 = 𝑢𝑛𝑖𝑞𝑢𝑒(𝑥𝑤,1, 𝑥𝑤,2 , . . . , 𝑥𝑤,𝑁) are distinct HDCCs that provide product w in the forward flow, rand is a random variable that is uniformly distributed on [0, 1], xL and xU
𝑖 = 1, 2, . . . , 𝑁𝑝;
Step 2. Obtain its opposite population 𝑍𝑖,0 :
𝑖,0 𝑖,0 𝑖,0 𝑖,0 𝑖,0 𝑥𝑖,0 1,1 , 𝑥1,2 , . . . , 𝑥1,𝑁, 𝑦1,𝑁+1 , 𝑦1,𝑁+2 , . . . , 𝑦1,2𝑁
𝑍𝑖,0 = (
...
) (27)
𝑖,0 𝑖,0 𝑖,0 𝑖,0 𝑖,0 𝑥𝑖,0 𝑊,1 , 𝑥𝑊,2 , . . . , 𝑥𝑊,𝑁, 𝑦𝑊,𝑁+1 , 𝑦𝑊,𝑁+2 , . . . , 𝑦𝑊,2𝑁 𝐿 𝑈 𝑖,0 𝑥𝑖,0 𝑤,𝑗 = 𝑥 + 𝑥 − 𝑥𝑤,𝑗 ; 𝑖 = 1, 2, . . . , 𝑁𝑝; 𝑗 = 1, 2, . . . , 𝑁; 𝑤 = 1, 2, . . . , 𝑊;
th where 𝑥𝑖,0 𝑤,𝑗 is the entry in row 𝑤 and column j of the 𝑖 𝑖,0 and 𝑦𝑤,𝑗
individual in the opposite population (i=1, 2, . . ., Np; j=N+1, N+2, . . ., 2N; 𝑤=1, 2, . . ., 𝑊) is calculated by (25). Step 3. Select the Np best solutions from {𝑍𝑖,0 ∪ 𝑍𝑖,0 } as initial population.
to the third vector in generation g [30]. In this study, we design a new mutation strategy to improve the diversity of 𝑖,𝑔+1 𝑖,𝑔+1 populations, and new mutant vectors V𝑥𝑤,𝑗 and V𝑦𝑤,𝑗 are generated by (28) and (29). 𝑖,𝑔+1
𝑟2,𝑔
𝑟3,𝑔
𝑖 = 1, 2, . . . , 𝑁𝑝; 𝑗 = 1, 2, . . . 𝑁; 𝑤 = 1, 2, . . . , 𝑊; 𝑖,𝑔+1
4.1.2. Mutation. The mutation strategy plays an important role DE to enhance the global optimization ability and convergence speed. Usually, DE will use DE/rand/1/bin as the mutation operation that will produce a new vector by adding the weighted difference of two randomly selected vectors
𝑟1,𝑔
V𝑥𝑤,𝑗 = 𝑟𝑜𝑢𝑛𝑑 (𝑥𝑤,𝑗 + 𝐹𝑖,𝑔 ⋅ (𝑥𝑤,𝑗 − 𝑥𝑤,𝑗 )) ;
𝑟1,𝑔
𝑟2,𝑔
(28)
𝑟3,𝑔
V𝑦𝑤,𝑗 = 𝑟𝑜𝑢𝑛𝑑 (𝑦𝑤,𝑗 + 𝐹𝑖,𝑔 ⋅ (𝑦𝑤,𝑗 − 𝑦𝑤,𝑗 )) ; 𝑖 = 1, 2, . . . , 𝑁𝑝; 𝑗 = 𝑁 + 1, 𝑁 + 2, . . . , 2𝑁; 𝑤 = 1, 2, . . . , 𝑊;
(29)
where i=r1 ̸ =r2 ̸ =r3, ̸ r1, r2, r3 are randomly selected from {1, 2, . . . , 𝑁𝑝}, 𝐹𝑖,𝑔 = F⋅𝜉𝑖,𝑔 and it amplifies the difference
Complexity
7
between two vectors, F is an initial mutation factor, and 𝜉𝑖,𝑔 is independently generated from the normal distribution 𝑁(0, 1). In the mutation step, the mutation factor will be updated first and then used to generate new mutant vectors, which will improve local and global search abilities and 𝑖,𝑔+1 𝑖,𝑔+1 generate better mutant vectors. If V𝑥𝑤,𝑗 and V𝑦𝑤,𝑗 in a new mutant vector exceed the upper and lower bounds, then the vector will be generated again within its range.
Step 1. Set g = 0 and k = 0.
4.1.3. Crossover. The crossover operation mixes mutate and target vectors to generate trial vectors and increase the diversity of populations. In IDE, the trial vector is generated by (30) and (31).
Step 5. Perform feasibility correction.
𝑖,𝑔+1
𝑖,𝑔 {V𝑥𝑤,𝑗
𝑢𝑥𝑤,𝑗 = { 𝑖,𝑔 𝑥 { 𝑤,𝑗
rand (𝑖) < 𝐶𝑅 𝑜𝑡ℎ𝑒𝑟𝑤𝑖𝑠𝑒
(30)
𝑖 = 1, 2, . . . , 𝑁𝑝; 𝑗 = 1, 2, . . . , 𝑁; 𝑤 = 1, 2, . . . , 𝑊; 𝑖,𝑔
{V𝑦𝑤,𝑗 𝑖,𝑔+1 𝑢𝑦𝑤,𝑗 = { 𝑖,𝑔 𝑦 { 𝑤,𝑗
(31)
𝑖 = 1, 2, . . . , 𝑁𝑝; 𝑗 = 𝑁 + 1, 𝑁 + 2, . . . , 2𝑁; 𝑤 = 1, 2, . . . , 𝑊;
where rand(i) is random variable that is uniformly distributed on [0, 1], and 𝐶𝑅 ∈ [0, 1] is a predefined crossover rate. 4.1.4. Feasibility Correction. A new individual that is generated by mutation or crossover operations may not be feasible by violating Constraint (17). Therefore, a feasibility correction procedure is developed to exclude infeasible individuals. In this study, a new individual will be checked after it is generated. If Constraint (17) is violated, then it will be replaced by a new individual that is randomly generated by (25). 4.1.5. Selection. After a new population is generated, the selection operation will be executed to evaluate the objective values of all trial vectors. In IDE, a trial vector f (U𝑋𝑖,𝑔+1 ) will be compared with the corresponding target vector f (𝑋𝑖,𝑔 ) on their objective values by using a greedy criterion[30]. More specifically, the selection operation can be expressed as follows: 𝑖,𝑔+1
𝑍
𝑖,𝑔+1 {𝑈𝑍 ={ 𝑖,𝑔 {𝑍
𝑓 (𝑈𝑍𝑖,𝑔+1 ) < 𝑓 (𝑍𝑖,𝑔 ) 𝑜𝑡ℎ𝑒𝑟𝑤𝑖𝑠𝑒.
Step 3. Execute mutation operation. Step 4. Execute crossover operation.
Step 6. Execute selection operation. Step 7. Set g = g + 1. Calculate the objective values of all individuals in the new population. If the minimal objective value is less than that in the old population, set k = 1. Otherwise, set k = k + 1. Step 8. If k = K or g = G, stop the algorithm. Otherwise, go to Step 4.
rand (𝑖) < 𝐶𝑅 𝑜𝑡ℎ𝑒𝑟𝑤𝑖𝑠𝑒
Step 2. Create an initial population that consists of Np individuals by applying OBL, and calculate the objective values of all individuals in the population.
(32)
4.1.6. Stop Criterion. In DE, the mutation, crossover, and selection operations will be executed iteratively until a stop criterion is satisfied. In this study, IDE will stop until any of the criteria below is satisfied. (1) No better solution is found in consecutive K iterations. (2) The maximum number of iterations, i.e., G, is reached. 4.2. Algorithm Flow. In summary, IDE consists of the following steps.
5. Computational Results In this section, numerical analysis is presented to validate IDE and provide managerial insights. First, we show how to obtain the optimal setting in IDE for the best possible performance. Second, the solution to an example MCLIP is presented. Third, sensitivity analysis is conducted to study the influences of the parameters in MCLIP. Last, IDE is compared with Lingo 11 and DE to validate its performance. All the experiments are implemented by Java JDK 1.7 on a Windows PC (AMD A10-9600P RADEON R5, 10 COMPUTE CORES 4C+6G 2.40GHz; RAM: 4.00 GB DDR; OS: Windows 10). To get started, we use an example MCLIP that consists of eight candidate HDCC locations, eighty customer zones, and three commodities. The candidate HDCC locations and customer zones are uniformly distributed on a grid of [0,50] × [0,50], and the parameters are shown in Table 2. 5.1. Parameter Analysis. The performance of DE can be significantly affected by its parameters or the combinations of those parameters. In this subsection, we test the performance of IDE under different F and CR values. In this experiment, we set Np = 4S (𝑆 = 𝑁∗𝑊) and the algorithm was executed 30 times under each setting, and the numerical results are shown in Table 3. From Table 3, we can see that F and CR have a significant impact on the searching ability and convergence speed of IDE, which are indicated by OS ratio and CPU time, respectively. Obviously, IDE has the best performance when F = 0.1 and CR = 0.1, and this setting will be used in the subsequent experiments. 5.2. Illustrative Example. This subsection shows the optimal to the example MCLIP. Table 4 shows the optimal solution which indicates HDCC locations and the corresponding customer zones in the forward and reverse flows, and Table 5
8
Complexity Table 2: MCLIP parameters.
Parameters 𝑎𝑟 𝑒𝑟𝑤 ℎ𝑟𝑤 𝜎𝑖𝑤 2
Value 𝑈[1000, 1500] 5 𝑈[1, 3] 𝜎𝑖 2 =𝜇i
Parameters 𝑏𝑟𝑤 𝑓𝑟𝑤 𝑞𝑤 𝑧𝛼
Value U[5, 10] U[1, 3] U[0.3, 0.6] 1.96
Parameters 𝑐𝑟𝑤 𝑔𝑟𝑤 𝜇𝑖𝑤 L
Value 10 U[1, 3] U[20, 30] 1
Remark: 𝑈[a, b] denotes the uniform distribution over [a, b].
Table 3: IDE parameter test results.
F OS Ratio CPU Time OS Ratio CPU Time OS Ratio CPU Time OS Ratio CPU Time OS Ratio CPU Time OS Ratio CPU Time OS Ratio CPU Time OS Ratio CPU Time OS Ratio CPU Time
0.1 0.2 0.3 0.4 0.5 0.6 0.7 0.8 0.9
0.1 96.67% 28.42 96.67% 42.01 0.00% 47.40 0.00% 46.89 0.00% 47.01 0.00% 45.89 0.00% 47.45 0.00% 47.23 0.00% 48.08
0.2 56.67% 22.74 83.33% 35.09 56.67% 46.46 0.00% 47.66 0.00% 47.00 0.00% 47.56 0.00% 47.03 0.00% 47.82 0.00% 44.82
0.3 36.67% 20.13 23.33% 31.17 50.00% 43.12 0.00% 46.78 0.00% 45.49 0.00% 47.17 0.00% 46.94 0.00% 46.28 0.00% 44.95
0.4 3.33% 18.90 10.00% 29.26 20.00% 40.61 3.33% 46.04 0.00% 46.61 0.00% 46.26 0.00% 47.53 0.00% 45.75 0.00% 46.98
CR 0.5 0.00% 17.79 3.33% 27.49 3.33% 38.78 6.67% 45.43 0.00% 46.18 0.00% 44.70 0.00% 44.71 0.00% 45.43 0.00% 46.45
0.6 0.00% 17.16 0.00% 26.76 0.00% 37.51 0.00% 44.88 0.00% 46.28 0.00% 46.78 0.00% 45.39 0.00% 45.27 0.00% 47.66
0.7 0.00% 17.15 0.00% 26.41 0.00% 36.65 0.00% 44.63 0.00% 46.08 0.00% 47.01 0.00% 46.70 0.00% 43.85 0.00% 45.06
0.8 0.00% 16.78 0.00% 26.22 0.00% 36.72 0.00% 44.37 0.00% 44.13 0.00% 45.96 0.00% 45.14 0.00% 46.25 0.00% 45.77
0.9 0.00% 17.33 0.00% 27.18 0.00% 37.19 0.00% 44.32 0.00% 45.53 0.00% 44.89 0.00% 45.11 0.00% 46.59 0.00% 43.33
Remark: in Table 3, the optimal solutions are obtained by Lingo 11, and “OS Ratio” means the percentage of finding optimal solutions by IDE.
shows the optimal value and individual costs in the optimal solution. 5.3. Sensitivity Analysis. The optimal solution of a MCLIP can be affected significantly by important business parameters. In this subsection, sensitivity analysis is conducted on 𝑞𝑤 , 𝑑𝑟𝑖𝑤 , 𝑏𝑟𝑤 , 𝑐𝑟𝑤 , 𝑒𝑟𝑤 , ℎ𝑟𝑤 , 𝑔𝑟𝑤 , and 𝑓𝑟𝑤 to study their influences. More specifically, a parameter will be tested by changing its value by (-30%, 30%) and fixing the other parameters and the numerical results are shown in Table 6. From Table 6, we can see that optimal values can change significantly due to the change of those parameters. For example, the optimal value will decrease by 6.63% if 𝑞𝑤 decreases by 30%, and the optimal value will increase by 6.65% if 𝑞𝑤 increases by 30%. The influences of the parameters on individual costs are summarized as follows: When 𝑞𝑤 increases, CR will increase, CI and will decrease, but CL and CT will not change. When 𝑑𝑟𝑖𝑤 increases, CT and CR will increase but CL and CI will not change. When 𝑏𝑟𝑤 , 𝑐𝑟𝑤 , 𝑒𝑟𝑤 , ℎ𝑟𝑤 increase, only CI will increase and the other costs will not change. When 𝑔𝑟𝑤 or 𝑓𝑟𝑤 increases, only CI will increase. We can see that, in general, 𝑑𝑟𝑖𝑤 and 𝑞𝑤
have the most significant influences. Moreover, the optimal value is more sensitive when 𝑑𝑟𝑖𝑤 , 𝑞𝑤 , and 𝑒𝑟𝑤 are relatively small. In practice, business managers may focus more on those parameters to stabilize the supply chain performance. 5.4. Performance Analysis. In this subsection, IDE is compared with Lingo 11 and DE to validate its performance in terms of solution accuracy and CPU time efficiency, and the three approaches are tested on a set of small(i.e., 20×5×2/3/4, 40×6×2/3/4), medium- (i.e., 50×5/6/7×3, 70×6/7/8×3), and large-sized problems (i.e., 80×8×2/3/4, 100×8/9/10×3). Since population size Np is an important parameter in IDE and it may vary according to the problem sizes, its value needs to be set properly to get the best possible performance. According to Figures 3–5 (in which “red line” represents solution accuracy in terms of the percentage of finding the optimal solutions, and “blue line” represents the mean CPU time), IDE will have the best performance when Np = 3S, 4S, 5S for small-, medium-, and large-sized problems, respectively. Therefore, we will use these settings in the subsequent experiments.
Complexity
9 Table 4: Optimal solution to the example MCLIP.
HDCC Location
Customer Zone (Forward Flow) 48,64,75 48,64,75 48,64,75 4,9.10,11,26,29,30,39,44,45,47,57,68,72 4,9.10,11,26,29,30,39,44,45,47,57,68,72 4,9.10,11,26,29,30,39,44,45,47,57,68,72 12,14,18,22,32,34,43,60,70,71 12,14,18,22,32,34,43,60,70,71 12,14,18,22,32,34,43,60,70,71 2,7,13,35,52,56,58,63,76,80 2,7,13,35,52,56,58,63,76,80 2,7,13,35,52,56,58,63,76,80 5,15,16,19,31,37,38,42,49,62,77,79 5,15,16,19,31,37,38,42,49,62,77,79 5,15,16,19,31,37,38,42,49,62,77,79 3,6,17,20,23,24,36,67,69 3,6,17,20,23,24,36,67,69 3,6,17,20,23,24,36,67,69 8,21,25,28,46,51,53,54,61,65,73,74 8,21,25,28,46,51,53,54,61,65,73,74 8,21,25,28,46,51,53,54,61,65,73,74 1,27,33,40,41,50,55,59,66,78 1,27,33,40,41,50,55,59,66,78 1,27,33,40,41,50,55,59,66,78
Commodity 1 2 3 1 2 3 1 2 3 1 2 3 1 2 3 1 2 3 1 2 3 1 2 3
1
2
3
4
5
6
7
8
Customer Zone (Reverse Flow) 48,64,75 48,64,75 48,64,75 4,9.10,11,26,29,30,39,44,45,47,57,68,72 4,9.10,11,26,29,30,39,44,45,47,57,68,72 4,9.10,11,12,26,29,30,39,44,45,47,57,68,71,72 12,14,18,22,32,34,43,60,70,71 12,14,18,22,32,34,38,43,60,70,71,79 14,18,22,32,34,43,60,70 2,7,35,52,56,58,80 2,7,13,35,52,56,58,63,76,80 2,7,8,13,21,35,51,52,56,58,61,63,76,80 5,15,16,19,31,37,38,42,49,62,77,79 5,15,16,19,31,37,42,49,62,77, 5,15,16,19,31,37,38,42,49,62,77,79 3,17,20,23,24,36,67,69 3,6,17,20,23,24,36,67,69 3,6,17,20,23,24,36,67,69 6,8,13,21,25,27,2846,51,53,54,61,63,65,73,74,76 8,21,25,28,46,51,53,54,61,65,73,74 25,28,46,53,54,65,73,74 1,33,40,41,50,55,59,66,78 1,27,33,40,41,50,55,59,66,78 1,27,33,40,50,55,59,66,78
Table 5: Optimal value and individual costs.
100.00%
100.00% 73.33% 5.19
60.00% 40.00%
0.00%
100.00% 7.02
80.00%
3.49 1.80 3.33%
1S
2S
3S Np
4S
10.00 9.00 8.90 100.00%8.00 7.00 6.00 5.00 4.00 3.00 2.00 1.00 0.00 5S
𝐶𝑅 11617106.42
Total 32943770.22
Medium-size problem 120.00%
30.00 25.19
100.00%
100.00% 25.00 20.85 96.67%
80.00%
20.00
15.47
60.00%
15.00
60.00% 10.32
40.00%
10.00
CPU Time
Small-size problem
120.00%
20.00%
𝐶𝐼 4665316.68
Ratio of optimal solution
𝐶𝑇 16651085.12
CPU Time
Ratio of optimal solution
𝐶𝐿 10262
5.29
20.00% 0.00%
5.00
20.00%
1S
0.00%
2S
3S Np
4S
5S
0.00
Figure 3: Analysis of Np for small-sized problems (40×6×4).
Figure 4: Analysis of Np for medium-sized problems (70×8×3).
Table 7 shows the comparison results between IDE, DE, and Lingo 11. To avoid biased results, IDE and DE were executed 30 times for each test instance. Therefore, in this table, “O.V.” means the optimal value, “O.V. (Best)” and “O.V. (Mean)” represent the best and mean optimal values in 30 runs, respectively, “OS Ratio” means the percentage of finding the optimal solutions, and “S.D.” means the standard deviation of optimal values in 30 runs.
From Table 7, we can see that IDE is the most effective and efficient method to solve MCLIPs, and its advantages over Lingo 11 and DE are summarized as follows: (1) The optimal values obtained by IDE and Lingo 11 were almost identical, but IDE has better runtimes than Lingo 11. This indicates that IDE is much more efficient than Lingo 11 with the same solution accuracy.
10
Complexity Table 6: Sensitivity analysis results. Δ
𝑞𝑤
𝑑𝑟𝑖𝑤
𝑏𝑟𝑤
𝑐𝑟𝑤
𝑒𝑟𝑤
ℎ𝑟𝑤
𝑔𝑟𝑤
𝑓𝑟𝑤
-30.00% 5967659.67 27.92% 8131974.50 -30.00% 30760981.29 -6.63% 11655759.59 -30.00% 9141586.34 -21.31% 25472924.60 -22.68% 4659545.89 -0.12% 32937999.43 -0.02% 4657224.85 -0.17% 32935678.39 -0.02% 3292753.68 -29.42% 31571207.22 -4.17% 4650403.35 -0.32% 32928856.89 -0.05% 11058612.56 -4.81% 32385276.36 -1.70% 11146187.90 -4.05% 32472851.69 -1.43%
CI Gap CR Gap OV Gap CT Gap CR Gap OV Gap CI Gap OV Gap CI Gap OV Gap CI Gap OV Gap CI Gap OV Gap CR Gap OV Gap CR Gap OV Gap
-20.00% 5532973.87 18.60% 9293685.14 -20.00% 31488006.13 -4.42% 13320868.10 -20.00% 9969691.59 -14.18% 27966138.37 -15.11% 4661513.59 -0.08% 32939967.13 -0.01% 4660009.99 -0.11% 32938463.54 -0.02% 3750274.68 -19.61% 32028728.22 -2.78% 4655668.91 -0.21% 32934122.46 -0.03% 11245420.25 -3.20% 32572084.05 -1.13% 11303872.70 -2.70% 32630536.49 -0.95%
-10.00% 5098809.85 9.29% 10455395.78 -10.00% 32215552.76 -2.21% 14985976.61 -10.00% 10793951.68 -7.09% 30455506.97 -7.55% 4663436.18 -0.04% 32941889.73 -0.01% 4662704.48 -0.06% 32941158.03 -0.01% 4207795.68 -9.81% 32486249.22 -1.39% 4660623.12 -0.10% 32939076.67 -0.01% 11431721.41 -1.60% 32758385.21 -0.56% 11461479.65 -1.34% 32788143.45 -0.47%
0.00% 4665316.678 0.00% 11617106.42 0.00% 32943770.22 0.00% 16651085.12 0.00% 11617106.42 0.00% 32943770.22 0.00% 4665316.678 0.00% 32943770.22 0.00% 4665316.678 0.00% 32943770.22 0.00% 4665316.678 0.00% 32943770.22 0.00% 4665316.678 0.00% 32943770.22 0.00% 11617106.42 0.00% 32943770.22 0.00% 11617106.42 0.00% 32943770.22 0.00%
10.00% 4232715.54 -9.27% 12778817.06 10.00% 33672879.73 2.21% 18316193.63 10.00% 12437398.32 7.06% 35429170.64 7.54% 4667157.74 0.04% 32945611.28 0.01% 4667853.73 0.05% 32946307.27 0.01% 5122837.68 9.81% 33401291.22 1.39% 4669787.84 0.10% 32948241.39 0.01% 11802239.42 1.59% 33128903.22 0.56% 11770266.78 1.32% 33096930.58 0.46%
20.00% 3801356.65 -18.52% 13940527.71 20.00% 34403231.48 4.43% 19981302.15 20.00% 13255554.35 14.10% 37912435.18 15.08% 4668961.77 0.08% 32947415.32 0.01% 4670321.79 0.11% 32948775.33 0.02% 5580358.68 19.61% 33858812.22 2.78% 4674066.35 0.19% 32952519.89 0.03% 11987372.42 3.19% 33314036.22 1.12% 11922189.48 2.63% 33248853.28 0.93%
30.00% 3371846.74 -27.73% 15102238.35 30.00% 35135432.21 6.65% 21646410.66 30.00% 14073565.94 21.15% 40395555.28 22.62% 4670730.94 0.12% 32949184.48 0.02% 4672726.23 0.16% 32951179.77 0.02% 6037879.68 29.42% 34316333.22 4.17% 4678175.84 0.28% 32956629.38 0.04% 12172505.42 4.78% 33499169.22 1.69% 12073560.78 3.93% 33400224.58 1.39%
Remark: in Table 6, “OV” means the optimal value, and “Gap” means the change of the optimal value. Note that the gap will be zero if no parameter is changed.
Large-size problem 100.00%100.00 88.87
80.00%
80.00 71.80
60.00%
60.00
60.00% 52.92
40.00% 20.00% 0.00%
40.00
35.88 26.67%
20.00
18.03 0.00%
1S
0.00%
2S
3S Np
4S
5S
0.00
Figure 5: Analysis of Np for large-sized problems (100×10×3).
CPU Time
Ratio of optimal solution
100.00%
(2) IDE and DE can achieve similar solution accuracies on small- and medium-sized problems. However, the optimal values from DE are significantly larger than those from IDE on large-sized problems. Particularly, DE cannot find optimal solutions for the problems whose sizes are over (100×9×3). This indicates that IDE has a great global search ability and is more stable and consistent than DE. (3) IDE has better runtimes than DE in most test instances, and it has a greater advantage on large-sized problems. This indicates that IDE is more efficient than DE.
6
40
2 3 4
3
8
8 9 10
100
3
3
2 3 4 2 3 4
|𝑊|
80
70
5 6 7 6 7 8
5
20
50
|𝑅|
|𝐼|
Instance
Lingo 11 CPU Time O.V. (S) 6987580 6 10355510 15 13487440 27 12598710 53 18642000 135 24367940 263 23313920 123 23017930 229 19471180 326 31652380 472 30150360 1394 28295930 1993 21939770 721 32943770 2974 43234620 >3600 39081930 >3600 38614670 >3600 36450520 >3600 O.V. (Best) 6987580.30 10355509.01 13487441.55 12598709.04 18642000.91 24367942.66 23313920.93 23017934.37 19471179.29 31652384.45 30150355.84 28295927.33 21939767.66 32943770.22 43234618.55 39081579.93 39767341.71 37621661.96
O.V. (Mean) 6997722.08 10358913.98 13488007.01 12608013.39 18643688.34 24368298.67 23316057.84 23018947.56 19471323.45 31652401.08 30150535.41 28296407.75 21939991.65 32943973.24 43234779.15 39081760.66 40015199.70 37827792.61 21/30 26/30 29/30 16/30 26/30 26/30 26/30 27/30 28/30 29/30 27/30 25/30 28/30 29/30 29/30 28/30 0/30 0/30
OS Ratio
DE CPU Time (S) - T1 0.14 0.34 0.65 1.01 2.71 5.71 4.85 6.78 9.57 16.17 21.51 22.89 13.28 41.51 91.60 115.95 102.18 124.76 0.01 0.05 0.05 0.06 0.08 0.14 0.32 0.16 0.17 0.50 0.47 0.43 0.24 1.15 1.84 2.07 0.90 0.74
S.D.
O.V. (Best) 6987580.30 10355509.01 13487441.55 12598709.04 18642000.91 24367942.66 23313920.93 23017934.37 19471179.29 31652384.45 30150355.84 28295927.33 21939767.66 32943770.22 43234618.55 39081579.93 38614396.07 36450173.57
Table 7: Lingo 11 versus DE versus IDE. O.V. (Mean) 6987580.30 10355509.01 13487441.55 12598750.74 18642000.91 24367942.66 23313920.93 23017934.37 19471179.29 31652384.45 30150355.84 28295939.60 21939767.66 32943770.22 43234618.55 39081579.93 38614592.75 36450173.57
30/30 30/30 30/30 29/30 30/30 30/30 30/30 30/30 30/30 30/30 30/30 29/30 30/30 30/30 30/30 30/30 29/30 30/30
OS Ratio
IDE CPU Time (S) - T2 0.14 0.35 0.67 0.89 2.50 5.19 5.03 6.05 7.45 16.26 18.28 20.85 12.05 35.76 74.05 69.93 83.84 88.87
0.01 0.03 0.05 0.04 0.08 0.10 0.21 0.12 0.16 0.60 0.42 0.53 0.31 0.72 1.35 1.45 1.72 2.74
S.D.
-3.95% -2.63% -3.08% 11.68% 7.71% 9.02% -3.68% 10.76% 22.14% -0.56% 14.99% 8.92% 9.31% 13.83% 19.15% 39.69% 17.95% 28.76%
(T1-T2) / T1
Complexity 11
12 According to the comparison results, we can see that IDE is the best approach to solve MCLIPs compared with DE and Lingo 11.
6. Conclusion and Future Research In this paper, we study a multicommodity location-inventory problem by considering false failure returns in a forwardreverse logistics network. To the best of our knowledge, this is the first work that considers false failure returns to optimize joint location-inventory decisions, and it contributes to the literature because of the great importance of false failure returns in practice. This research can be extended in several directions: First, other types of returns such as defective items can be considered to make this study more practical. Second, the (R, Q) model is adopted to replenish inventories in this work. However, there are other popular inventory control policies in practice, and it will be interesting to explore them and compare their performances in forward-reverse logistics networks. Third, it will be valuable to study location-inventoryrouting problems by considering false failure returns.
Complexity
[9]
[10]
[11]
[12]
[13]
[14]
[15]
Conflicts of Interest The authors declare that they have no conflicts of interest. [16]
Acknowledgments This research was supported by the National Natural Science Foundation of China under Grants nos. 71672074 and 71772075.
References [1] V. D. R. Guide Jr., G. C. Souza, L. N. van Wassenhove, and J. D. Blackburn, “Time value of commercial product returns,” Management Science, vol. 52, no. 8, pp. 1200–1214, 2006. [2] Z. Hua, H. Hou, and Y. Bian, “Optimal Shipping Strategy and Return Service Charge under No-Reason Return Policy in Online Retailing,” IEEE Transactions on Systems, Man, and Cybernetics: Systems, vol. 47, no. 12, pp. 3189–3206, 2017. [3] J. Stock, T. Speh, and H. Shear, “Many happy (product) returns,” Harvard Business Review, vol. 80, no. 7, p. 16, 2002. [4] M. Ferguson, V. D. R. Guide Jr., and G. C. Souza, “Supply chain coordination for false failure returns,” Manufacturing and Service Operations Management, vol. 8, no. 4, pp. 376–393, 2006. [5] T. P. Harrison, The Practice of Supply Chain Management: Where Theory And Application Converge, Springer Science & Business Media, 2005. [6] M. S. Pishvaee, F. Jolai, and J. Razmi, “A stochastic optimization model for integrated forward/reverse logistics network design,” Journal of Manufacturing Systems, vol. 28, no. 4, pp. 107–114, 2009. [7] M. S. Daskin, C. R. Coullard, and Z. J. M. Shen, “An inventorylocation model: formulation, solution algorithm and computational results,” Annals of Operations Research, vol. 110, pp. 83– 106, 2002. [8] R. Z. Farahani, H. Rashidi Bajgan, B. Fahimnia, and M. Kaviani, “Location-inventory problem in supply chains: A modelling
[17]
[18]
[19]
[20]
[21]
[22]
[23]
[24]
review,” International Journal of Production Research, vol. 53, no. 12, pp. 3769–3788, 2015. Z.-J. M. Shen, C. R. Coullard, and M. S. Daskin, “A joint location-inventory model,” Transportation Science, vol. 37, no. 1, pp. 40–55, 2003. L. Ozsen, M. S. Daskin, and C. R. Coullard, “Facility location modeling and inventory management with multisourcing,” Transportation Science, vol. 43, no. 4, pp. 455–472, 2009. M. Amiri-Aref, W. Klibi, and M. Z. Babai, “The multi-sourcing location inventory problem with stochastic demand,” European Journal of Operational Research, vol. 266, no. 1, pp. 72–87, 2018. F. Silva and L. Gao, “A Joint Replenishment Inventory-Location Model,” Networks and Spatial Economics, vol. 13, no. 1, pp. 107– 122, 2013. Q. Hui, W. Lin, and L. Rui, “A contrastive study of the stochastic location-inventory problem with joint replenishment and independent replenishment,” Expert Systems with Applications, vol. 42, no. 4, pp. 2061–2072, 2015. S. M. Mousavi, N. Alikar, S. T. A. Niaki, and A. Bahreininejad, “Optimizing a location allocation-inventory problem in a twoechelon supply chain network: a modified fruit fly optimization algorithm,” Computers & Industrial Engineering, vol. 87, pp. 543–560, 2015. M. a. Schuster Puga and J.-S. Tancrez, “A heuristic algorithm for solving large location-inventory problems with demand uncertainty,” European Journal of Operational Research, vol. 259, no. 2, pp. 413–423, 2017. A. Diabat, E. Dehghani, and A. Jabbarzadeh, “Incorporating location and inventory decisions into a supply chain design problem with uncertain demands and lead times,” Journal of Manufacturing Systems, vol. 43, pp. 139–149, 2017. J. Shu, Q. Ma, and S. Li, “Integrated location and two-echelon inventory network design under uncertainty,” Annals of Operations Research, vol. 181, pp. 233–247, 2010. M. Farahani, H. Shavandi, and D. Rahmani, “A locationinventory model considering a strategy to mitigate disruption risk in supply chain by substitutable products,” Computers & Industrial Engineering, vol. 108, pp. 213–224, 2017. A. Diabat, T. Abdallah, and A. Henschel, “A closed-loop location-inventory problem with spare parts consideration,” Computers & Operations Research, vol. 54, pp. 245–256, 2015. J. Asl-Najafi, B. Zahiri, A. Bozorgi-Amiri, and A. TaheriMoghaddam, “A dynamic closed-loop location-inventory problem under disruption risk,” Computers & Industrial Engineering, vol. 90, pp. 414–428, 2015. O. Kaya and B. Urek, “A mixed integer nonlinear programming model and heuristic solutions for location, inventory and pricing decisions in a closed loop supply chain,” Computers & Operations Research, vol. 65, pp. 93–103, 2016. H. Guo, C. Li, Y. Zhang, C. Zhang, and Y. Wang, “A Nonlinear Integer Programming Model for Integrated Location, Inventory, and Routing Decisions in a Closed-Loop Supply Chain,” Complexity, vol. 2018, pp. 1–17, 2018. H. Guo, C. Li, Y. Zhang, C. Zhang, and M. Lu, “A LocationInventory Problem in a Closed-Loop Supply Chain with Secondary Market Consideration,” Sustainability , vol. 10, no. 6, p. 1891, 2018. H. Guo, Y. Zhang, C. Zhang, Y. Liu, and Y. Zhou, “Locationinventory decisions for closed-loop supply chain management in the presence of the secondary market,” Annals of Operations Research.
Complexity [25] M. S. Pishvaee, R. Z. Farahani, and W. Dullaert, “A memetic algorithm for bi-objective integrated forward/reverse logistics network design,” Computers & Operations Research, vol. 37, no. 6, pp. 1100–1112, 2010. [26] S. M. Hatefi and F. Jolai, “Robust and reliable forward-reverse logistics network design under demand uncertainty and facility disruptions,” Applied Mathematical Modelling, vol. 38, no. 9-10, pp. 2630–2647, 2014. [27] S. Axs¨ater, “Using the deterministic EOQ formula in stochastic inventory control,” Management Science, vol. 42, no. 6, pp. 830– 834, 1996. [28] G. D. Eppen, “Note—Effects of Centralization on Expected Costs in a Multi-Location Newsboy Problem,” Management Science, vol. 25, no. 5, pp. 498–501, 1979. [29] Z.-J. M. Shen, “Integrated supply chain design models: a survey and future research directions,” Journal of Industrial and Management Optimization, vol. 3, no. 1, pp. 1–27, 2007. [30] R. Storn and K. Price, “Differential evolution—a simple and efficient heuristic for global optimization over continuous spaces,” Journal of Global Optimization, vol. 11, no. 4, pp. 341– 359, 1997. [31] B. Alatas, E. Akin, and A. Karci, “MODENAR: Multi-objective differential evolution algorithm for mining numeric association rules,” Applied Soft Computing, vol. 8, no. 1, pp. 646–656, 2008. [32] R. S. Rahnamayan, H. R. Tizhoosh, and M. M. A. Salama, “Opposition-based differential evolution,” IEEE Transactions on Evolutionary Computation, vol. 12, no. 1, pp. 64–79, 2008.
13
Advances in
Operations Research Hindawi www.hindawi.com
Volume 2018
Advances in
Decision Sciences Hindawi www.hindawi.com
Volume 2018
Journal of
Applied Mathematics Hindawi www.hindawi.com
Volume 2018
The Scientific World Journal Hindawi Publishing Corporation http://www.hindawi.com www.hindawi.com
Volume 2018 2013
Journal of
Probability and Statistics Hindawi www.hindawi.com
Volume 2018
International Journal of Mathematics and Mathematical Sciences
Journal of
Optimization Hindawi www.hindawi.com
Hindawi www.hindawi.com
Volume 2018
Volume 2018
Submit your manuscripts at www.hindawi.com International Journal of
Engineering Mathematics Hindawi www.hindawi.com
International Journal of
Analysis
Journal of
Complex Analysis Hindawi www.hindawi.com
Volume 2018
International Journal of
Stochastic Analysis Hindawi www.hindawi.com
Hindawi www.hindawi.com
Volume 2018
Volume 2018
Advances in
Numerical Analysis Hindawi www.hindawi.com
Volume 2018
Journal of
Hindawi www.hindawi.com
Volume 2018
Journal of
Mathematics Hindawi www.hindawi.com
Mathematical Problems in Engineering
Function Spaces Volume 2018
Hindawi www.hindawi.com
Volume 2018
International Journal of
Differential Equations Hindawi www.hindawi.com
Volume 2018
Abstract and Applied Analysis Hindawi www.hindawi.com
Volume 2018
Discrete Dynamics in Nature and Society Hindawi www.hindawi.com
Volume 2018
Advances in
Mathematical Physics Volume 2018
Hindawi www.hindawi.com
Volume 2018