The possibilities of the application of the wavelet decomposition of Acoustic ... The authors of this paper have designed a dedicated software for monitoring the ...
Molecular and Quantum Acoustics vol. 27, (2006)
227
APPLICATION OF WAVELET TRANSFORM FOR MONITORING OF OPERATION OF HIGH-POWER DIESEL ENGINE Z. RANACHOWSKI1, A. BEJGER 2 1
Institute of Fundamental Technological Research (IFTR),PAS, 00-049 Świętokrzyska 21 Warszawa,Poland
2
Maritime University of Szczecin, 70-205, Podgórna 51, Szczecin, Poland
The possibilities of the application of the wavelet decomposition of Acoustic Emission (AE) signal of frequency range of 1.2 – 10 kHz for diagnosing of common faults of the fuel injection system of a high-power Diesel engine is presented. AE signal
was
recorded
in
two
locations : on the stub inlet to the injector and on the stub outlet of the fuel pump.
1. INTRODUCTION Wavelet transform is now widely applied as a method of analyzing of noisy data collected from the sensors monitoring the operation of machines or detecting the defects in manufactured products. In [1] there was a description of wavelet filtering process to improve the quality of ultrasonic images used in non-destructive products testing. A. K. Frances et al. [2] made identification of faults in a small 40 kW Diesel engine using the procedure of recording the emitted acoustic emission signal and then filtering the raw data with the application of Haar wavelet decomposition algorithm. The following faults were recognized within the investigation : reduced injector discharge pressure and leakage of the exhaust manifold gasket. The overall look at the wavelet transforms applied in non-destructive testing of products and objects can be also found in [3]. The authors of this paper have designed a dedicated software for monitoring the operation of the fuel supply system of a high-power Diesel engine. Acoustic emission signal of mediumrange frequency (1.2-10 kHz) generated in an accelerometer was used to identify the events accompanying to the combustion process. The recorded signal including lower frequency (1.21.5 kHz) and higher frequency (1.5-10 kHz) bursts of short duration, was projected in twodimensional plot where the horizontal axis represented time and the vertical one – frequency, the latter was for practical reasons displayed in hertz. The local level of signal intensity was
228
Ranachowski Z., Bejger A.
displayed in color scale and its real value was possible to determine using the auxiliary window presenting the digital readouts. To produce a time-frequency plot a continuous wavelet transform algorithm was applied. The algorithm realized a scalar product of the consecutive segments of
experimental data set
x (kt0) and the set of wavelet family
Ψ m n (t), where k is the natural number, t0 is the inverse of input data sampling frequency. The wavelet family was generated using the following formula : Ψ m n ( t ) = a0
−m/2
Ψ (a 0
−m
t − n b0 )
(1)
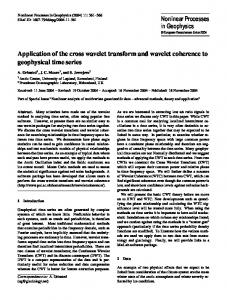
where Ψ(t) denotes a wavelet mother function of oscillating shape and of short duration. This function generates a family Ψ m n (t) covering the entire time – frequency domain; a0 is scale factor, b0 is translation factor, m, n are integer numbers. The input data sampling frequency was set to 88.2 kHz. To achieve possibly short translation factor, what resulted in a plot as its horizontal resolution of 1.25 millisecond – a simply wavelet mother function of a form Ψ(t) = eikt convoluted with a boxcar (square) time window was used. The tests of the software have revealed that the digital filters implemented as a wavelet family members operated with a selectivity factor of 5 . That selectivity was calculated as a ratio of a center frequency and the frequency bandwidth Δf. At both edges of the bandwidth Δf the passing signal amplitude was attenuated with a factor of 0.71. Figure 1. presents time – frequency representation of a 6 kHz sinusoid projected by the described software.
Fig. 1. Time – frequency representation of a 6 kHz sinusoid projected by the described software.
Molecular and Quantum Acoustics vol. 27, (2006)
229
2. EXPERIMENTAL The object of examination was 6 cylinder 3960 kW four stroke Wartsila Diesel engine operating at a constant speed of 600 revolutions per minute. Acoustic emission signals were recorded on the stub inlet to the injector and on the stub outlet of the fuel pump for all the six cylinders of the engine. According to Wartsila Engine Manual the following timing occurs for the normal operation of the fuel supply of the single cylinder (see Table 1.). The events are listed in Table 1. with the same identification numbers as it is presented in Figures 2A., 2B. and 3A. Table 1. Fuel supply process timing (events repeat every 200 ms at 600 R.P.M.) Event No. 1 2 3 4
Event description Closing of the exhaust valve Closing of the inlet valve Injection period of normal injector Opening of the exhaust valve
Timing 80 ms before injection 37 ms before injection Circa 6 ms at full power 33 ms after injection start
Figure 2A. present the time dependence of the effective value of acceleration of AE signal measured with the piezoelectric sensor (1mV denotes ca. 1 m/s-2 ) on the stub inlet to the injector of Diesel engine short after the maintenance, with the markers identifying the fuel supply system events. There is no pulse indicating opening the inlet valve probably due to low power generated during that event and because inlet valve was situated more remote to the sensor than the exhaust valve. Short after injection the combustion phase undergoes. Both events ( i.e. injection and combustion) have different spectral characteristics. That is clearly presented in wavelet decomposition (see Fig. 2B.)
230
Ranachowski Z., Bejger A.
Fig. 2a
Fig. 2b Figure 2A. Time dependence of the effective value of acceleration measured with the piezoelectric sensor on the stub inlet to the injector of Diesel engine short after the maintenance, with the markers identifying the fuel supply system events. Figure 2B presents wavelet decomposition of this signal. Figure 3 A. presents wavelet decomposition of AE signal measured on faulty injector with reduced discharge pressure. In that case AE event marked 3 lasts longer than at normal injector operation . Figure 3B illustrates wavelet decomposition of AE signal measured on the stub outlet of the fuel pump. AE pulses generated by the valves and the injector are attenuated while fuel delivery commencement 5 and operation of discharges valve 6 (both generated by the pump) are readable.
Molecular and Quantum Acoustics vol. 27, (2006)
231
Fig. 3a
Fig. 3b Figure 3 A. and 3 B. Description in the text above. REFERENCES 1. Rinkevich A.B. and Perov D.V., A Wavelet Analysis of Acoustic Fields and Signals in Ultrasonic Nondestructive Testing, Russ. J. of Nondestructive Testing, 41, (2005), 43-54. 2. Frances A.K., Gill J.D. et al., Investigation into identification of faults in a small HSDI Diesel engine using Acoustic Emission, DGfZP, BB 90-CD, Lecture 30, EWGAE, Berlin, 2004. 3. Leavey C. M., James N.M. et al., An introduction to wavelet transforms: a tutorial approach, Insight, 45, (2003), 344-353.