Session F4B
Automated Text Clustering System on Responses to Open-ended Questions in Course Evaluations Min Kang1, Kazuo Asakimori2, Akane Utsuki3, Makoto Kaburagi4 Abstract - The challenge of this work is to provide an automated analysis model on responses to open-ended questions for course evaluations. As the first step, an automated text clustering system is developed to code individual responses into several categories. The categories are titled by keywords used in the responses and frequencies related to categories are given. A natural language processing algorithm considering word synonymy is used to measure similarity between two responses and applied first to classify responses to openended questions. Morphological parsing is performed for each response and concept dictionaries are used to calculate similarity between two words involved in responses. The sample responses written in Japanese over the 2001-2004 academic years in the computer literacy course were classified by the system and it is clarified that students tend to focus their responses on two special topics. Excellent classification accuracy is obtained. Index Terms – Course Evaluations, Natural Language Processing,Open-ended Questions, Similarity, Text Clustering. INTRODUCTION Course evaluation by students is an important task in quality improvement process for higher education[1]. The most popular method to complete the task is periodically conducting surveys to measure achievement of course objectives, student outcomes and collect student opinions etc.. Generally, questionnaires for the surveys consist of two styles of questions. One is the style of multiple-choice questions and another is the style of open-ended questions. Lots of remarkable works[2]-[4] have been done to provide evaluation tools for helping educators easily create questionnaires and efficiently collect survey data. However, it is noted that there is rarely the part of automatically analyzing survey data in many evaluation tools. Although it is easy to get statistic results of structured data designed by evaluation tools with general statistic applications, responses to open-ended questions that illustrate students’ comments, opinions and feelings without bias due to limited response ranges in closeended format still require to be read individually because of unstructured feature. The way of manually analyzing a great number of open-ended responses is obviously difficult to quantitatively understand the entire picture of evaluations and
readily compare the results with those in close-ended format. Recently, some powerful text analysis applications have been developed for surveys with open-ended questions. They are only available for English text. The aim of this work is provide an automated analysis model on Japanese responses to open-ended questions in course evaluations. In the paper, we introduce a new text clustering method by applying the natural language processing algorithm[5] that is presented to measure imitation of documents. In the next section, the text clustering method is explained and an open-ended responses clustering analysis tool is described in Section III. The student responses to openended questions for the computer literacy course evaluation over the 2001-2004 academic years are categorized by the tool and the results are given in Section IV. TEXT CLUSTERING ALGORITHM Generally, a text clustering algorithm consists of two steps. In the first step, it is important to provide the method that appropriately measures the similarity between two documents. There have been lots of methods for measuring the similarity presented. The tf-idf measure method is popularly used to identify the similarity. However, Ref.[5], which proposed a new natural language processing algorithm with the purpose of identifying imitation documents, points out that the similarity between two documents are evaluated scantly by use of the method. A new method to measure the similarity that emphasizes word synonymy is suggested to improve the scantiness in Ref. [5]. Here, we apply the method in the first step for text clustering and briefly describe the procedure used in our system as follows. • Morphological parsing: Two Japanese documents X, Y are separated into morphemes by a morphological parser. Nouns, verbs and adjectives are extracted to form two term sets WX, WY. The union WXY of WX and WY is obtained. • Word synonymy: For each term pair (i, j) in the union set WXY, the word synonymy is measured by the distance between the two terms. The distance is defined as Rij=max(x,y) (
d xy × 2 d ix + d jy
) and calculated according to the
EDR Headconcept Dictionary and Concept Classification
1
Min Kang, Faculty of Cross-Cultural Studies, Kobe University, Kobe 657-8501, Japan,
[email protected] Kazuo Asakimori, Kobe Women's Junior College, Kobe 650-0046, Japan,
[email protected] 3 Akane Utsuki, Graduate School of Cultural Studies and Human Science, Kobe University, Kobe 657-8501, Japan,
[email protected] 4 Makoto Kaburagi, Faculty of Cross-Cultural Studies, Kobe University, Kobe 657-8501, Japan,
[email protected] 2
0-7803-9141-1/05/$20.00 © 2005 IEEE
July 7 – 9, 2005, Juan Dolio, Dominican Republic ITHET 6th Annual International Conference F4B-18
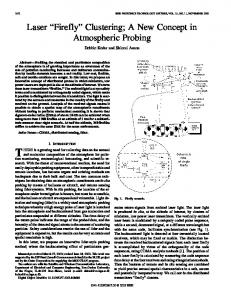
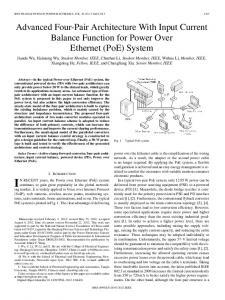
Session F4B Dictionary[6] that have hierarchical data structures, where x(y) corresponds to one of concepts of the word i(j) in the EDR Headconcept. dix(djy) denotes the depth of the concept from the Concept Classification dictionary root and dxy describes the depth of the common super-concept of the pair (x, y) from the root. Rij runs from 0 to 1 and two words are evaluated to be synonymous if Rij is larger than a threshold. By this way, we can obtain the set WXY*={c1,c2,…cn} where ci corresponds to a group of synonyms that are elements of the set WXY. • Document Vector: Based on the sets WX, WY and WXY*, the vectors fX, fY of document X and Y with n-dimensional space can be calculated. Each element of fX or fY equals to a term frequency related to each synonym group in the set WXY* . The vectors are normalized. • Similarity between document X and Y: The similarity is defined as the distance Dis(X,Y) between the vectors fX and fY, e.g. Dis(X,Y) = |fX-fY|. The second step of text clustering is coding documents into clusters. Quit generally, the hierarchical cluster analysis method is used at the step. In the process of clustering N documents, the document distances are calculated with above procedure for all document pairs so that the calculation generates an N*N distance matrix. OPEN-ENDED RESPONSE ANALYSIS TOOL The open-ended response analysis tool is developed by use of the Java programming language. A free morphological parser, ChaSen, is selected to separate responses into morphemes. In the cluster analysis, Ward’s method is used. Fig.1 shows the flow of the analysis tool and the main operation panel is presented in Fig.2. One can input responses by choosing an existing text file. “Create a new text” button in Step-1 provides a new window panel where responses can be typed or pasted in and saved as a text file. In Step-2, the separation mark between responses should be specified alternatively. One choice is the special character sequence “@@@” and another one is the carriage return sign. If there have been the special sequences existed in responses, the analysis results may be influenced. We suggest that a preprocessing for input responses is enough efficient to avoid the influence. The threshold which identifies word synonymy can be customized in Step-3 and the default value of the threshold is set to 0.85 following Ref.[5]. “Submit” button will start the processing flow. Before the cluster analysis procedure is performed, the system will require to input a classification number of clusters for result presentation. The number is related to the Rescaled Distance Cluster Combine in Dendrogram and can be chosen from 1 to the number of total input responses. When one inputs the number, a position in Dendrogram for result presentation is decided. Clustering results of responses corresponding the position in Dendrogram are shown in the result panel. Obviously, the larger the classification number is, the further to the right of Dendrogram the position is and the more dissimilar clusters are. Extremely, when the classification number is set to the number of total responses, 0-7803-9141-1/05/$20.00 © 2005 IEEE
Main operation panel: Data input and morphological parsing, Choosing nouns, verbs and adjectives
Retrieving the concept dictionaries and preparing concept paths to the root for calculation of the depths for each concept
Identifying the similarity between two responses
Calculating Rij to decide if two words (i,j) are synonymous
Hierarchical cluster analysis (Ward’s method)
Result panel: Showing response clustering results and summaries (keywords) of clusters FIGURE 1 FLOW OF TEXT CLUSTERING SYSTEM
FIGURE 2 MAIN OPERATION PANEL
all responses combine into one cluster. Inversely, there is only one response in each cluster when the number is equal to 1. The classification number can be manually chosen repeatedly until one gains an optimal result. Optimizing automatically the classification number will be considered in our future work. The result panel consists of three columns. The first column gives keywords to summarized each cluster’s subject. The keywords are picked up from the set of frequency ordered words used in responses of the cluster and only the words upper than some frequency-levels will be shown. There are four frequency-levels which are displayed by “one keyword”, ”two keywords”, “three keywords” and “four keywords”. For example, “one keyword” means only the
July 7 – 9, 2005, Juan Dolio, Dominican Republic ITHET 6th Annual International Conference F4B-19
Session F4B
FIGURE 3 A SAMPLE OF RESULT PANEL
words with the largest frequency are drawn in the column. The original responses are shown in the second column and the third column denotes the numbers of responses in clusters. A sample of clustering results is given in Fig.3. DATA ANALYSIS RESULTS The responses analyzed by the text clustering system are obtained in the computer literacy course evaluation over the 2001-2004 academic years.
system generally corresponds to one topic and the total number of input responses is not in agreement with the number of students. To investigate how the evaluations or students’ feelings vary by the divisions and by academic years, we combined the responses into eight groups according to the divisions and academic years which are called 2001G, 2001N, 2002G, 2002N, 2003G, 2003N, 2004G, 2004N. G(N) means the General(Nutrition) division. The group total responses of the eight groups are 203, 222, 168, 224, 199, 256, 222, 393 respectively. By inputting the responses of per group into the system, we obtained the analysis results by the system. Having trials several times, we empirically take the classification number around 10. The default threshold(0.85) for word synonymy is used. TABLE I RESPONSES CATEGORIZED AND CLASSIFICATION ACCURACIES 2001G CN: 7 2001N CN: 11 2002G CN:12
A 31(77%) 14(100%) 35(97%) 12(100%) 7(100%) 14(93%) 11(100%) 7(100%)
B 35(85%)
C 30(93%)
26(62%)
24(58%) 8(88%)
13(62%)
12(100%)
I. Course Evaluations The course is provided for eight freshman classes which are from two divisions, General Division and Nutrition Division, of Kobe Women's Junior College every academic year. The course topics mainly cover the basic personal computer operations, the usage of MS word-processor, the e-mail tool and the web tool, and the training of touch-typing. A selflearning environment is organized in the course. During lessons, students are required to read the material prepared for self-learning and complete exercises at computer rooms at their own paces. Instructors support individually students at the lessons[7]. Evaluations are performed in the end of spring term. The questionnaire includes 20 multi-choice questions and one open-ended question that ask students to give evaluations, opinions on the course and feelings during lessons. Until now, the students’ responses to the multi-choice questions are analyzed systematically by use of statistical analysis tools every academic year. However, quantitative analysis for the responses to the open-ended question was not be done because of the lack of analysis tools. II. Results By observing qualitatively the data over academic years 2001-2004, we noted that students tend to express their opinions or feelings on the topics by independent sentences, e.g. they divide expressions on different topics with period symbols. Because the analysis aims to gather the students’ feedbacks on each topic of the course, we preprocessed the student responses and divided each student’s responses into independent sentences. Therefore, each response used to the 0-7803-9141-1/05/$20.00 © 2005 IEEE
2002N CN:10
37(97%) 17(82%) 15(93%)
2003G CN:13
32(65%) 18(100%) 17(100%)
24(88%)
2003N CN:10
34(100%) 18(94%) 15(87%)
36(72%)
2004G CN:16
30(77%) 17(100%) 14(100%) 14(93%) 10(100%) 58(95%) 27(93%)
5(100%)
14(93%) 11(82%)
24(92%)
50(92) 33(67%)
2004N CN:12
25(84%)
22(82%)
D 50(74%) 12(92%) 20(95%) 14(86) 12(100%) 16(100%) 13(62%) 10(100%) 7(100%) 4(100%) 27(93%) 16(100%) 16(100%) 9(100%) 22(55%) 11(100%) 10(100%) 9(100%) 8(100%) 6(100%) 36(100%) 35(97%) 22(91%) 13(92%) 31(65%) 19(95%) 11(100%) 7(100%) 40(100%) 13(92%)
E
F 31
16(88%)
48 37 24
31(71%)
31
13(85%) 7(100%)
23(65%)
24
24(92%) 5(100%) 2(100%)
8
27(96%) 8(100%) 6(100%)
88 19
The categorized results are shown in Table I. The names of student groups are described in the first column where CN means the number of clusters which are automatically decided by the system. Responses of 2001G student group are classified into seven(CN:7) clusters. The results for the other groups can be found in the same column. Each item in Column A-Column F corresponds to a cluster and the integer in the item expresses the number of responses categorized in the cluster. For example, the integer “31” in Column A of 2001G student group means that there are 31 responses which are automatically classified into the cluster by the system. The
July 7 – 9, 2005, Juan Dolio, Dominican Republic ITHET 6th Annual International Conference F4B-20
Session F4B
0-7803-9141-1/05/$20.00 © 2005 IEEE
ratios of avaiable responses
40% 35% 30%
2001G 2002G 2003G 2004G
25% 20% 15% 10% 5% 0% C ategory A C ategory B C ategory C C ategory D C ategory E T opics
FIGURE 4 RESPONSE RATIOS OF GENERAL DIVISION
45% ratios of avaiable responses
percentage values in parentheses show classification accuracies. An accuracy is defined as a ratio of responses (we call available responses) which are manually read and distinguished to attribute a focused topic to cluster total responses in a cluster. If half of responses in a cluster are manually identified not to correspond to a focused topic, the cluster is called undefined. Furthermore, we noted that the clusters classified by the system could be combined into six categories which are related to upper topics in comparison with clusters’ topics. Consequently, the clusters could be briefly summarized into six topics in Table I. Column A-F denote the six categories and the corresponding topics are shown in the following. • Category A: represents the topic on touch-typing. Many students express what level they have reached, how they get exercises to achieve the training purpose, what exercise they feel difficult during lessons. • Category B: illustrates course evaluations. The responses express if students feel the course topics being useful for their future occupations, if they have learned more knowledge through the course than before and how they feel about the self-learning environment et cetera. • Category C: is about computers. It draws if students had experiences on computers before they attend the lectures, what basic knowledge on computers they have understood etc.. • Category D: sketches basic computer operations and usages of the applications students learned, the change in the way of thinking about the operations, personal learning outcomes on skills they felt. • Category E: show the other topics except those described in Category A-D. For example, expression of gratitude is included in this category. • Category F: includes all undefined clusters. As shown in Table I, the clusters concentrate in Category A and Category D for each student group. The result means there are lots of responses corresponding to Category A and Category D in comparison with the other categories. We calculated the ratios of group available responses to group total responses for the eight groups and show the results in Fig.4 and Fig.5. Response distribution concerning topics for students of General Division is shown in Fig.4. In comparison with opinions to the course and basic knowledge on computers, students display their interests more in skills about touchtyping and computer applications. Concerning Category D, the response ratio varies rarely with academic years. On the other hand, increasing of the response ratio with years in Category A seems to mean that interests in touch-typing are increasing. The interests in touch-typing are the same for most of students in Nutrition Division(Fig.5). Being different with that in General Division, there is a large dispersion of ratios in Category D following academic years. Calculation results show that there is no ratio over 15% in Category B and Category C for all groups. The result indicates that for obtaining course evaluation results from students more detailed, we need to change the way of asking students in the
40% 35% 2001N 2002N 2003N 2004N
30% 25% 20% 15% 10% 5% 0% C ategory A C ategory B C ategory C C ategory D C ategory E topics
FIGURE 5 RESPONSE RATIOS OF NUTRITION DIVISION
open-ended question or increase the open-ended questions with some restrictions. III. Classification Accuracy As can be seen in Table I, there are excellent classification accuracies obtained by the use of the natural language processing algorithm explained in Section II. Only considering available responses, we gained that the percentages of responses that are correctly classified into 2001G, 2001N, 2002G, 2002N, 2003G, 2003N, 2004G, 2004N are 71, 66, 57, 77, 85, 81, 85, 67 respectively. It is possible to raise the classification accuracies by searching optimal classification numbers for the eight groups. In this paper, the optimal procedure was done manually. Another important factor that effects classification accuracy is dictionary accuracy. There are two kinds of dictionary used in the system. The dictionary accuracy in the morphological parsing is near to 99%. Because the dictionary is constructed according to the database of words that appear frequently in the press so that some words in the responses of the course evaluation may be undefined in the dictionary. In the case, the system will ignore the words. As a solution, it will be efficient to append the undefined words into the dictionary. The result is the same for the concept dictionaries used.
July 7 – 9, 2005, Juan Dolio, Dominican Republic ITHET 6th Annual International Conference F4B-21
Session F4B REFERENCES
CONCLUSION In this paper, we developed an automated text clustering system to analyze responses over four academic years to openended questions in computer literacy course evaluation. The natural language processing that is provided to evaluate imitation between two documents is first introduced to classify responses to open-ended questions. Excellent classification accuracy for the evaluation data is obtained. According to the quantitatively analyzing results, it is clarified that students tend to focus their responses on two special topics, e.g. touchtyping and practical skills of computer operations. The problems, how to automatically decide the optimal accuracies and how to gain more information on course evaluations, remain. We will challenge the problems in the near future.
ACKNOWLEDGMENT The research was supported by Grand-in-Aid for Projects of Faculty of Cross-Cultural Studies, Kobe University and was supported in part by Grant-in-Aid for Scientific Research of JSPS No.17500640.
0-7803-9141-1/05/$20.00 © 2005 IEEE
[1]
Kevin Scoles,Nihat Bilgutay and Jerene Good, "A New Course Evaluation Process", IEEE Trans. Educ., Vol 43, No.2, 2000, pp125.
[2]
G.Bengu and William Swart, "A Computer-Aided, Total Quality Approach to Manufacturing Education in Engineering", IEEE Trans. Educ., Vol 39, No.3, 1996, pp415.
[3]
Jennifer Turns,Cynthia J.Atman and Robin Adams, "Concept Maps for Engineering Education:A Cognitively Motivated Tool Supporting Varied Assessment Functions", IEEE Trans. Educ., Vol 43, No.2, 2000, pp164.
[4]
Angelo Tartaglia and Elena Tresso, "An Automatic Evaluation System for Technical Education at the University Level", IEEE Trans. Educ., Vol 45, No.3, 2002, pp268.
[5]
Ryo FUKAYA, Tsuyoshi YAMAMURA, Hiroaki KUDO, Tetsuya MATSUMOTO, Yoshinori TAKEUCHI and Noboru OHNISHI, " Measuring Similarity between Documents Using Term Frequency", the IEICE Transactions (Japanese Edition) D-II, Vol J87-D-II, No.2, 2004, pp661.
[6]
National Institute of Information and Communications Technology, " The Concept Dictionary", http://www2.nict.go.jp/kk/e416/EDR/index.html
[7]
Kazuo Asakimori, Akihiro Okuyama, Yukako Matsui, Mayumi Tanaka, Mayumi Hirata and Min Kang, "Computer Literacy Education Using Self-Learning Environment", the Fifth International Conference on Information Technology Based Higher Education and Training, 2004, pp1.
July 7 – 9, 2005, Juan Dolio, Dominican Republic ITHET 6th Annual International Conference F4B-22