arne.grumpe | christian.woehler}@tu-dortmund.de. Introduction: In this study we present a classifi- cation system which enables the automatic recogni-.
45th Lunar and Planetary Science Conference (2014)
2842.pdf
AUTOMATIC CRATER RECOGNITION USING MACHINE LEARNING WITH DIFFERENT FEATURES AND THEIR COMBINATION. A. Boukercha1 , A. Al-Tameemi1, A. Grumpe1 and C. Wöhler1; 1 Image Analysis Group, TU Dortmund University, D-44227 Dortmund, Germany; {anis.boukercha | atheer.altemimi | arne.grumpe | christian.woehler}@tu-dortmund.de.
Introduction: In this study we present a classification system which enables the automatic recognition of lunar craters based on different modalities. The method consists of two subsequent stages, a detection stage provides possible candidates and is followed by the classification stage which reduces false positive recognitions. For geologists, the number of craters of a certain area in the moon is important in various applications, e.g. surface age estimation or determination of geologic units. The number of lunar craters is nowadays mainly determined manually or by single-stage crater classifaction algorithms. The manual detection and size determination of the lunar craters requires much effort, and the results differ from one researcher to another. Current automatic crater detection algorithms rely on optical image or digital elevation maps (DEM). based maps. They typically rely on geometric or morphometric properties of the craters and use a singlestage classification scheme [1]. In machine learning, however, it has been shown beneficial to use a two stage classification. While the first stage detects lots of candidates and produces lots of false positives, a second classification stage is trained to remove the false detections from the candidates [2]. Additionally, the method proposed in this study is going to use other modalities such as spectral and photometric parameters in addition to the optical image and DEM [3, 4, 5]. Methodology: We apply the crater dection algorithm in [4] as detection stage. For a given image, a photoclinometry-based DEM reconstruction refines the existing DEM and a fuzzy edge detection and a fuzzy radon-hough based detector produces candidates. Additionally, the morphometric analysis of [1] produces a probability estimate of being a crater. This information is not included in the classification stage yet but will be added in future versions. The detected candidates are then forwarded to a classifier.In this paper, type of the second stage classifier may be one of the types presented in this study, namely polynomial classifier (1st and 2nd degree) [6], but is not limited to these choices and may range from support vector machines to complex ensembles of classifiers [7]. We test our algorithm on the Moon Mineralogy Mapper (M³) [8] image M3G20090205T193313
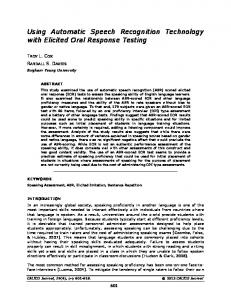
which covers the region 2.4° W – 1.7° W / -44.2° S – 4.2° S. We consider LU78287GT by [4] to be the ground truth catalogue for this region. It is denoted region 2 in [4]. According to LU78287GT, a candidates is labeled as a crater if it is less than three pixels away from the center given in the catalogue. Fig. 1 shows all candidates mapped onto the input data. The craters and non-craters from the candidate set are separated into disjoint subsets and a 10-fold crossvalidation [9] is applied.
Figure 1: Crater candidates provided by the detector in [4]. False positives are given in red color, crater candidates that are closer than n pixels to the GT catalogue are given in green color and candidates which exactly correspond to craters from the GT catalogue are given in yellow color.
The classification features are extracted as follows: 1. The candidate is located on each input map. 2. A quadratic region covering 3 times the diameter of the crater is cut from each map. 3. The regions are resampled to a uniform size of 16 by 16 pixels. 4. The pixels of the resampled regions are transformed to a vector and the zero-mean unitvariance normalization procedure is applied. 5. A principal component analysis [6] is trained on the regions of all candidates in the training set and applied to all candidates for each input map, respectively. 6. The principal components of all input maps are concatenated. Possible input maps are the DEM, the optical image, the single-scattering albedo of the Hapke model [10] or the spectral parameters defined in [11]. Additionally, a synthetic image is produced rendering the DEM
45th Lunar and Planetary Science Conference (2014)
using the single-scattering albedo and the illumination conditions of the real optical image. Results and Discussion: To compare the results of the different chosen features, a mean accuracy has been determined for the classification system in terms of the receiver operation characteristics (ROC) curve based on 10-fold cross-validation. The ROC curve denotes the true positive vs. false positive rate of the classifier. The ROC curves shown in Fig. 2 illustrate the benefit of our new method. We chose several ROC curves of different features and feature combinations. The best results were obtained using the DEM combined with a synthetic image rendered based on the DEM under the assumption of a constant albedo. Figure 2 shows the results obtained through the implementation of a linear and a quadratic polynomial classifier. It provides a comparison between the crater detection stage in [4] and five further different single or combined feature sets. The results of all two-stage systems are better than the detector in [4]. Furthermore, Fig. 2 shows that the performance of the quadratic polynomial classifier surpasses that of the linear polynomial classifier. Conclusion: We have shown that the performance of an automatic crater recognition system can be increased by a two-stage approach, consisting of a de-
2842.pdf
tection stage followed by a classification stage relying on the DEM combined with a synthetic image rendered based on the DEM under the assumption of a constant albedo. References: [1] Salamuniccar, G. (2010) IEEE Transactions on Geoscience and Remote Sensing, 48(5), 2317-2329; [2] Enzweiler, M. and Gavrila, D. (2009) IEEE TPAMI 31(12), 2179-2195; [3] Salamunićcar, G. et al. (2010) Proc. IEEE Int. Symp. on Image and Signal Processing and Analysis, 597-602; [4] Salamuniccar, G. et al. (2013) Adv. Space Research, in press; [5] Grumpe, A., Wöhler, C. (2011) Proc. IEEE Int. Symp. on Image and Signal Processing and Analysis, 609-614; [6] Schürmann, J. (1996) “Pattern Classification”, John Wiley & Sons; [7] Bishop, C. (2006) “Pattern Recognition and Machine Learning”, Springer-Verlag; [8] Pieters, C. M. et al. (2009) Current Science 96(4), 500-505; [9] Marsland, S. (2009) “Machine Learning”, CRC Press; [10] Hapke, B. (2002) Icarus 157 (2), 523534; [11] Wöhler, C. and Grumpe, A. (2013) In: M. Breuß et al. (eds.), Innovations for Shape Analysis: Models and Algorithms, Springer-Verlag, 467-492.
Figure 2: Results obtained with the quadratic (top) and linear (bottom) polynomial classifier.