Shriram K V et. al. / International Journal of Engineering Science and Technology Vol. 2 (7), 2010, 2632-2644
AUTOMOTIVE IMAGE PROCESSING TECHNIQUE USING CANNY’S EDGE DETECTOR Shriram K. Vasudevan, Assistant Professor VIT UNIVERSITY/Embedded Systems, Vellore, India
[email protected] Dharmendra T, student, M.Tech Automotive Electronics, VIT University, Vellore, India.
[email protected] Sivaraman R, Student, M.Tech S S T, VIT University, Vellore, India.
[email protected] Karthick S, student, M.Tech Automotive Electronics, VIT University, Vellore, India.
[email protected] Abstract - Edge detection from images is one of the most important concerns in digital image and video processing. With development in technology, edge detection has been greatly benefited and new avenues for research opened up, one such field being the real time video and image processing whose applications have allowed other digital image and video processing. It consists of the implementation of various image processing algorithms like edge detection using Sobels, Prewitt, Canny and Laplacian and so on. A different technique is reported to increase the performance of the edge detection. The algorithmic computations in real-time may have high level of time based complexity and Image processing system for the implementation Canny’s edge detector is proposed here. It is observed that techniques which follow the stage process of detection of noise and filtering of noisy pixels achieve better performance than others. Keywords: Image Processing, Edge Detection, Canny Edge Detector
1. Introduction Edge detection is a problem of fundamental importance in image analysis. In typical images, edges characterize object boundaries and are therefore useful for segmentation, registration, and identification of objects in a scene. Edge detection of an image reduces significantly the amount of data and filters out information that may be regarded as less relevant, preserving the important structural properties of an image. A theory of edge detection is presented. The analysis proceeds in two parts:
Intensity changes, which occur in a natural image over a wide range of scales, are detected separately at different scales. An appropriate filter for this purpose at a given scale is found to be the second derivative of a Gaussian. Intensity changes at a given scale are best detected by finding the zero values of image. The intensity changes discovered in each of the channels are represented by oriented primitives called zero-crossing segments.
Intensity changes in images arise from surface discontinuities or from reflectance or illumination boundaries and these all have the property that they are spatially localized. Because of this, the zerocrossing segments from the different channels are not independent, and rules are deduced for combining them into a description of the image. This description is called the raw primal sketch.
ISSN: 0975-5462
2632
Shriram K V et. al. / International Journal of Engineering Science and Technology Vol. 2 (7), 2010, 2632-2644 The work of Canny shows that the ideal operator that maximizes the conventional signal-to-noise ratio in detecting a particular edge is correlation with the same edge model itself. However, this detection is not well localized and requires an additional localization criterion. Canny’s edge detector for step edges is well approximated by the derivative of Gaussian mask. In contrast, our edge detector formulation is based on the fact that SNR implicitly defines all the desired properties of good detection and localization and thus given an edge model, the optimal SNR filter for this model also results in a good edge detector. 2. Edge Detection – Fundamentals Edge detection refers to the process of identifying and locating sharp discontinuities in an image. The discontinuities are abrupt changes in pixel intensity which characterize boundaries of objects in a scene. Classical methods of edge detection involve convolving the image with an operator, which is constructed to be sensitive to large gradients in the image while returning values of zero in uniform regions. This is an extremely large number of edge detection operators available, each designed to be sensitive to certain types of edges. Variables involved in the selection of an edge detection operator are:
Edge Detection: The geometry of the operator determines a characteristic direction in which it is most sensitive to edges. Operators can be optimized to look for horizontal, vertical, or diagonal edges. Noise level in environment: Edge detection is difficult in noisy images, since both the noise and the edges contain high-frequency content. Attempts to reduce the noise result in blurred and distorted edges. Operators used on noisy images are typically larger in scope, so they can average enough data to discount localized noisy pixels. This results in less accurate localization of the detected edges. Edge Structure: Effects such as refraction or poor focus can result in objects with boundaries defined by a gradual change in intensity. The operator needs to be chosen to be responsive to such a gradual change in those cases. Newer wavelet-based techniques actually characterize the nature of the transition for each edge in order to distinguish, for example, edges associated with hair are different from edges associated with a face.
There are many ways to perform edge detection. However, the majority of different methods may be grouped into two categories: Gradient: The gradient method detects the edges by looking for the maximum and minimum in the first derivative of the image. Laplacian: The Laplacian method searches for zero crossings in the second derivative of the image to find edges. An edge has the one-dimensional shape of a ramp and calculating the derivative of the image can highlight its location. Suppose we apply the following signal, with an edge shown by the jump in intensity as in fig 1.
Fig 1 – Signal applied to edge detector.
The gradient obtained from the signal applied to the edge detector will be as in fig 2.
ISSN: 0975-5462
2633
Shriram K V et. al. / International Journal of Engineering Science and Technology Vol. 2 (7), 2010, 2632-2644
Fig 2 – Gradient first derivative of the applied signal.
This method of locating an edge is characteristic of the “gradient filter” family of edge detection filters as prescribed by the Sobels method. A pixel location is declared an edge location if the value of the gradient exceeds some threshold. As seen from the fig 2, edges will have higher pixel intensity values than those surrounding it. When a threshold is set, we can compare the gradient value to the threshold value and detect an edge whenever the threshold is exceeded. Further, when the first derivative is at a maximum, the second derivative will be zero, proving another alternative to find the location of an edge by locating the zeros in the second derivative. This method is known as the Laplacian and the second derivative of the signal is as seen in fig 3.
Fig 3 – Gradient second derivative of the applied signal.
The purpose of detecting sharp changes in image brightness is to capture important events and changes in properties of the world. It can be shown that under rather general assumptions for an image formation model, discontinuities in image brightness correspond to: Discontinuities in depth, Discontinuities in surface orientation, Changes in material properties and Variations in scene illumination. In the ideal case, the result of applying an edge detector to an image may lead to a set of connected curves that indicate the boundaries of objects, the boundaries of surface markings as well curves that correspond to discontinuities in surface orientation. Thus, applying an edge detector to an image may significantly reduce the amount of data to be processed and may therefore filter out information that may be regarded as less relevant, while preserving the important structural properties of an image. However it is not always possible to recover the ideal edges from real life images of even moderate complexity. Since edges extracted from non-trivial images are often hampered by fragmentation, meaning that the edge curves are not connected, missing edge segments as well as false edges may not correspond to interesting phenomena in the image - thus complicating the subsequent task of interpreting the image data. The edges from real life images are normally affected by one or several of the following effects: Focal blur caused by a finite depth-of-field and finite point spread function.
ISSN: 0975-5462
2634
Shriram K V et. al. / International Journal of Engineering Science and Technology Vol. 2 (7), 2010, 2632-2644
Penumbral blur caused by shadows created by light sources of non-zero radius. Shading at a smooth object edge. Local speculations or inter-reflections in the vicinity of object edges.
3. Detection of Edges in 1-Dimension Single dimension edge detection has the following key steps: 3.1 Reduction of noise effects. 3.2 Measurement of magnitude change in the region. 3.3 Discovery of peak changes Non-maximum suppression. Threshold. We hope to find the peaks, because in the neighbourhood of an edge, after smoothing (reduction of noise effects), there may be many pixels where the image is changing rapidly, but we merely want to identify one of them as the edge. Discrete convolution is performed by sampling the filter with two most important parameters: Normalize the sampled Gaussian, so that it sums to ‘1’. Wide filter utilization for capturing the Gaussian shape. (Heuristic filter modelling) Canny has found that the optimal smoothing function for finding edges of a noisy step edge is approximately a Gaussian. Canny defined optimality by defining some reasonable criteria, such as accurate localization and lack of false positives. Hence it is particularly important to reduce the effects of noise before taking a derivative. One way to justify this is to note that white noise has a uniform power spectrum, while scene structure is usually more low frequency than high frequency. A derivative is a high-pass filter. So the derivative preserves the noise much more than the structure. The way to avoid this is to low-pass filter the image first, which removes noise much more than it removes structure. In 1D, it is easy to measure the amount of change. The way that we measure change is by taking a derivative. Firstly, look for points where the magnitude of the derivative is bigger than at the two neighbouring points. This is called non-maximum suppression and is equivalent to finding the place where the first derivative is a maximum. Secondly, look for peaks where the magnitude of the first derivative is above some threshold. This eliminates spurious edges. 4. Detection of Edges in 2-Dimensions Dual dimension edge detection follows up the same steps as single dimension except for a few mutations: 4.1 Reduction of noise effects: This is similar to the single dimension, utilizing the Gaussian but in 2D. Decomposing 2D Gaussian into two 1D Gaussian improves the efficiency.
4.2 Measurement of magnitude change in the region: In 1D, measurement of change with derivative is needed, unlike in 2D where change with gradient is needed. We can derive it with the help of partial derivatives in x and y directions. The direction of the gradient provides the direction of maximum change. The magnitude of the gradient tells us how fast the image is changing if we move in that direction. 5
Discovery of peak changes 5.1 Non-maximum suppression: We do not just want to look at local maxima. When considering a simple case of a white square on a black background, the gradient magnitude will be constant along the edge, and will be decreasing in the direction orthogonal to the edge. So it is necessary to look for points that
ISSN: 0975-5462
2635
Shriram K V et. al. / International Journal of Engineering Science and Technology Vol. 2 (7), 2010, 2632-2644 are maxima in the direction of the gradient. We must interpolate when the gradient does not point directly to a pixel. 5.2 Threshold: A high threshold: All maxima with gradient magnitudes above that are edges. A low threshold: All maxima above this are edges if they are also connected to an edge. Note that this is a recursive definition. 6. Edge Detection Phases 6.1 Smoothing: suppress as much noise as possible, without destroying the true edges. 6.2 Enhancement: apply a filter to enhance the quality of the edges in the image. 6.3 Detection: determine which edge pixels should be discarded as noise and which should be retained. 6.4 Localization: determine the exact location of an edge. Edge thinning and linking are usually required in this step. 7. Edge Detection Using Derivatives Calculus describes changes of continuous functions using derivatives. An image is a 2D function, so operators describing edges are expressed using partial derivatives. Points which lie on an edge can be detected by: Detecting local maxima or minima of the first derivative. Detecting the zero-crossing of the second derivative. To compute the derivative of a signal, we approximate the derivative by finite differences: Computing the 1st derivative:
Fig 4 - Edge Detection Using Derivatives
8. Edge Detection Techniques Edge detection aims at identifying points in a digital image at which the image brightness changes sharply or more formally has discontinuities. Following edge detectors are handy:
ISSN: 0975-5462
2636
Shriram K V et. al. / International Journal of Engineering Science and Technology Vol. 2 (7), 2010, 2632-2644
Sobels Edge Detector - 3×3 gradient edge detector. Prewitt Edge Detector - 3×3 gradient edge detector. Canny Edge Detector - non-maximal suppression of local gradient magnitude. Zero Crossing Detector - edge detector using the Laplacian of Gaussian operator.
9. Overview of Canny’s Edge Detector Canny’s Edge Detector has lofty pros such as: Utilization of probability for finding the error rates better localization and response improved signal to noise ratio better detection specially in noise conditions makes it the eminent Edge Detector for automotive applications. Edges characterize boundaries and are therefore a problem of fundamental importance in image processing. Edges in images are areas with strong intensity contrasts – a jump in intensity from one pixel to the next.
The first and most obvious is low error rate. It is important that edges occurring in images should not be missed and that there be NO responses to non-edges. The second criterion is that the edge points be well localized. In other words, the distance between the edge pixels as found by the detector and the actual edge is to be at a minimum. A third criterion is to have only one response to a single edge.
This was implemented because the first 2 were not substantial enough to completely eliminate the possibility of multiple responses to an edge. Based on these criteria, the canny edge detector first smoothes the image to eliminate and noise. It then finds the image gradient to highlight regions with high spatial derivatives. The algorithm then tracks along these regions and suppresses any pixel that is not at the maximum. The gradient array is now further reduced by hysteresis. Hysteresis is used to track along the remaining pixels that have not been suppressed. Hysteresis uses two thresholds and if the magnitude is below the first threshold, it is set to zero. If the magnitude is above the high threshold, it is made an edge. And if the magnitude is between the 2 thresholds, then it is set to zero unless there is a path from this pixel to a pixel with a gradient above T2. 10. Phases of Implementation 10.1 Phase A The first step of implementation is to filter out any noise in the original image before trying to locate and detect any edges. As the Gaussian filter can be computed using a simple mask, it is used exclusively in the Canny algorithm. Once a suitable mask has been calculated, the Gaussian smoothing can be performed using standard convolution methods. A convolution mask is usually much smaller than the actual image. As a result, the mask is slid over the image, manipulating a square of pixels at a time. The larger the width of the Gaussian mask, the lower is the detector's sensitivity to noise. The localization error in the detected edges also increases slightly as the Gaussian width is increased. For example we take the Gaussian function with σ = 1.4 as in fig 5.
ISSN: 0975-5462
2637
Shriram K V et. al. / International Journal of Engineering Science and Technology Vol. 2 (7), 2010, 2632-2644
Fig 5 – Discrete approximation of Gaussian function with σ = 1.4
10.2 Phase B After smoothing the image and eliminating the noise, the next step is to find the edge strength by taking the gradient of the image. The Sobel operator performs a 2-D spatial gradient measurement on an image. Then, the approximate absolute gradient magnitude at each point can be found. The Sobel operator uses a pair of 3x3 convolution masks, one estimating the gradient in the x-direction and the other estimating the gradient in the ydirection. They are depicted in fig 6.
Fig 6 – Sobel operator using 3x3 convolution masks
The magnitude or the edge strength is calculated by using the formula:
10.3 Phase C Finding the edge direction is trivial once the gradient in the x and y directions are known. However, the system will generate an error whenever sum X is equal to zero. So in the code there has to be a restriction set whenever this takes place. Whenever the gradient in the x direction is equal to zero, the edge direction has to be equal to 90 degrees or 0 degrees, depending on what the value of the gradient in the y-direction is equal to. If ‘Gy’ has a value of zero, the edge direction will equal 0 degrees. Otherwise the edge direction will equal 90 degrees. The formula for finding the edge direction is
10.4 Phase D Once the edge direction is known, the next step is to relate the edge direction to a direction that can be traced in an image. The pixels of a 5x5 image are aligned as follows
ISSN: 0975-5462
2638
Shriram K V et. al. / International Journal of Engineering Science and Technology Vol. 2 (7), 2010, 2632-2644
Fig 7 – Arrangement of 5x5 pixel image
Then, it can be seen by looking at pixel "a", there are only four possible directions when describing the surrounding pixels - 0 degrees (in the horizontal direction), 45 degrees (along the positive diagonal), 90 degrees (in the vertical direction), or 135 degrees (along the negative diagonal). So now the edge orientation has to be resolved into one of these four directions depending on which direction it is closest to. Think of this as taking a semicircle and dividing it into 5 regions. 10.5 Phase E After the edge directions are known, non-maximum suppression now has to be applied. Non-maximum suppression is used to trace along the edge in the edge direction and suppress any pixel value that is not considered to be an edge. This will give a thin line in the output image. 10.6 Phase F Finally, hysteresis is used as a means of eliminating streaking. Streaking is the breaking up of an edge contour caused by the operator output fluctuating above and below the threshold. If a single threshold, T1 is applied to an image, and an edge has an average strength equal to T1, then due to noise, there will be instances where the edge dips below the threshold. Equally it will also extend above the threshold making an edge look like a dashed line. To avoid this, hysteresis uses 2 thresholds, a high and a low. Any pixel in the image that has a value greater than T1 is presumed to be an edge pixel, and is marked as such immediately. Then, any pixels that are connected to this edge pixel and that have a value greater than T2 are also selected as edge pixels. If you think of following an edge, you need a gradient of T2 to start but you don't stop till you hit a gradient below T1. 11. Canny’s Multi-Step Edge Detection Algorithm
(1) Smooth the image with a Gaussian filter to reduce noise and unwanted details and textures
where,
Compute gradient of g (m, n) using any of the gradient operators (Sobels, Prewitt, etc) to get
ISSN: 0975-5462
2639
Shriram K V et. al. / International Journal of Engineering Science and Technology Vol. 2 (7), 2010, 2632-2644
and
(2) Threshold (3) Suppress non-maxima pixels in the edges in MT obtained above to thin the edge ridges. Check to see whether each non-zero MT (m, n) is greater than its two neighbours along the gradient direction θ (m, n). If so, keep MT (m, n) unchanged, otherwise, set it to 0.
(4) Threshold the previous result by two different thresholds T1 and T2 to obtain two binary images T1 and T2. Note that compared to T1, T2 has less noise and fewer false edges but larger gaps between edge segments.
(5) Link edges segments in T2 to form continuous edges. To do so, trace each segment in T2 to its end and then search its neighbours in T1 to find any edge segment in T1 to bridge the gap until reaching another edge segment in T2. 11.1. Results Obtained From Canny’s Edge Detector
Fig 8 – Original real life image of a SUV
ISSN: 0975-5462
2640
Shriram K V et. al. / International Journal of Engineering Science and Technology Vol. 2 (7), 2010, 2632-2644
Fig 9 – Image after processing with Canny’s operator
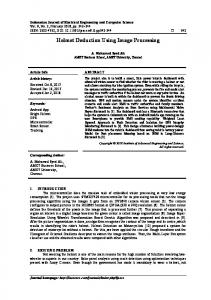
12. Implementation Segment In Automotives We demonstrate an obstacle detection system using three cameras mounted on a vehicle. The three onboard cameras were positioned to observe the front, the right rear side, and the left rear side of the vehicle three image sequences captured by the three cameras were inputted into the image processing board via the three video input channels. Obstacles in each image sequence were detected based on our obstacle detection using image processor. Our obstacle detection method is capable of detecting obstacles using a single camera and is robust in the face of various real road scene conditions. For the purposes of demonstration, the obstacle detection results were superimposed on original image sequences. A long red horizontal line indicates the border line between the detected obstacle and the road. The distance between the observer and the obstacle was estimated based on the detected position of the border line, and our system displays the top view of the obstacle positions around the observer. Our system is capable of detecting various types of vehicles in various scenes with poor lighting conditions and with disturbances such as raindrops or wipers on the windshield that indicate the results of the preceding vehicle detection in various scenes.
ISSN: 0975-5462
2641
Shriram K V et. al. / International Journal of Engineering Science and Technology Vol. 2 (7), 2010, 2632-2644
Fig 10 – Implementation model in automotives
Assuming that the road is a plane and that an obstacle is approximated by a front-parallel plane perpendicular to the road plane, we derive the motion constraint of each plane from the projective invariant combined with the vanishing line of the plane that is a prior knowledge of road scenes. The system detects obstacles based on the motion constraints as follows: (1) Extract horizontal line segments, assuming that they exist on the obstacles. (2) Track them in an image sequence for observing their motions, (3) Test whether the motion of a set of three horizontal line segments satisfies the motion constraint of the road plane or that of the surface plane of the obstacles, and (4) Detect the obstacle as a set of horizontal line segments satisfying the motion constraint of the surface plane of the obstacles. 13. Design Summary of Canny’s Edge Detector The canny edge detector is capable of reducing noise. The canny operator works in a multistage process. These can be summarized in a smoothing with Gaussian filter. It is followed by gradient computation and use of a double threshold. The canny produces the best edge map. The result is show that the behaviour of zero crossing operator and gradient operator on the capability of edge detection. The objective is to investigate the effectiveness of the Canny’s Edge Detector mechanism applied in finding edges of the image. It can trounce clearly Sobel and Prewitt low quality edges. Among the various methods investigate the canny method is able to detect both strong and weak edges and seems to be more suitable than the Laplacian of Gaussian. As edge detection is a fundamental step, it is necessary to point out the true edges to get the best results from the matching process. 14. Conclusion and Future Scope Edge detection is an important pre-processing step in image analysis. Edge detection is an important work for object recognition and is also an essential pre-processing step in image segmentation. These edge detection operators can have better edge effect under the circumstances of obvious edge and low noise. There are various edge detection methods in the domain of image edge detection, each having its own advantages. The performance of proposed edge detector can be improved by applying different filtering technique throughout the image in recursive way. There is sufficient scope for developing image and video processing in the direction of mentioned below:
ISSN: 0975-5462
2642
Shriram K V et. al. / International Journal of Engineering Science and Technology Vol. 2 (7), 2010, 2632-2644 (1) In computer vision and image processing the concept of feature detection refers to methods that aim at computing abstractions of image information and making local decisions at every image point whether there is an image feature of a given type at that point or not. The resulting features will be subsets of the image domain, often in the form of isolated points, continuous curves or connected regions. Since features are used as the starting point and main primitives for subsequent algorithms, the overall algorithm will often only be as good as its feature detector. Consequently, the desirable property for a feature detector is repeatability: whether or not the same feature will be detected in two or more different images of the same scene. (2) Video compression refers to reducing the quantity of data used to represent digital video images, and is a combination of spatial image compression and temporal motion compensation. Video compression is an example of the concept of source coding in Information theory. This article deals with its applications: compressed video can effectively reduce the bandwidth required to transmit video via terrestrial broadcast, via cable TV, or via satellite TV services. (3) In image segmentation refers to the process of partitioning a digital image into multiple segments. The goal of segmentation is to simplify and/or change the representation of an image into something that is more meaningful and easier to analyse. Image segmentation is typically used to locate objects and boundaries in images. More precisely, image segmentation is the process of assigning a label to every pixel in an image such that pixels with the same label share certain visual characteristics. ACKNOWLEDGEMENT I wish to thank all the co authors who have supported me to a great extent. I wish to thank VIT university for the continuous support we were provided with. REFERENCES [1] [2] [3] [4]
J. Canny, A computational approach to edge detection. IEEE Transactions on Pattern Analysis and Machine Intelligence PAMI-8 6 (1986), R. Deriche, “Using Canny’s criteria to derive a recursively implemented optimal edge detector,” Inr. J. Computer. Vision, pp. 167-187, 1987 Marr, D., Hildreth, E. "Theory of edge detection". Proc. R. Soc. Lond. B, 207, 187-217, 1980 Shin, M.C.; Goldgof, D.B.; Bowyer, K.W.; Nikiforou, S.; " Comparison of edge detection algorithms using a structure from motion task", Systems, Man and Cybernetics, Part B, IEEE Transactions on Volume 31, Issue 4, Page(s):589-601, Aug. 2001
ISSN: 0975-5462
2643